| Param | Original file | Final file |
|---|---|---|
| Filename | modeM0/AS1T05_148T01_9000005838_43013cztM0_level2.fits | modeM0/AS1T05_148T01_9000005838_43013cztM0_level2_quad_clean.evt |
| Size (bytes) | 360,106,560 | 97,243,200 |
| Size | 343.4 MB | 92.7 MB |
| Events in quadrant A | 3,045,968 | 685,048 |
| Events in quadrant B | 3,631,072 | 668,704 |
| Events in quadrant C | 2,468,400 | 661,633 |
| Events in quadrant D | 3,792,749 | 576,124 |
| Mode M9 | |||
|---|---|---|---|
| Quadrant | BADHDUFLAG | Total packets | Discarded packets |
| A | 0 | 24 | 0 |
| B | 0 | 25 | 0 |
| C | 0 | 25 | 0 |
| D | 0 | 25 | 0 |
| Mode SS | |||
|---|---|---|---|
| Quadrant | BADHDUFLAG | Total packets | Discarded packets |
| A | 0 | 104 | 0 |
| B | 0 | 104 | 0 |
| C | 0 | 104 | 0 |
| D | 0 | 104 | 0 |
| Mode M0 | |||
|---|---|---|---|
| Quadrant | BADHDUFLAG | Total packets | Discarded packets |
| A | 0 | 12249 | 2 |
| B | 0 | 14053 | 2 |
| C | 0 | 10326 | 2 |
| D | 0 | 14700 | 2 |
| Quadrant | Total seconds | Saturated seconds | Saturation percentage |
|---|---|---|---|
| A | 5034 | 54 | 1.072706% |
| B | 5034 | 247 | 4.906635% |
| C | 5034 | 4 | 0.079460% |
| D | 5033 | 303 | 6.020266% |
Noise dominated data is calculated using 1-second bins in cleaned event files. If a bin has >2000 counts, and if more than 50% of those come from <1% of pixels, then it is considered to be noise-dominated and hence unusable.
| Quadrant | # 1 sec bins | Bins with >0 counts | Bins with >2000 counts | High rate bins dominated by noise | Noise dominated (total time) | Noise dominated (detector-on time) | Marked lightcurve |
|---|---|---|---|---|---|---|---|
| A | 6977 | 5035 | 32 | 32 | 0.46% | 0.64% | 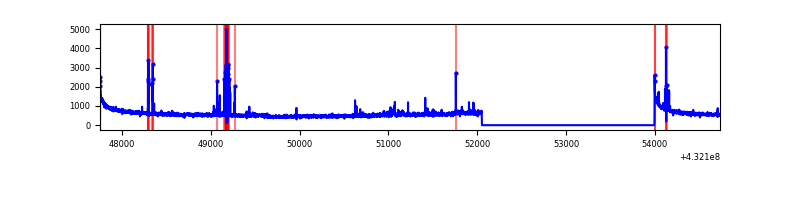 |
| B | 6977 | 5035 | 190 | 190 | 2.72% | 3.77% | 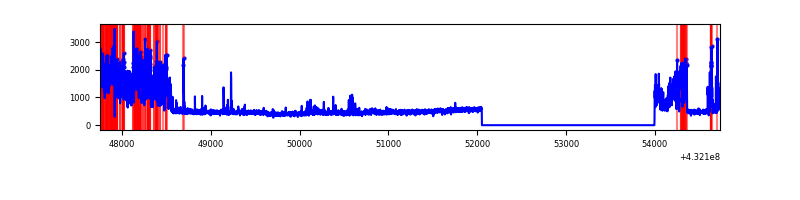 |
| C | 6977 | 5035 | 0 | 0 | 0.00% | 0.00% | 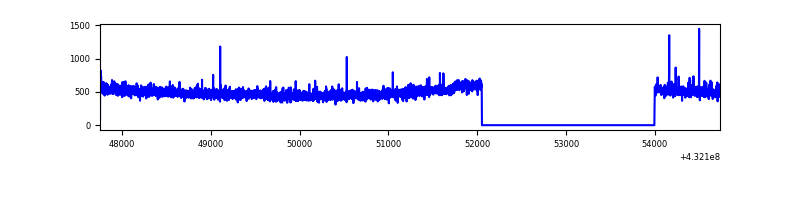 |
| D | 6976 | 5034 | 250 | 250 | 3.58% | 4.97% | 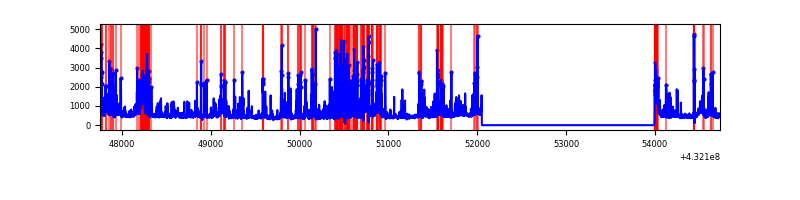 |
Top three noisy pixels from each quadrant. If the there are fewer than three noisy pixels in the level2.evt file, extra rows are filled as -1
| Pixel properties | Quadrant properties | ||||||
|---|---|---|---|---|---|---|---|
| Quadrant | DetID | PixID | Counts | Sigma | Mean | Median | Sigma |
| A | 10 | 83 | 568994 | 4463.74 | 589 | 581 | 127.3 |
| A | 15 | 237 | 142552 | 1114.9 | 589 | 581 | 127.3 |
| A | 13 | 248 | 51524 | 400.06 | 589 | 581 | 127.3 |
| B | 0 | 186 | 1006740 | 8473.91 | 584 | 572 | 118.7 |
| B | 4 | 81 | 138913 | 1165.1 | 584 | 572 | 118.7 |
| B | 5 | 255 | 88363 | 739.37 | 584 | 572 | 118.7 |
| C | 15 | 214 | 208136 | 1465.62 | 576 | 582 | 141.6 |
| C | 15 | 111 | 9232 | 61.08 | 576 | 582 | 141.6 |
| C | 13 | 61 | 4028 | 24.33 | 576 | 582 | 141.6 |
| D | 12 | 6 | 628526 | 4372.61 | 555 | 540 | 143.6 |
| D | 1 | 52 | 393887 | 2738.84 | 555 | 540 | 143.6 |
| D | 10 | 118 | 298722 | 2076.21 | 555 | 540 | 143.6 |
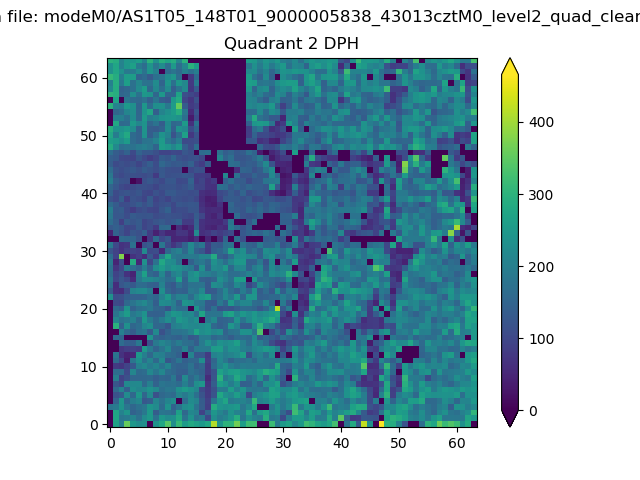
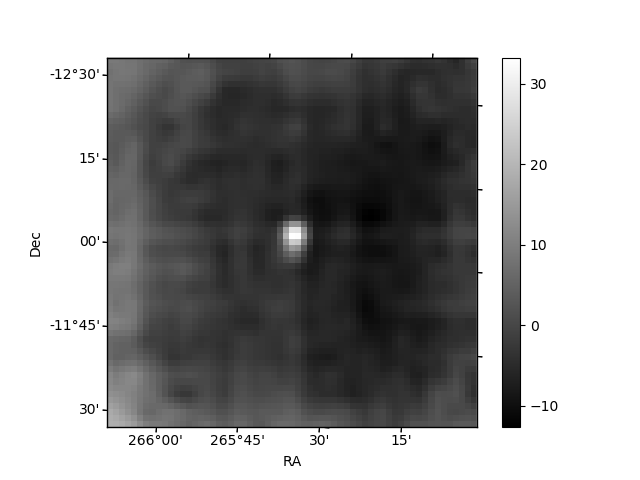
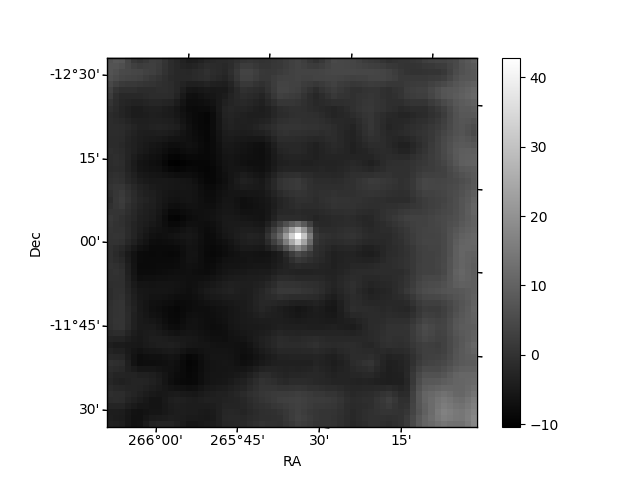
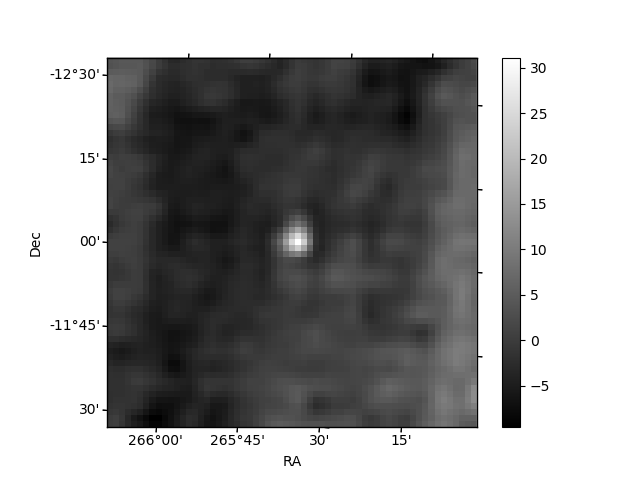
Histogram calculated using DETX and DETY for each event in the final _common_clean file
| Quadrant A | 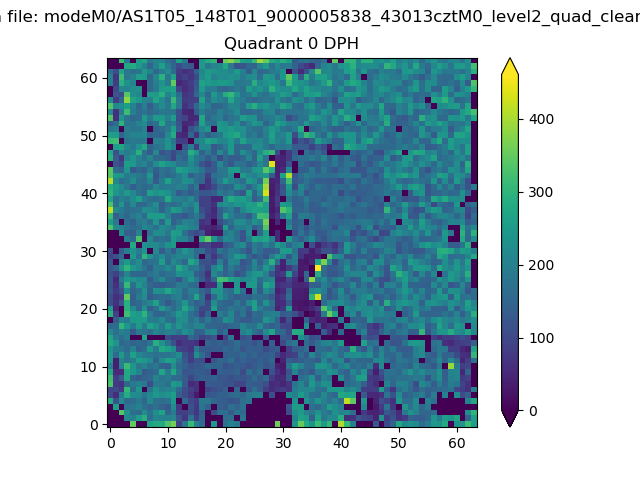 |
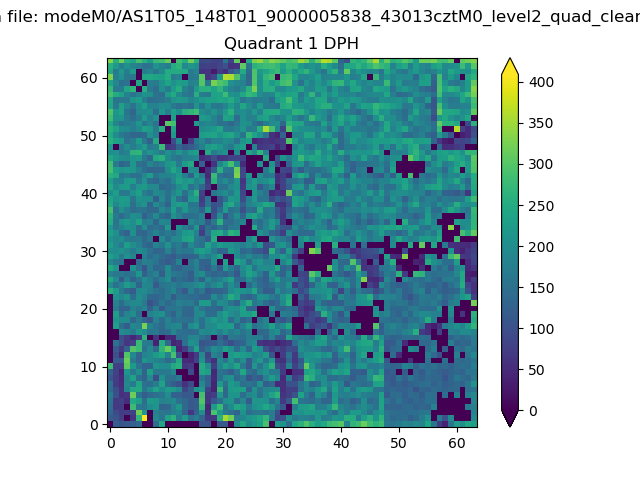 |
Quadrant B |
|---|---|---|---|
| Quadrant D | 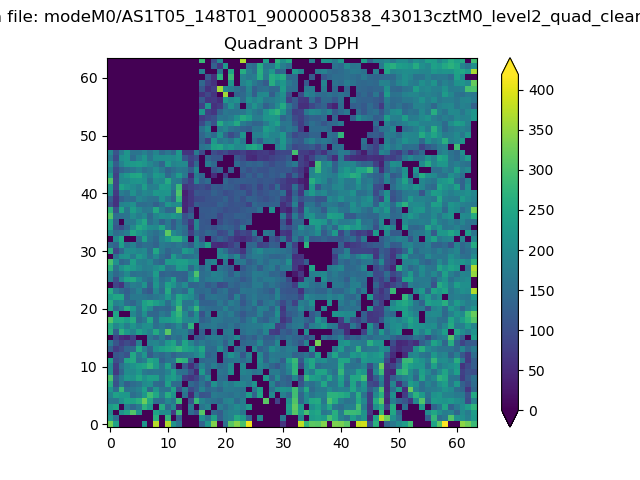 |
 |
Quadrant C |
| Plot type | Count rate plots | Images |
|---|---|---|
| Comparison with Poisson distribution Blue bars denote a histogram of data divided into 1 sec bins. Red curve is a Poisson curve with rate = median count rate of data. |
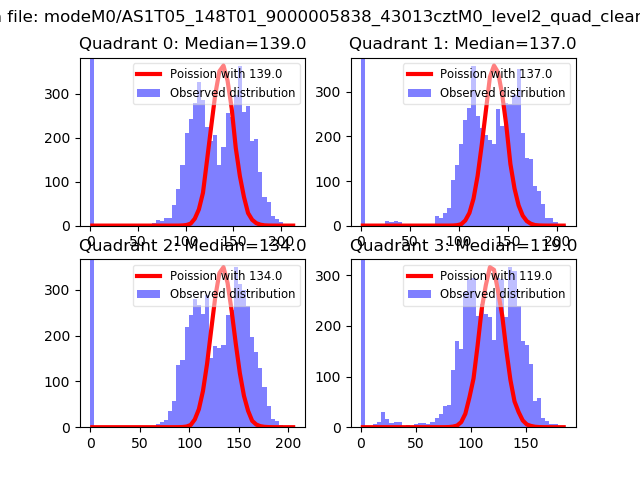 |
 |
| Quadrant-wise count rates Data is divided into 100 sec bins |
 |
|
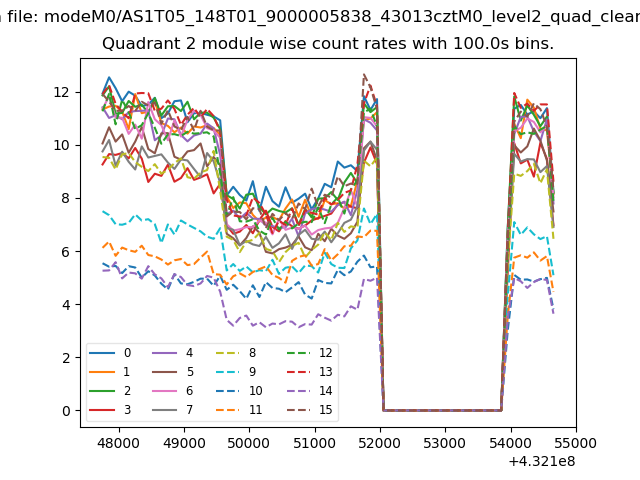
| Module-wise count rates for Quadrant A Data is divided into 100 sec bins |
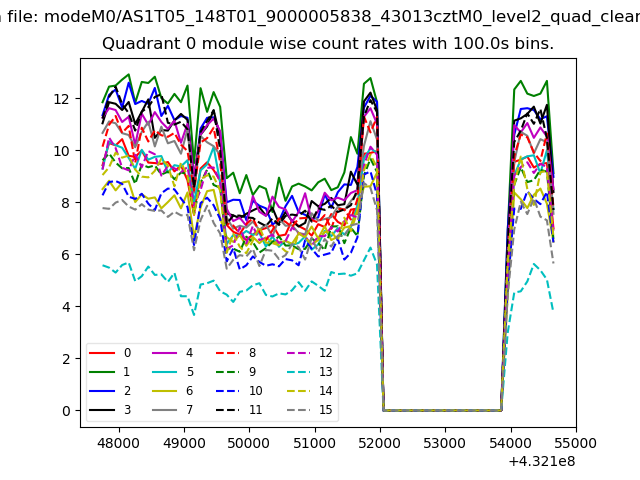 |
 |
| Module-wise count rates for Quadrant B Data is divided into 100 sec bins |
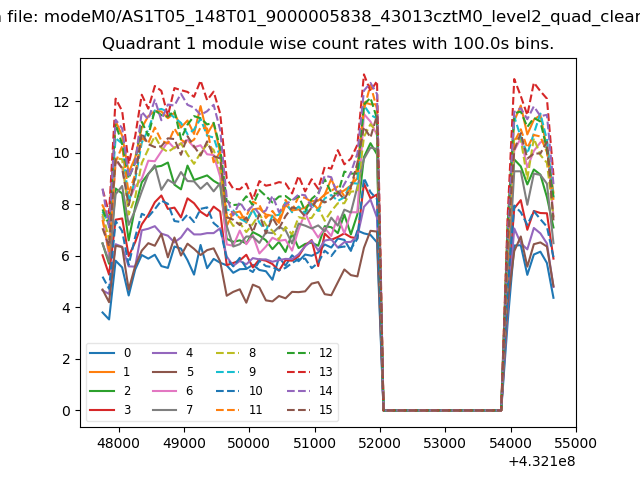 |
 |
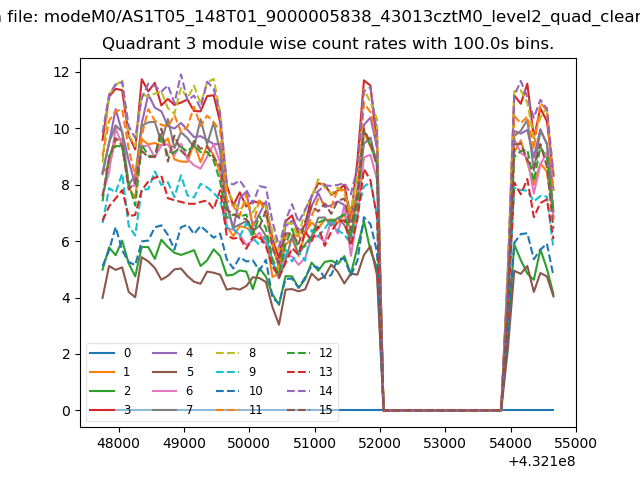
| Module-wise count rates for Quadrant C Data is divided into 100 sec bins |
 |
 |
| Module-wise count rates for Quadrant D Data is divided into 100 sec bins |
 |
 |
| Parameter | Plot |
|---|---|
| CZT HV Monitor | 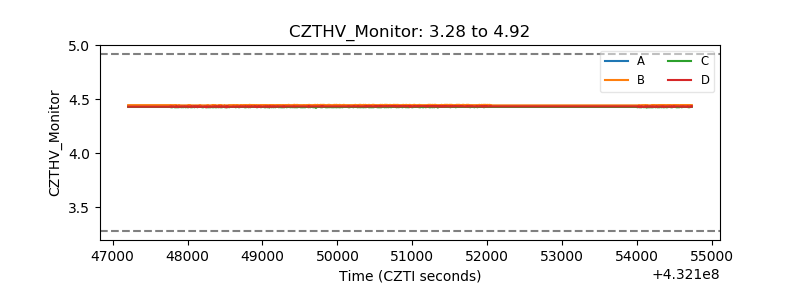 |
| D_VDD | 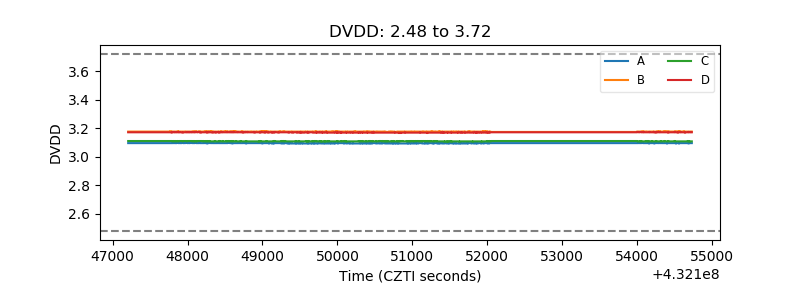 |
| Temperature 1 | 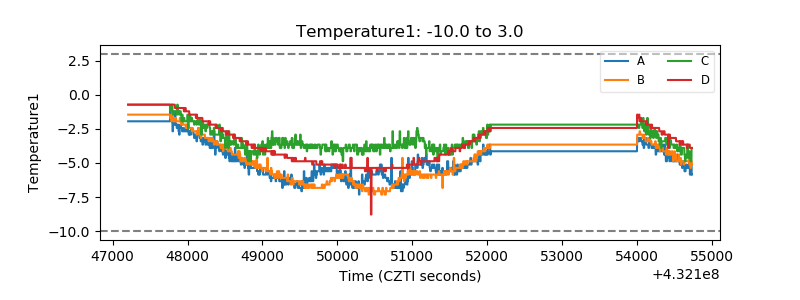 |
| Veto HV Monitor | 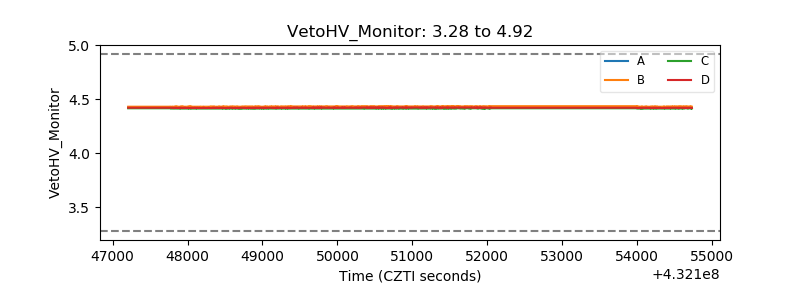 |
| Veto LLD | 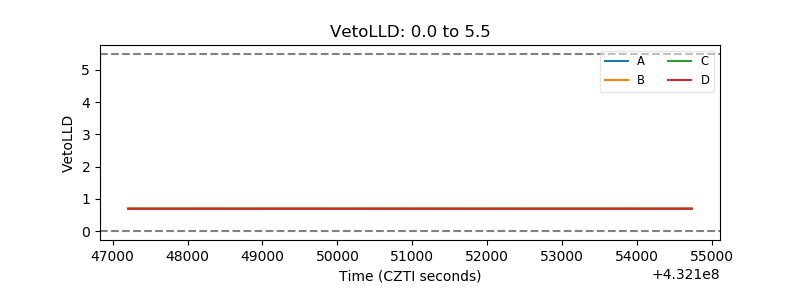 |
| Alpha Counter |  |
| _CPM_Rate |  |
| CZT Counter | 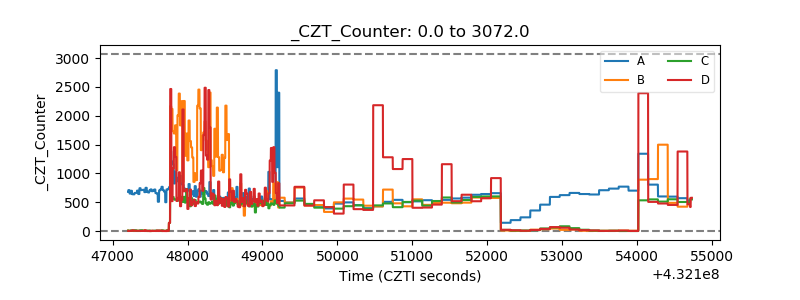 |
| +2.5 Volts monitor | 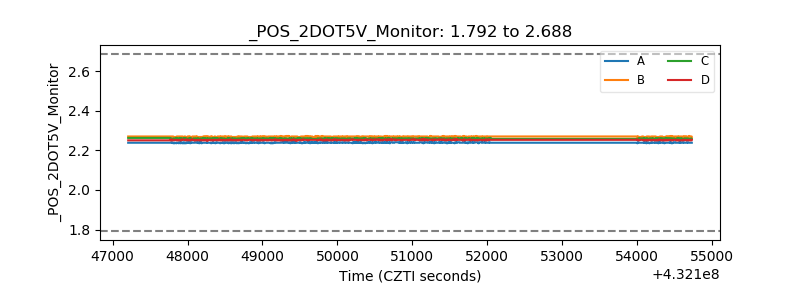 |
| +5 Volts monitor |  |
| _ROLL_ROT |  |
| _Roll_DEC | 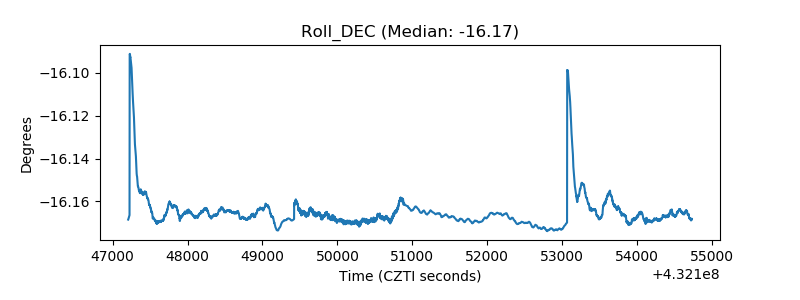 |
| _Roll_RA |  |
| Veto Counter | 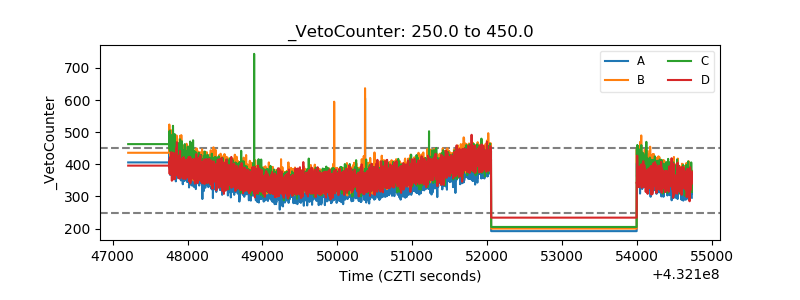 |