| Param | Original file | Final file |
|---|---|---|
| Filename | modeM0/AS1T05_148T01_9000005838_43014cztM0_level2.fits | modeM0/AS1T05_148T01_9000005838_43014cztM0_level2_quad_clean.evt |
| Size (bytes) | 352,843,200 | 105,747,840 |
| Size | 336.5 MB | 100.8 MB |
| Events in quadrant A | 3,272,696 | 734,442 |
| Events in quadrant B | 3,141,188 | 740,241 |
| Events in quadrant C | 2,693,831 | 711,825 |
| Events in quadrant D | 3,529,021 | 633,900 |
| Mode M9 | |||
|---|---|---|---|
| Quadrant | BADHDUFLAG | Total packets | Discarded packets |
| A | 0 | 26 | 0 |
| B | 0 | 27 | 0 |
| C | 0 | 27 | 0 |
| D | 0 | 27 | 0 |
| Mode SS | |||
|---|---|---|---|
| Quadrant | BADHDUFLAG | Total packets | Discarded packets |
| A | 0 | 112 | 0 |
| B | 0 | 112 | 0 |
| C | 0 | 112 | 0 |
| D | 0 | 112 | 0 |
| Mode M0 | |||
|---|---|---|---|
| Quadrant | BADHDUFLAG | Total packets | Discarded packets |
| A | 0 | 13334 | 2 |
| B | 0 | 12918 | 2 |
| C | 0 | 11300 | 2 |
| D | 0 | 14182 | 2 |
| Quadrant | Total seconds | Saturated seconds | Saturation percentage |
|---|---|---|---|
| A | 5454 | 52 | 0.953429% |
| B | 5454 | 84 | 1.540154% |
| C | 5454 | 8 | 0.146681% |
| D | 5453 | 146 | 2.677425% |
Noise dominated data is calculated using 1-second bins in cleaned event files. If a bin has >2000 counts, and if more than 50% of those come from <1% of pixels, then it is considered to be noise-dominated and hence unusable.
| Quadrant | # 1 sec bins | Bins with >0 counts | Bins with >2000 counts | High rate bins dominated by noise | Noise dominated (total time) | Noise dominated (detector-on time) | Marked lightcurve |
|---|---|---|---|---|---|---|---|
| A | 7067 | 5455 | 23 | 23 | 0.33% | 0.42% | 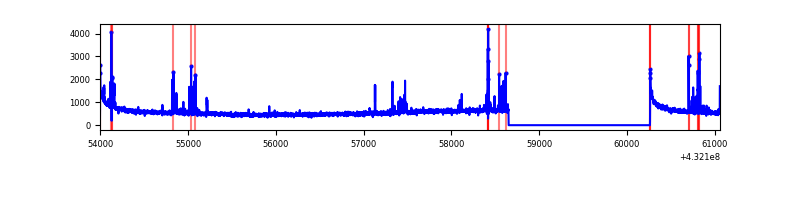 |
| B | 7067 | 5455 | 63 | 63 | 0.89% | 1.15% | 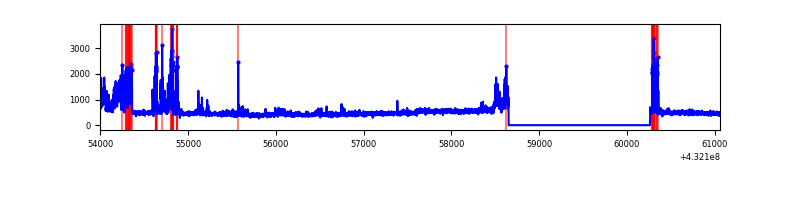 |
| C | 7067 | 5455 | 1 | 1 | 0.01% | 0.02% | 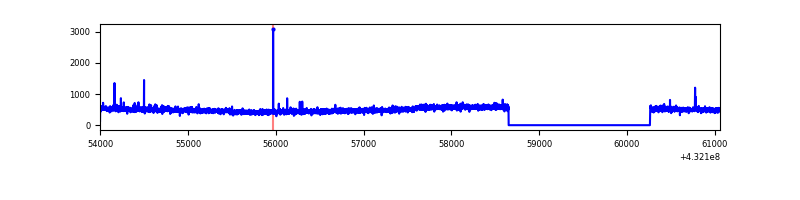 |
| D | 7066 | 5454 | 149 | 149 | 2.11% | 2.73% | 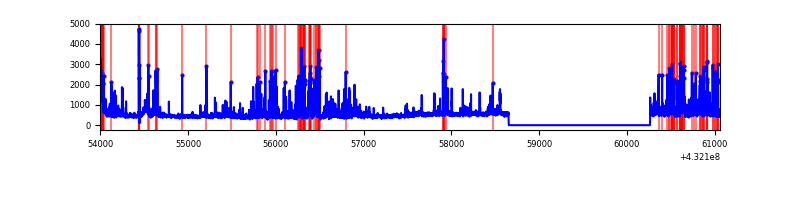 |
Top three noisy pixels from each quadrant. If the there are fewer than three noisy pixels in the level2.evt file, extra rows are filled as -1
| Pixel properties | Quadrant properties | ||||||
|---|---|---|---|---|---|---|---|
| Quadrant | DetID | PixID | Counts | Sigma | Mean | Median | Sigma |
| A | 10 | 83 | 589205 | 4203.01 | 642 | 631 | 140.0 |
| A | 15 | 237 | 146675 | 1042.9 | 642 | 631 | 140.0 |
| A | 13 | 248 | 51265 | 361.57 | 642 | 631 | 140.0 |
| B | 0 | 186 | 322742 | 2472.33 | 638 | 624 | 130.3 |
| B | 5 | 255 | 251214 | 1923.34 | 638 | 624 | 130.3 |
| B | 4 | 171 | 46382 | 351.2 | 638 | 624 | 130.3 |
| C | 15 | 214 | 235724 | 1517.56 | 625 | 633 | 154.9 |
| C | 15 | 111 | 9806 | 59.21 | 625 | 633 | 154.9 |
| C | 12 | 249 | 8685 | 51.98 | 625 | 633 | 154.9 |
| D | 12 | 16 | 257505 | 1589.48 | 616 | 598 | 161.6 |
| D | 1 | 52 | 222779 | 1374.63 | 616 | 598 | 161.6 |
| D | 1 | 47 | 181592 | 1119.81 | 616 | 598 | 161.6 |
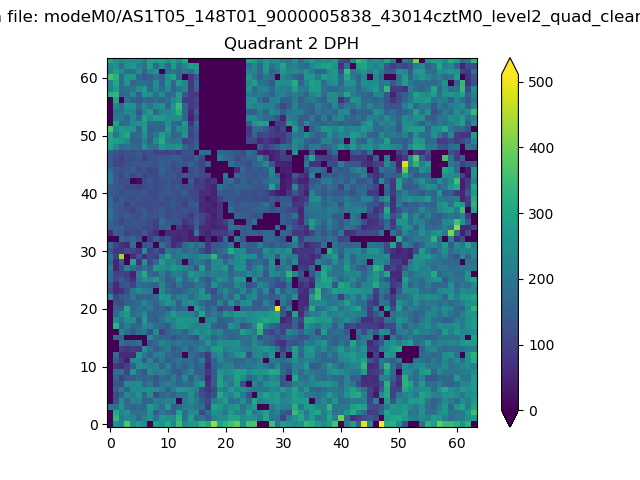
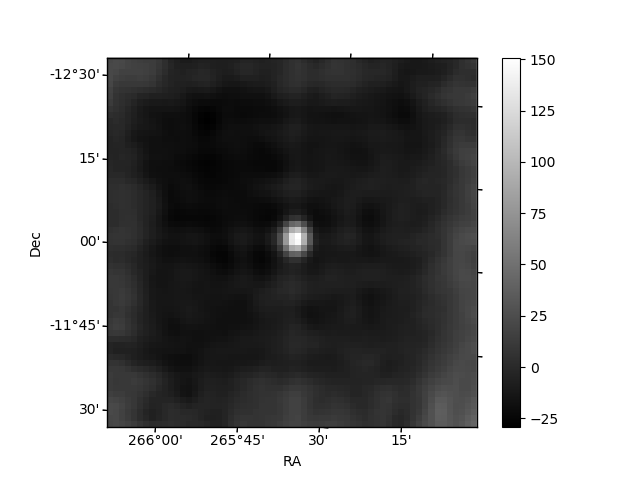
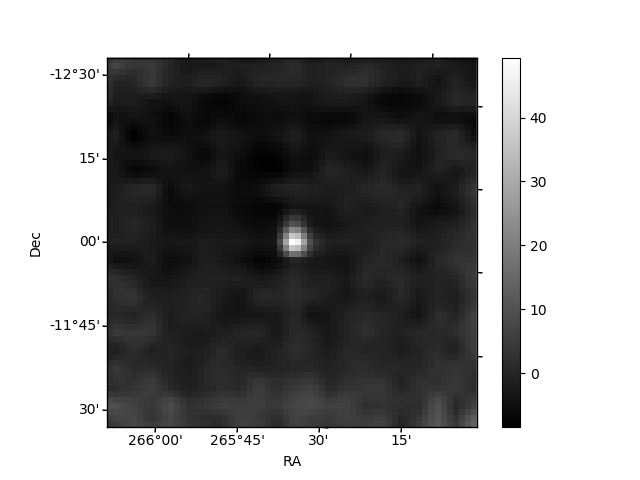
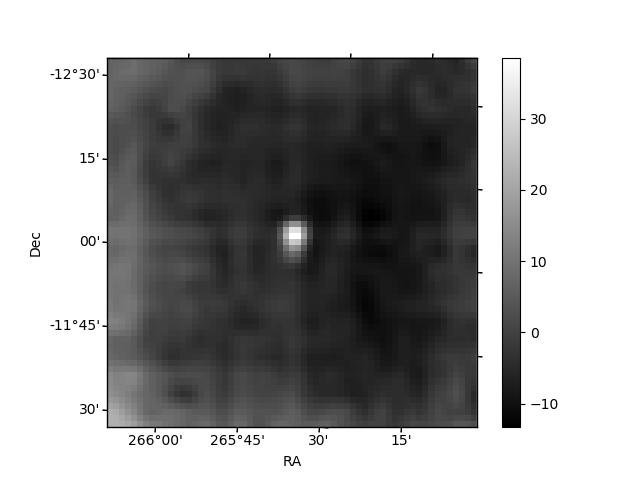
Histogram calculated using DETX and DETY for each event in the final _common_clean file
| Quadrant A | 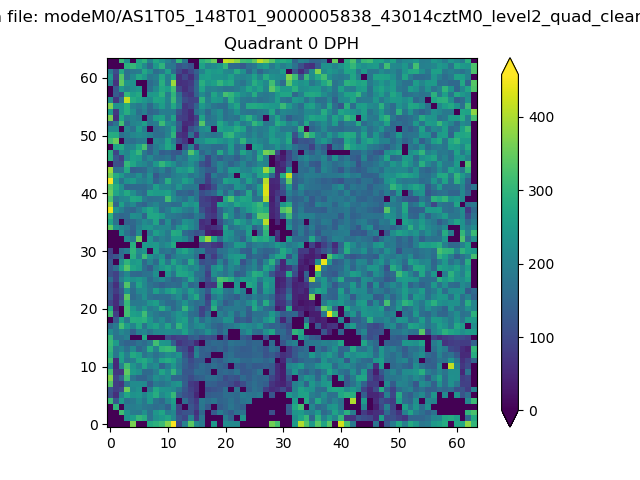 |
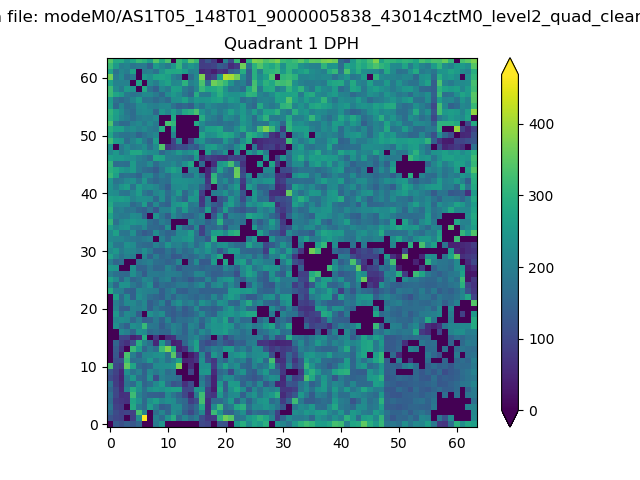 |
Quadrant B |
|---|---|---|---|
| Quadrant D | 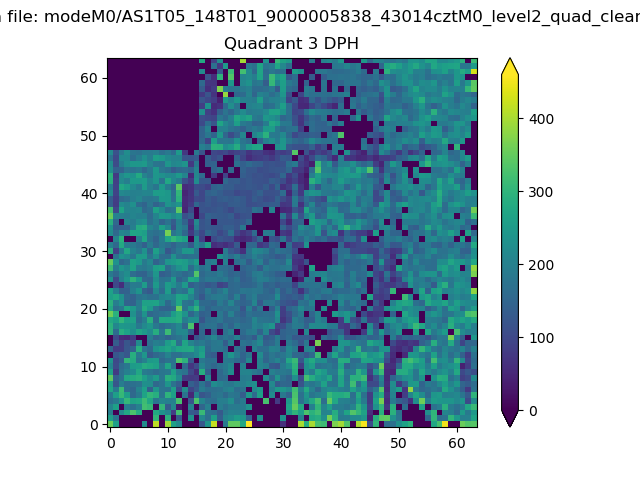 |
 |
Quadrant C |
| Plot type | Count rate plots | Images |
|---|---|---|
| Comparison with Poisson distribution Blue bars denote a histogram of data divided into 1 sec bins. Red curve is a Poisson curve with rate = median count rate of data. |
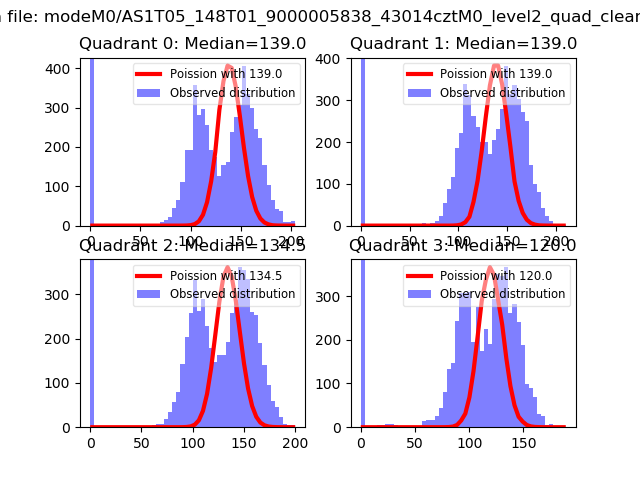 |
 |
| Quadrant-wise count rates Data is divided into 100 sec bins |
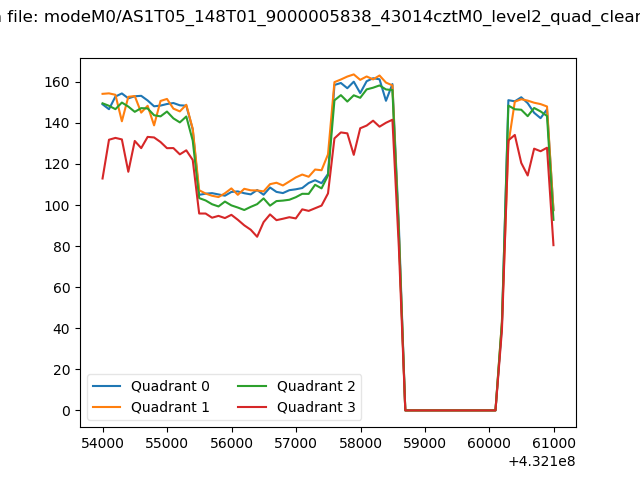 |
|
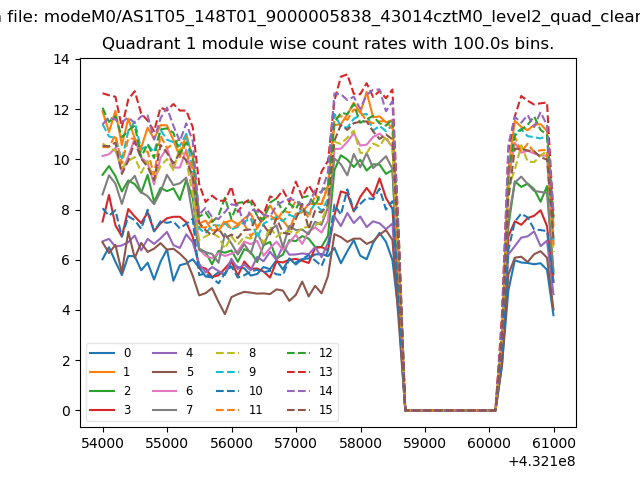
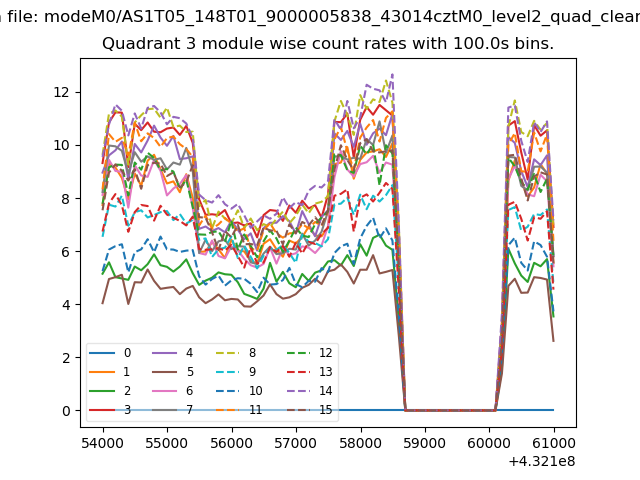
| Module-wise count rates for Quadrant A Data is divided into 100 sec bins |
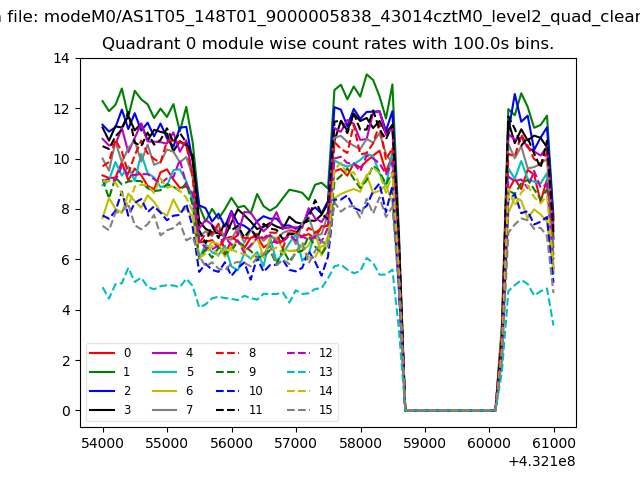 |
 |
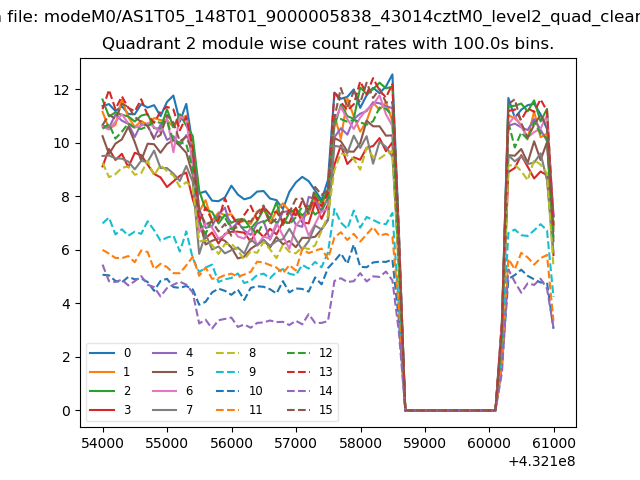
| Module-wise count rates for Quadrant B Data is divided into 100 sec bins |
 |
 |
| Module-wise count rates for Quadrant C Data is divided into 100 sec bins |
 |
 |
| Module-wise count rates for Quadrant D Data is divided into 100 sec bins |
 |
 |
| Parameter | Plot |
|---|---|
| CZT HV Monitor | 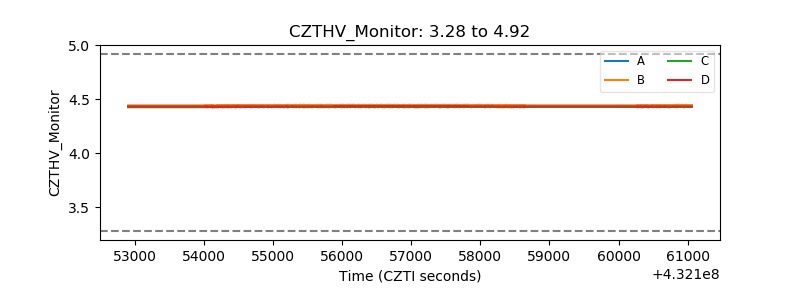 |
| D_VDD | 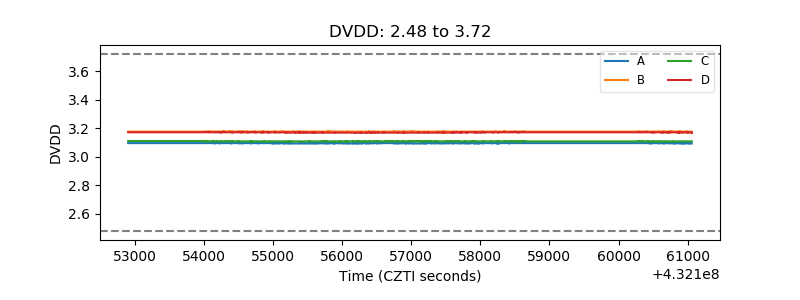 |
| Temperature 1 | 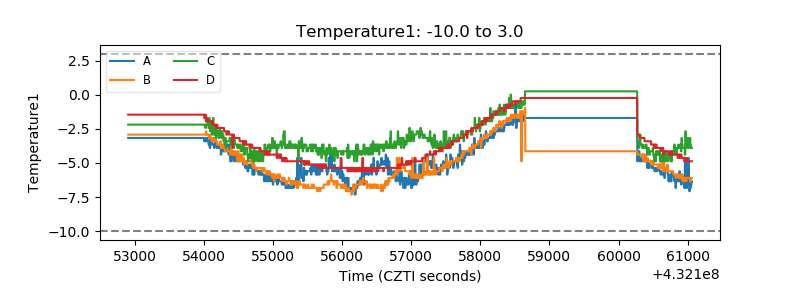 |
| Veto HV Monitor |  |
| Veto LLD | 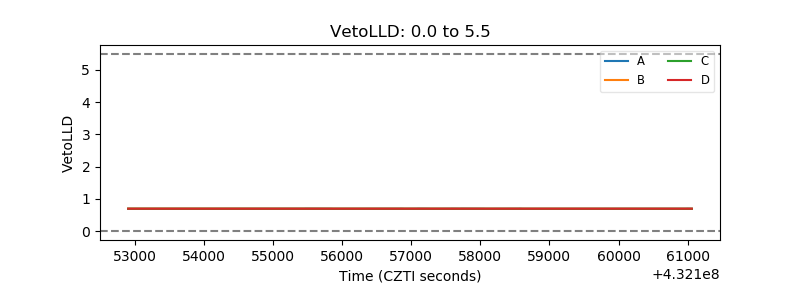 |
| Alpha Counter | 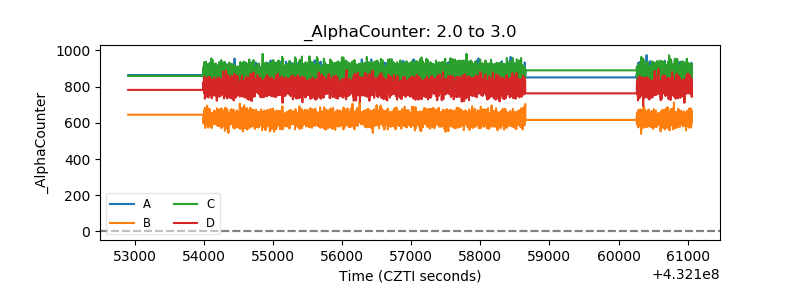 |
| _CPM_Rate | 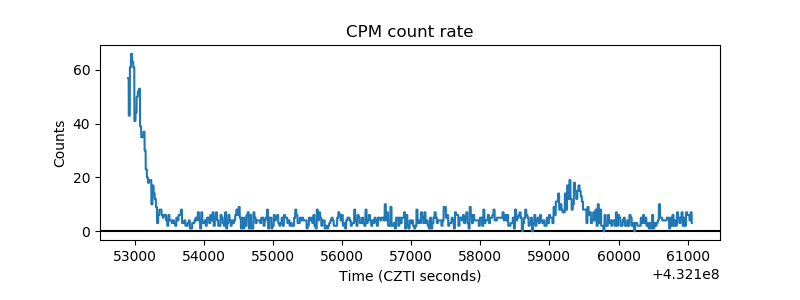 |
| CZT Counter | 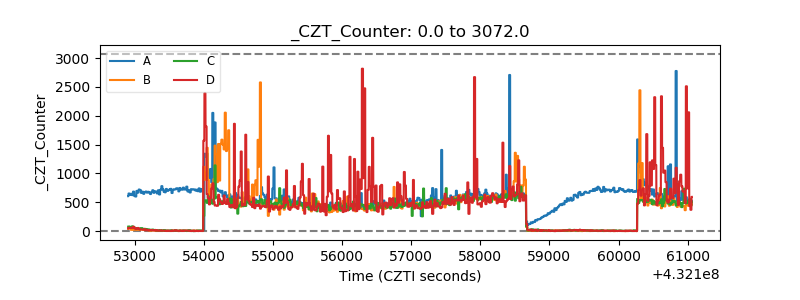 |
| +2.5 Volts monitor | 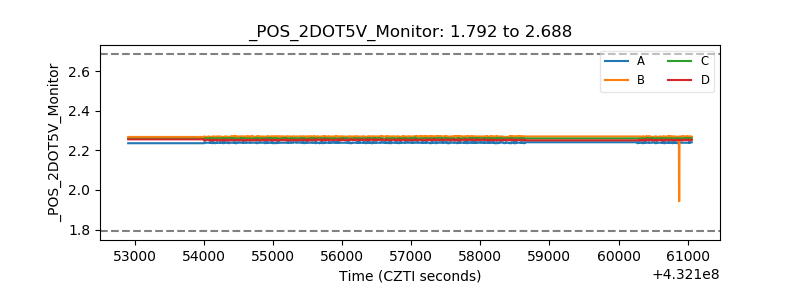 |
| +5 Volts monitor |  |
| _ROLL_ROT | 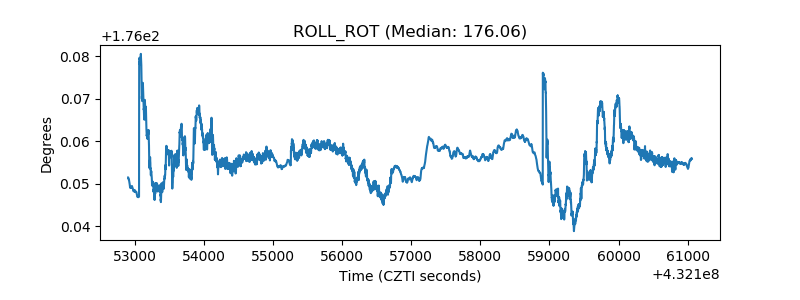 |
| _Roll_DEC | 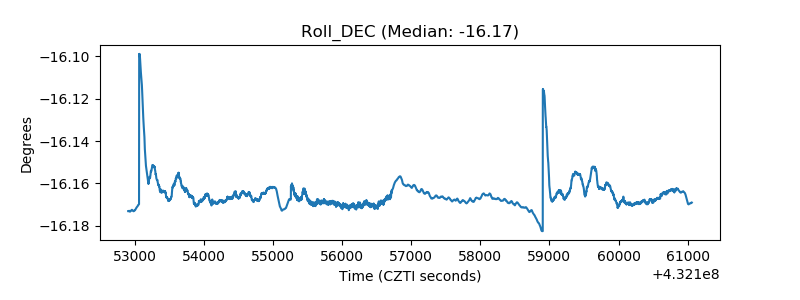 |
| _Roll_RA | 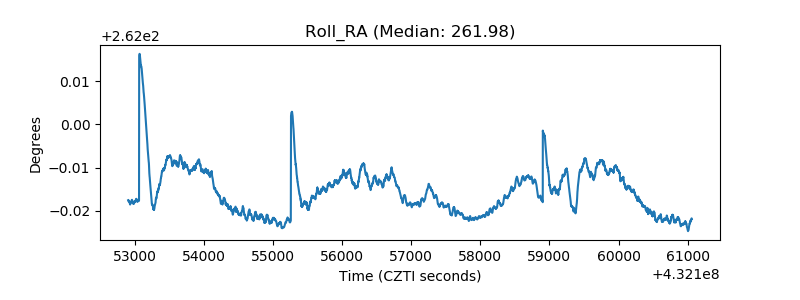 |
| Veto Counter | 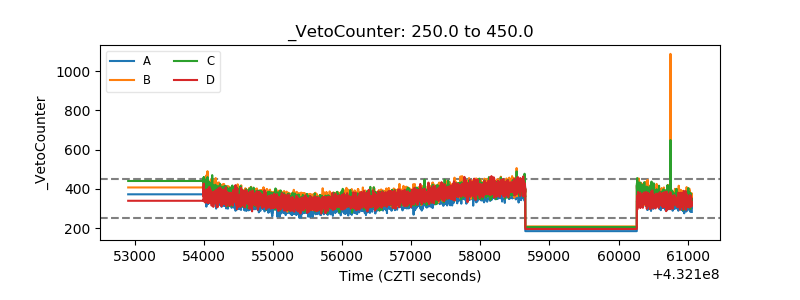 |