| Param | Original file | Final file |
|---|---|---|
| Filename | modeM0/AS1T05_148T01_9000005838_43016cztM0_level2.fits | modeM0/AS1T05_148T01_9000005838_43016cztM0_level2_quad_clean.evt |
| Size (bytes) | 385,721,280 | 110,888,640 |
| Size | 367.9 MB | 105.8 MB |
| Events in quadrant A | 3,543,558 | 762,478 |
| Events in quadrant B | 3,458,409 | 774,310 |
| Events in quadrant C | 2,917,101 | 743,461 |
| Events in quadrant D | 3,896,908 | 662,582 |
| Mode M9 | |||
|---|---|---|---|
| Quadrant | BADHDUFLAG | Total packets | Discarded packets |
| A | 0 | 27 | 0 |
| B | 0 | 27 | 0 |
| C | 0 | 27 | 0 |
| D | 0 | 27 | 0 |
| Mode SS | |||
|---|---|---|---|
| Quadrant | BADHDUFLAG | Total packets | Discarded packets |
| A | 0 | 122 | 0 |
| B | 0 | 122 | 0 |
| C | 0 | 122 | 0 |
| D | 0 | 122 | 0 |
| Mode M0 | |||
|---|---|---|---|
| Quadrant | BADHDUFLAG | Total packets | Discarded packets |
| A | 0 | 14463 | 2 |
| B | 0 | 14412 | 2 |
| C | 0 | 12221 | 2 |
| D | 0 | 15717 | 2 |
| Quadrant | Total seconds | Saturated seconds | Saturation percentage |
|---|---|---|---|
| A | 5942 | 107 | 1.800740% |
| B | 5943 | 92 | 1.548040% |
| C | 5943 | 3 | 0.050480% |
| D | 5943 | 166 | 2.793202% |
Noise dominated data is calculated using 1-second bins in cleaned event files. If a bin has >2000 counts, and if more than 50% of those come from <1% of pixels, then it is considered to be noise-dominated and hence unusable.
| Quadrant | # 1 sec bins | Bins with >0 counts | Bins with >2000 counts | High rate bins dominated by noise | Noise dominated (total time) | Noise dominated (detector-on time) | Marked lightcurve |
|---|---|---|---|---|---|---|---|
| A | 8597 | 5943 | 65 | 65 | 0.76% | 1.09% | 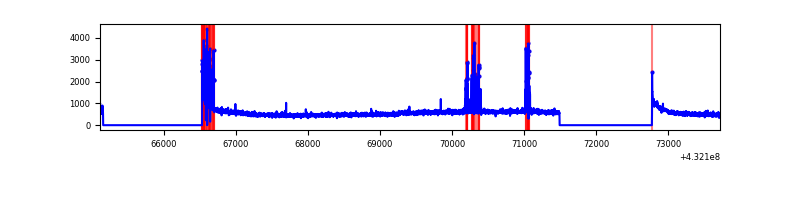 |
| B | 8598 | 5945 | 46 | 46 | 0.54% | 0.77% | 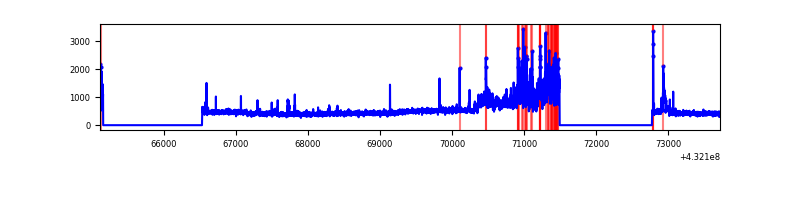 |
| C | 8598 | 5945 | 0 | 0 | 0.00% | 0.00% | 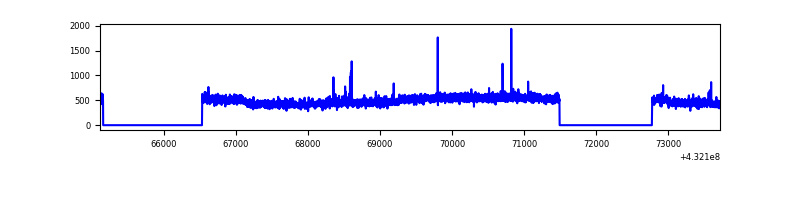 |
| D | 8598 | 5945 | 127 | 127 | 1.48% | 2.14% | 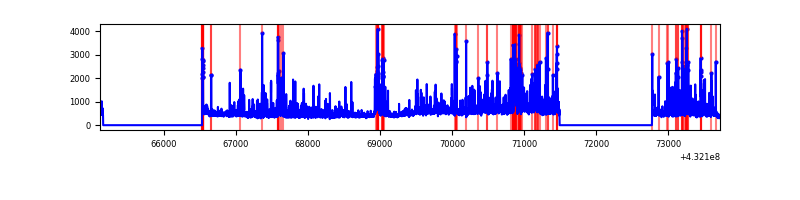 |
Top three noisy pixels from each quadrant. If the there are fewer than three noisy pixels in the level2.evt file, extra rows are filled as -1
| Pixel properties | Quadrant properties | ||||||
|---|---|---|---|---|---|---|---|
| Quadrant | DetID | PixID | Counts | Sigma | Mean | Median | Sigma |
| A | 10 | 83 | 616289 | 4204.51 | 689 | 678 | 146.4 |
| A | 15 | 237 | 250427 | 1705.74 | 689 | 678 | 146.4 |
| A | 13 | 6 | 7606 | 47.32 | 689 | 678 | 146.4 |
| B | 0 | 186 | 576933 | 4159.14 | 687 | 673 | 138.6 |
| B | 5 | 255 | 66553 | 475.49 | 687 | 673 | 138.6 |
| B | 4 | 171 | 59577 | 425.14 | 687 | 673 | 138.6 |
| C | 15 | 214 | 258954 | 1570.6 | 674 | 683 | 164.4 |
| C | 0 | 239 | 18518 | 108.46 | 674 | 683 | 164.4 |
| C | 15 | 111 | 9054 | 50.91 | 674 | 683 | 164.4 |
| D | 1 | 52 | 497909 | 2917.97 | 663 | 645 | 170.4 |
| D | 13 | 249 | 332985 | 1950.19 | 663 | 645 | 170.4 |
| D | 12 | 6 | 209735 | 1226.95 | 663 | 645 | 170.4 |
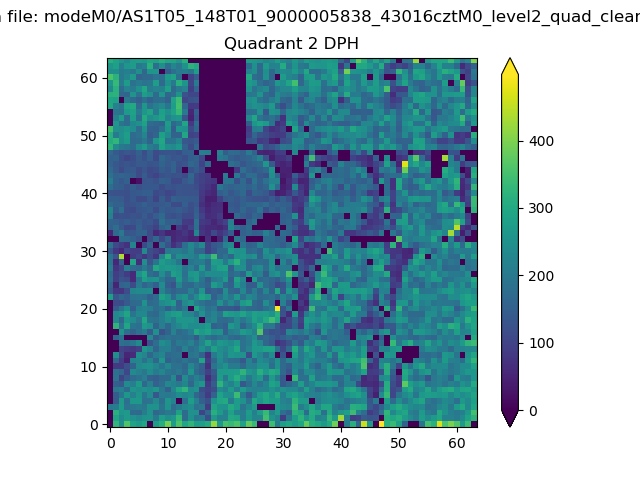
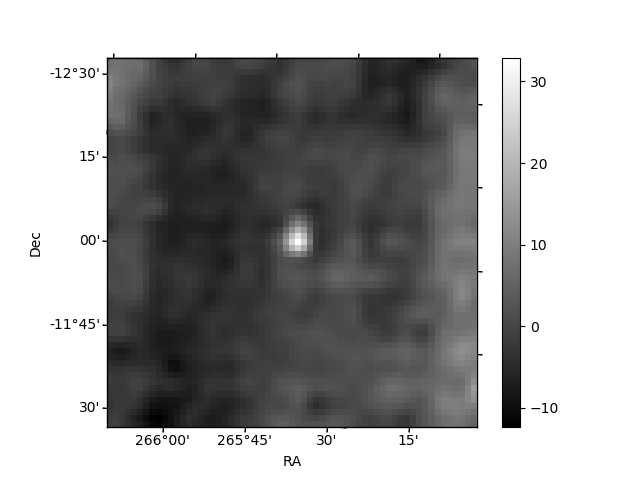
Histogram calculated using DETX and DETY for each event in the final _common_clean file
| Quadrant A | 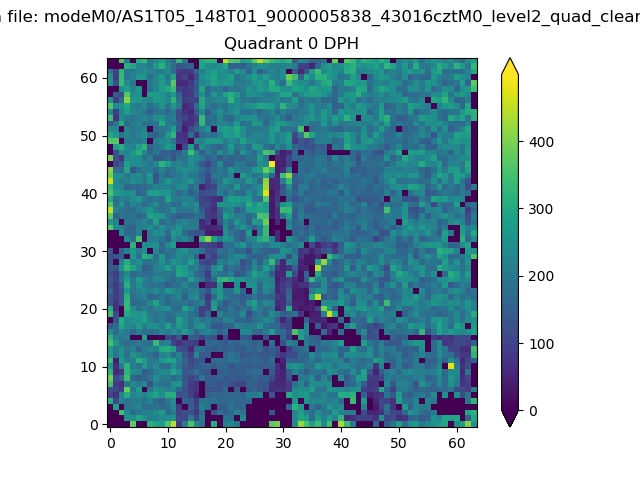 |
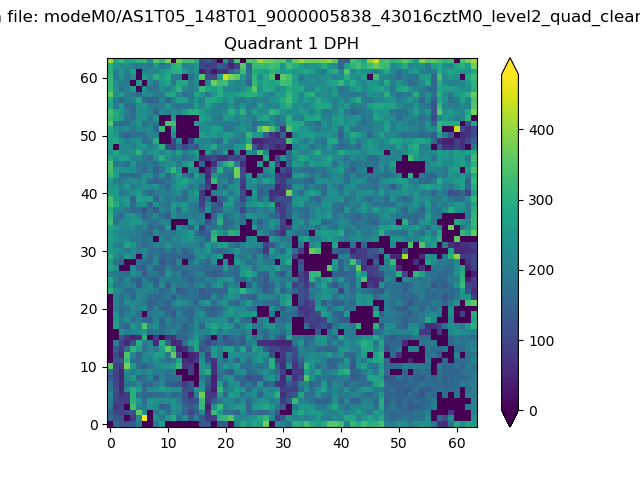 |
Quadrant B |
|---|---|---|---|
| Quadrant D | 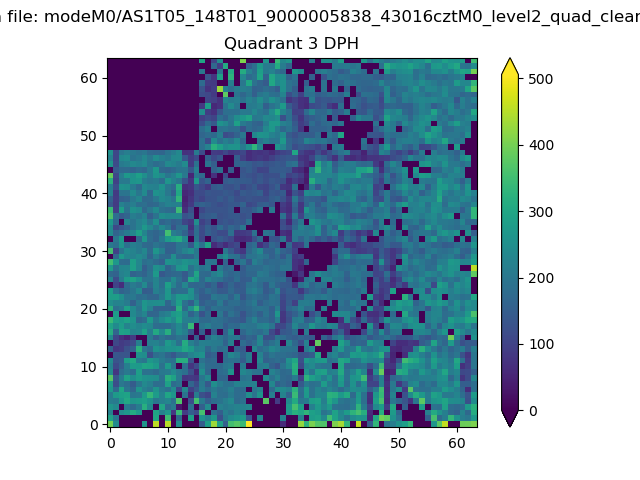 |
 |
Quadrant C |
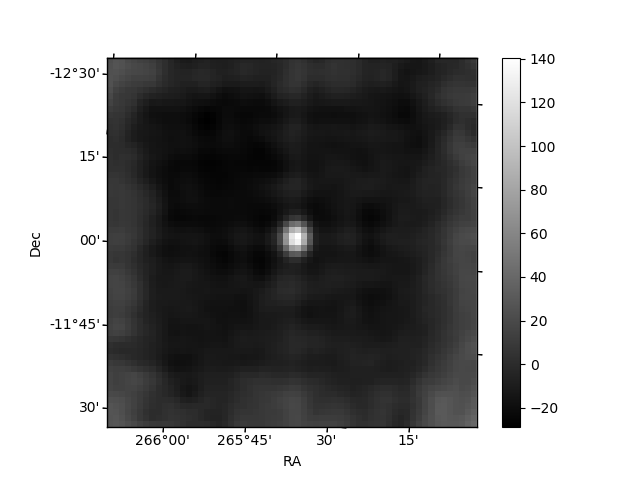
| Plot type | Count rate plots | Images |
|---|---|---|
| Comparison with Poisson distribution Blue bars denote a histogram of data divided into 1 sec bins. Red curve is a Poisson curve with rate = median count rate of data. |
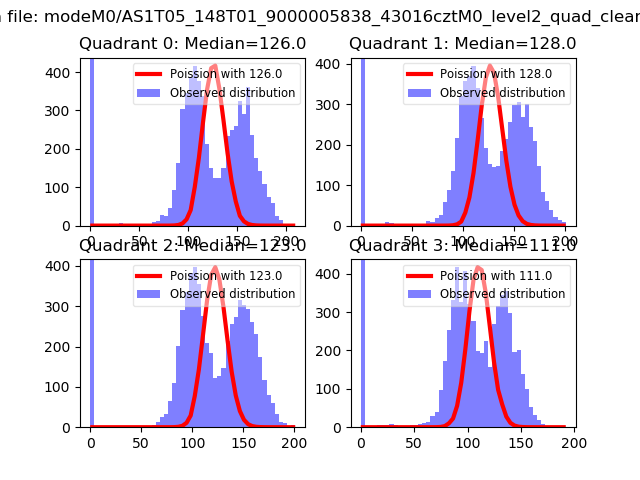 |
 |
| Quadrant-wise count rates Data is divided into 100 sec bins |
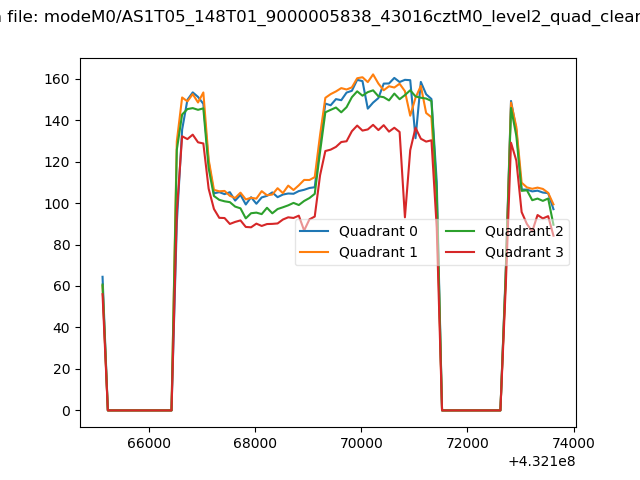 |
|
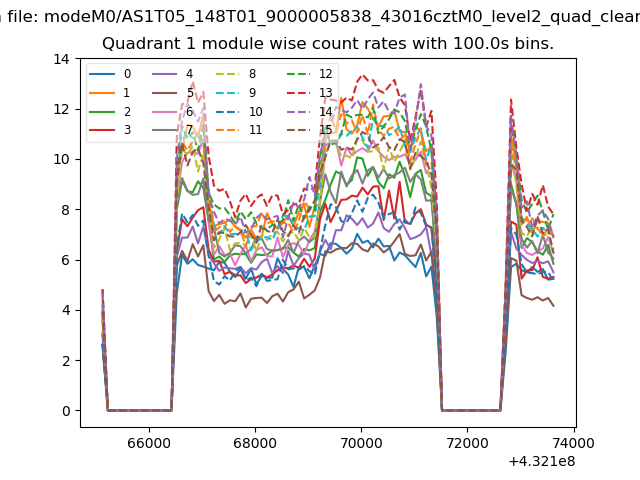
| Module-wise count rates for Quadrant A Data is divided into 100 sec bins |
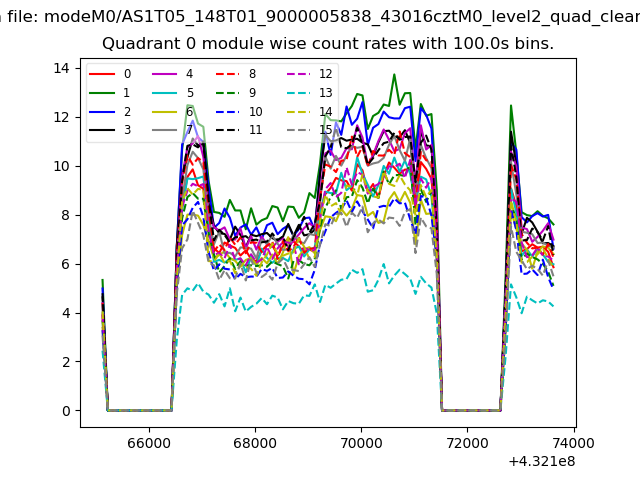 |
 |
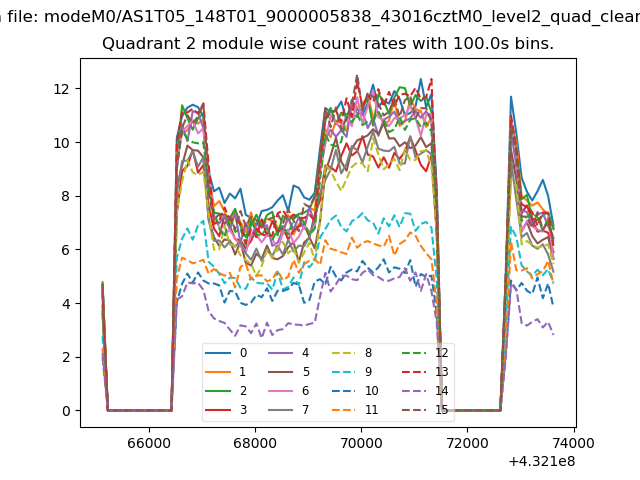
| Module-wise count rates for Quadrant B Data is divided into 100 sec bins |
 |
 |
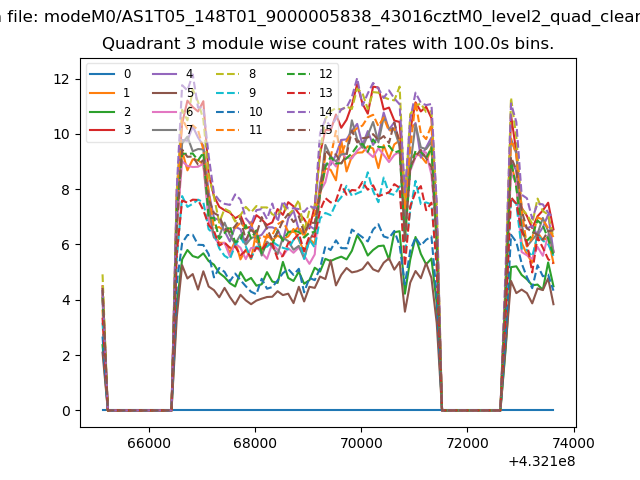
| Module-wise count rates for Quadrant C Data is divided into 100 sec bins |
 |
 |
| Module-wise count rates for Quadrant D Data is divided into 100 sec bins |
 |
 |
| Parameter | Plot |
|---|---|
| CZT HV Monitor | 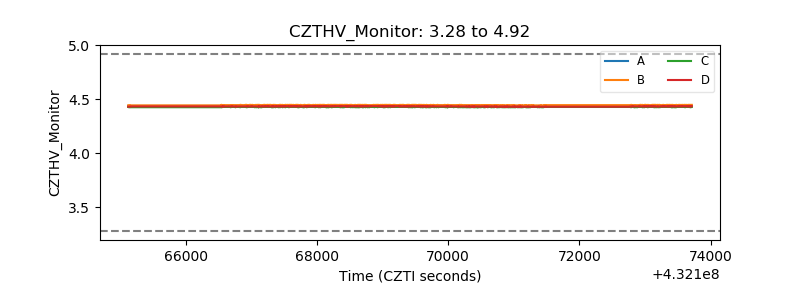 |
| D_VDD | 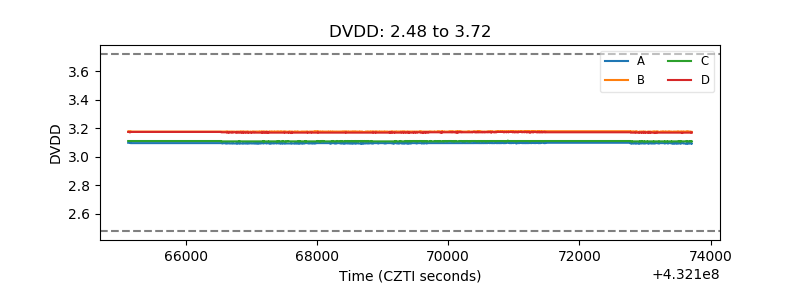 |
| Temperature 1 | 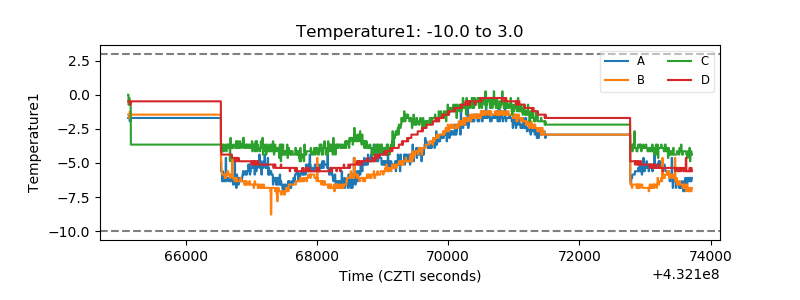 |
| Veto HV Monitor | 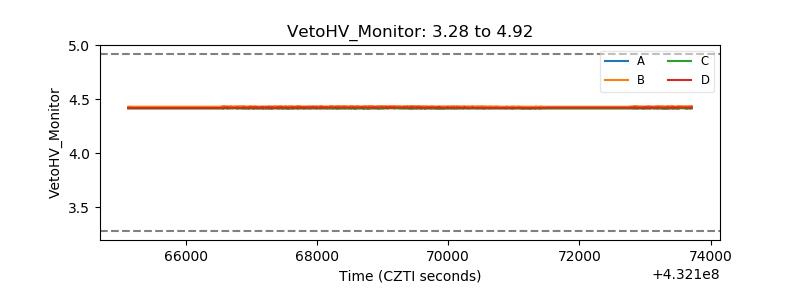 |
| Veto LLD | 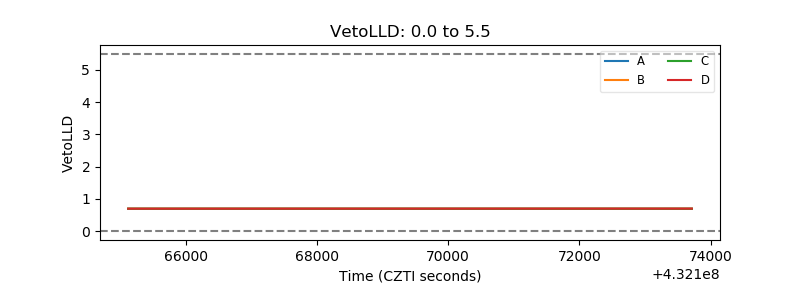 |
| Alpha Counter | 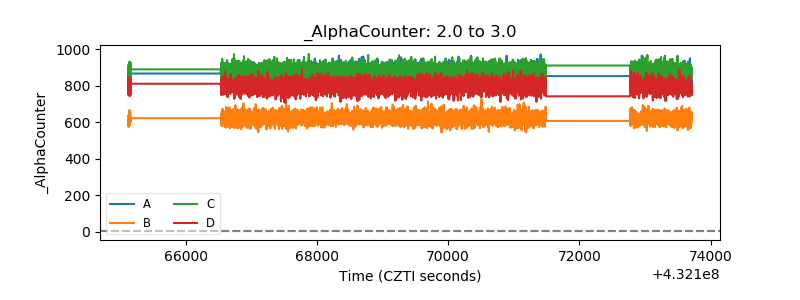 |
| _CPM_Rate |  |
| CZT Counter | 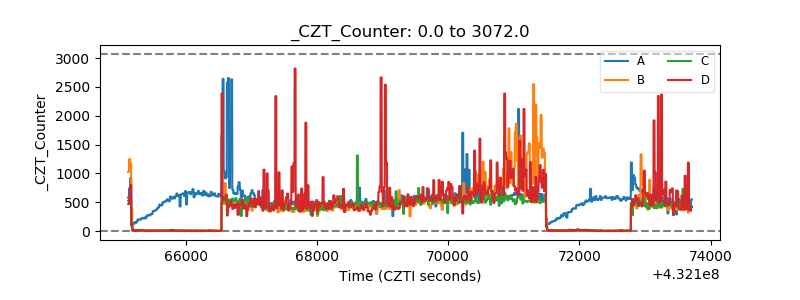 |
| +2.5 Volts monitor |  |
| +5 Volts monitor | 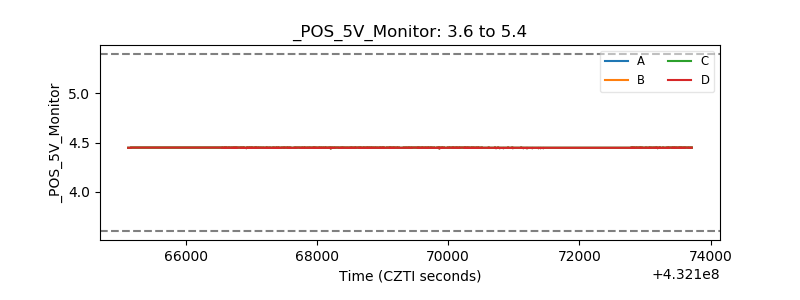 |
| _ROLL_ROT | 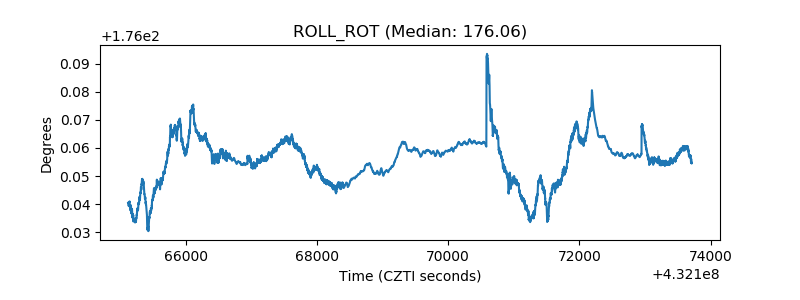 |
| _Roll_DEC | 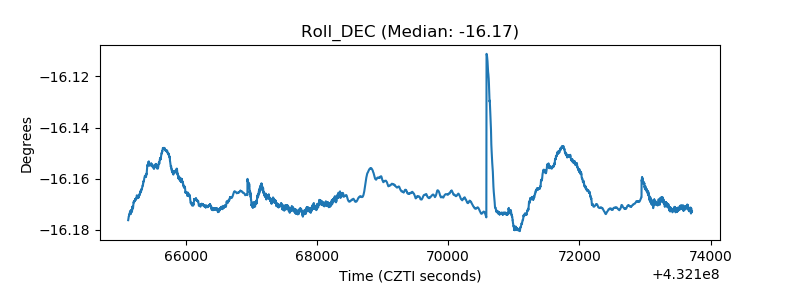 |
| _Roll_RA | 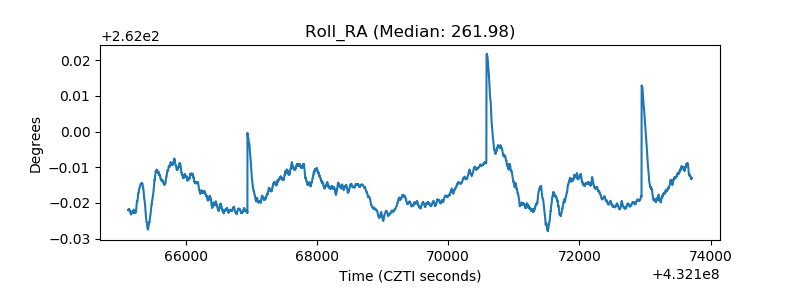 |
| Veto Counter | 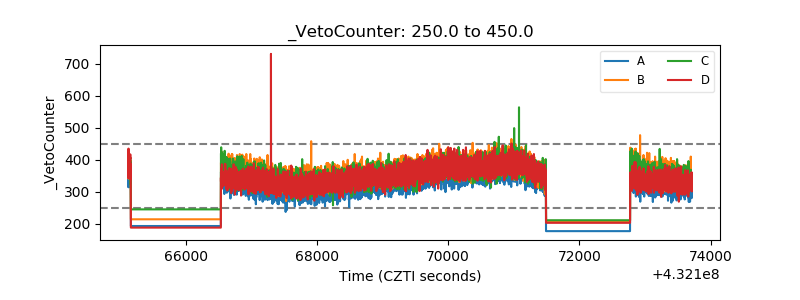 |