| Param | Original file | Final file |
|---|---|---|
| Filename | modeM0/AS1T05_148T01_9000005838_43018cztM0_level2.fits | modeM0/AS1T05_148T01_9000005838_43018cztM0_level2_quad_clean.evt |
| Size (bytes) | 698,160,960 | 182,779,200 |
| Size | 665.8 MB | 174.3 MB |
| Events in quadrant A | 5,513,934 | 1,288,612 |
| Events in quadrant B | 6,970,134 | 1,262,417 |
| Events in quadrant C | 4,907,880 | 1,247,382 |
| Events in quadrant D | 7,690,303 | 1,054,853 |
| Mode M9 | |||
|---|---|---|---|
| Quadrant | BADHDUFLAG | Total packets | Discarded packets |
| A | 0 | 20 | 0 |
| B | 0 | 21 | 0 |
| C | 0 | 21 | 0 |
| D | 0 | 21 | 0 |
| Mode SS | |||
|---|---|---|---|
| Quadrant | BADHDUFLAG | Total packets | Discarded packets |
| A | 0 | 202 | 0 |
| B | 0 | 202 | 0 |
| C | 0 | 202 | 0 |
| D | 0 | 202 | 0 |
| Mode M0 | |||
|---|---|---|---|
| Quadrant | BADHDUFLAG | Total packets | Discarded packets |
| A | 0 | 22379 | 2 |
| B | 0 | 27434 | 2 |
| C | 0 | 20235 | 2 |
| D | 0 | 29643 | 2 |
| Quadrant | Total seconds | Saturated seconds | Saturation percentage |
|---|---|---|---|
| A | 9825 | 38 | 0.386768% |
| B | 9825 | 499 | 5.078880% |
| C | 9825 | 14 | 0.142494% |
| D | 9825 | 758 | 7.715013% |
Noise dominated data is calculated using 1-second bins in cleaned event files. If a bin has >2000 counts, and if more than 50% of those come from <1% of pixels, then it is considered to be noise-dominated and hence unusable.
| Quadrant | # 1 sec bins | Bins with >0 counts | Bins with >2000 counts | High rate bins dominated by noise | Noise dominated (total time) | Noise dominated (detector-on time) | Marked lightcurve |
|---|---|---|---|---|---|---|---|
| A | 11138 | 9826 | 14 | 14 | 0.13% | 0.14% |  |
| B | 11138 | 9826 | 326 | 326 | 2.93% | 3.32% | 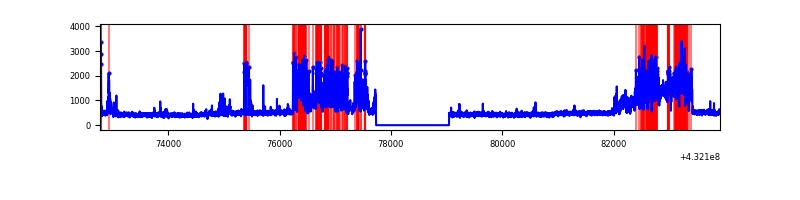 |
| C | 11138 | 9826 | 8 | 8 | 0.07% | 0.08% | 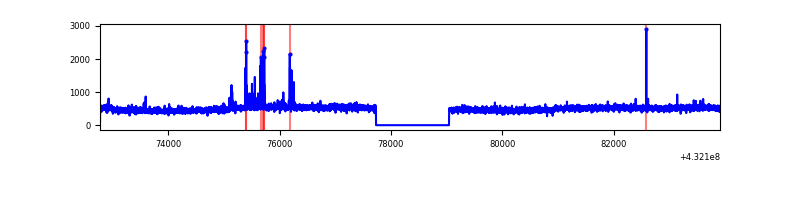 |
| D | 11138 | 9826 | 600 | 600 | 5.39% | 6.11% | 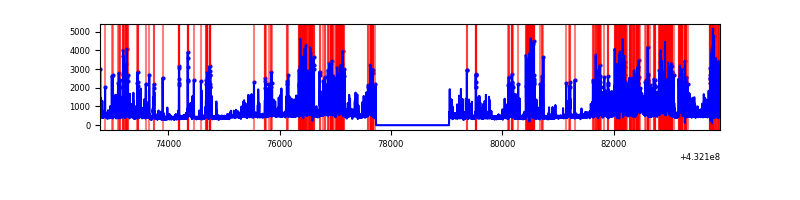 |
Top three noisy pixels from each quadrant. If the there are fewer than three noisy pixels in the level2.evt file, extra rows are filled as -1
| Pixel properties | Quadrant properties | ||||||
|---|---|---|---|---|---|---|---|
| Quadrant | DetID | PixID | Counts | Sigma | Mean | Median | Sigma |
| A | 10 | 83 | 913539 | 3665.35 | 1164 | 1145 | 248.9 |
| A | 15 | 237 | 76190 | 301.48 | 1164 | 1145 | 248.9 |
| A | 7 | 3 | 16242 | 60.65 | 1164 | 1145 | 248.9 |
| B | 0 | 186 | 2223537 | 9580.33 | 1144 | 1120 | 232.0 |
| B | 3 | 112 | 110041 | 469.53 | 1144 | 1120 | 232.0 |
| B | 5 | 255 | 99575 | 424.42 | 1144 | 1120 | 232.0 |
| C | 15 | 214 | 416185 | 1507.53 | 1129 | 1143 | 275.3 |
| C | 0 | 239 | 74440 | 266.23 | 1129 | 1143 | 275.3 |
| C | 14 | 254 | 8017 | 24.97 | 1129 | 1143 | 275.3 |
| D | 1 | 52 | 1503065 | 5322.95 | 1089 | 1056 | 282.2 |
| D | 13 | 249 | 978587 | 3464.26 | 1089 | 1056 | 282.2 |
| D | 12 | 6 | 491474 | 1737.98 | 1089 | 1056 | 282.2 |
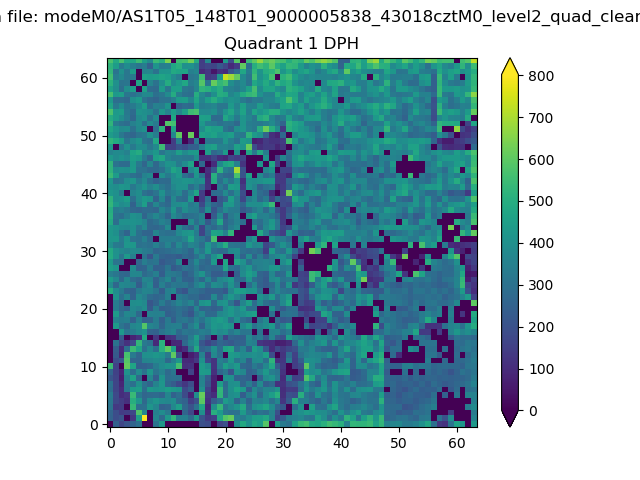
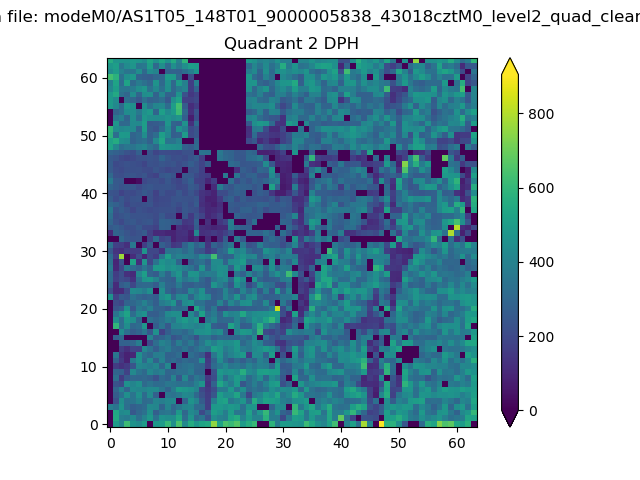
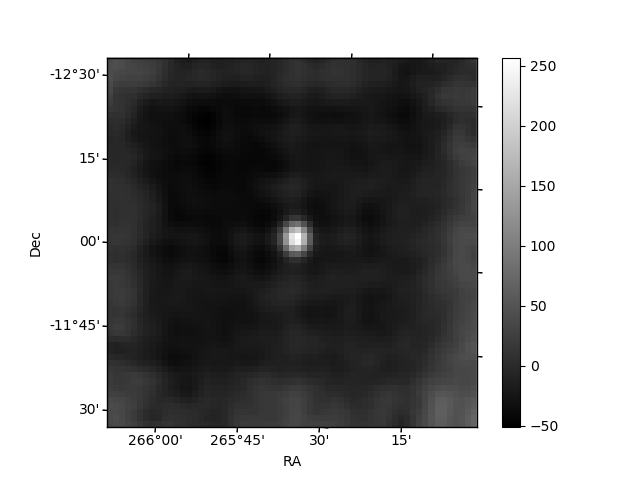
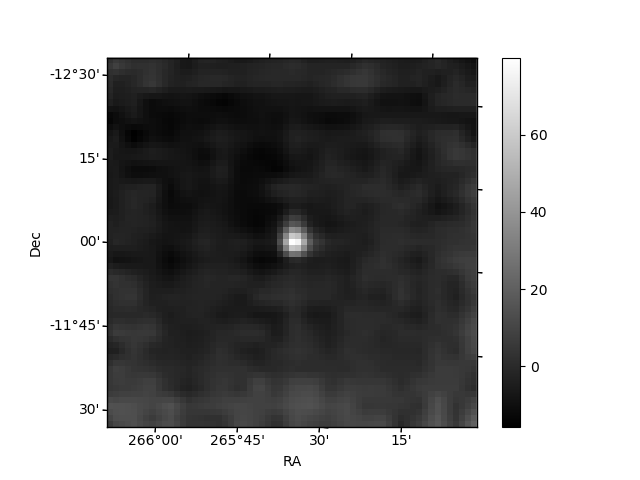
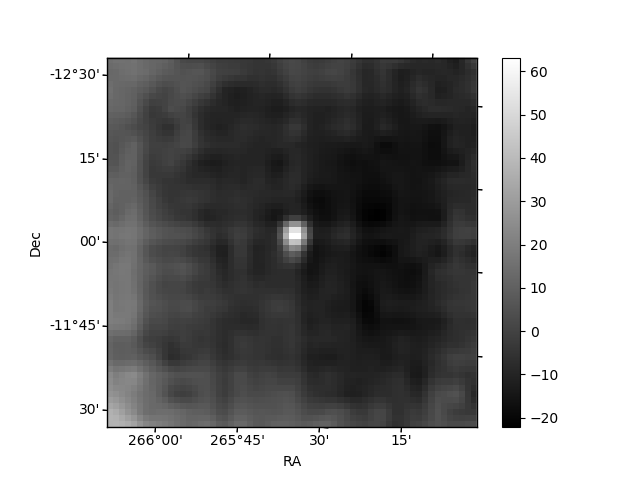
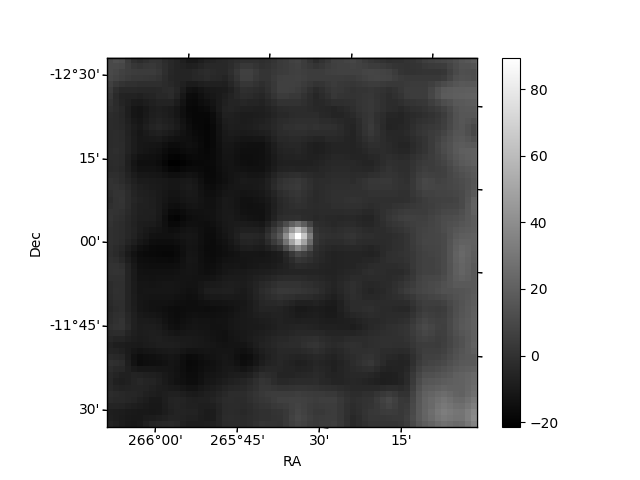
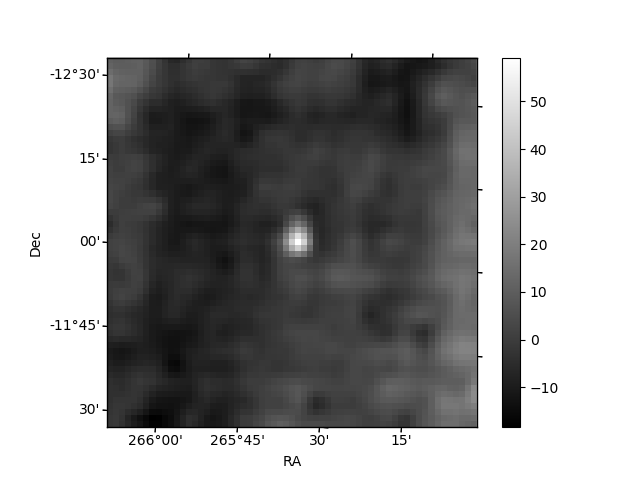
Histogram calculated using DETX and DETY for each event in the final _common_clean file
| Quadrant A | 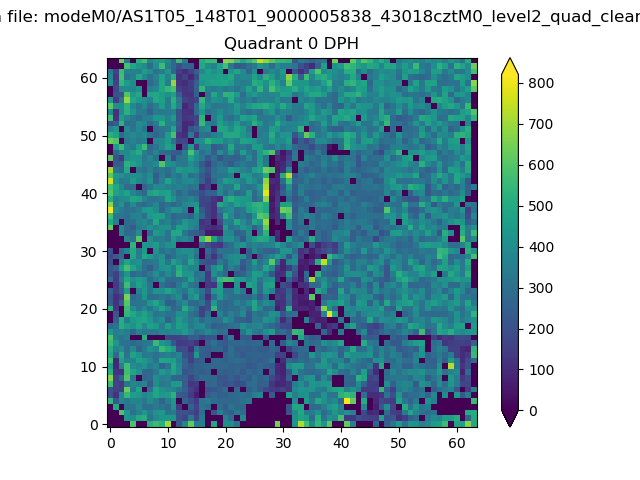 |
 |
Quadrant B |
|---|---|---|---|
| Quadrant D | 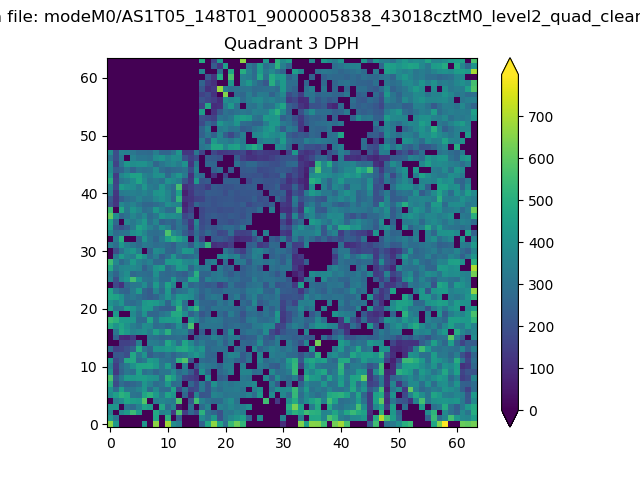 |
 |
Quadrant C |
| Plot type | Count rate plots | Images |
|---|---|---|
| Comparison with Poisson distribution Blue bars denote a histogram of data divided into 1 sec bins. Red curve is a Poisson curve with rate = median count rate of data. |
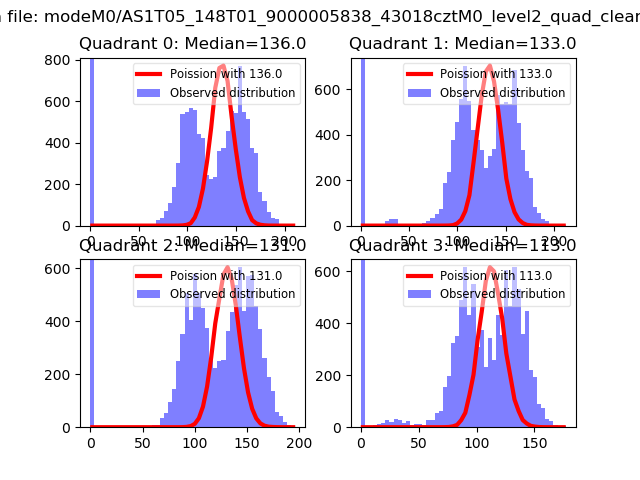 |
 |
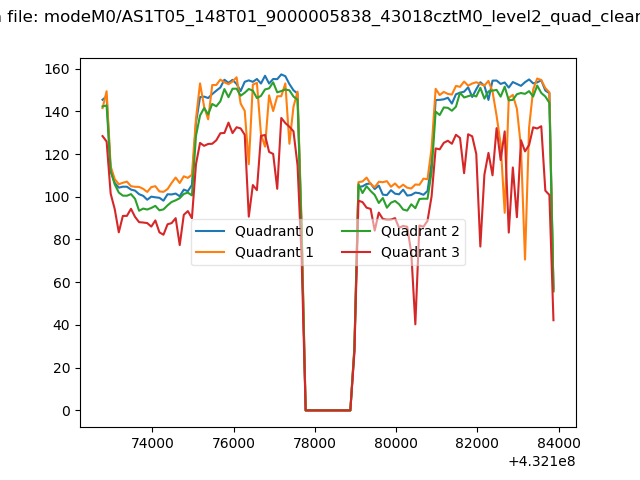
| Quadrant-wise count rates Data is divided into 100 sec bins |
 |
|
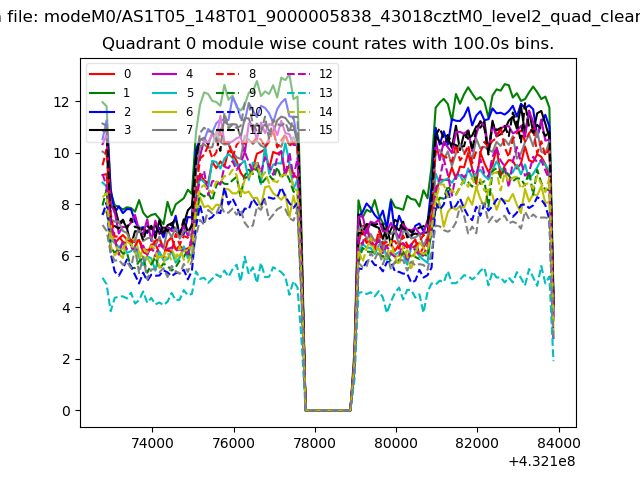
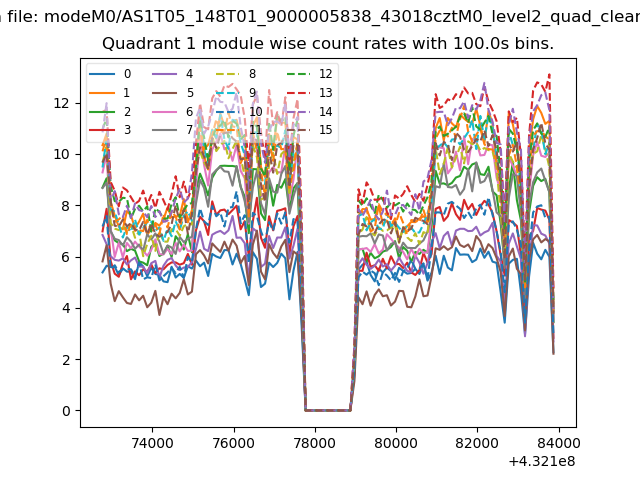
| Module-wise count rates for Quadrant A Data is divided into 100 sec bins |
 |
 |
| Module-wise count rates for Quadrant B Data is divided into 100 sec bins |
 |
 |
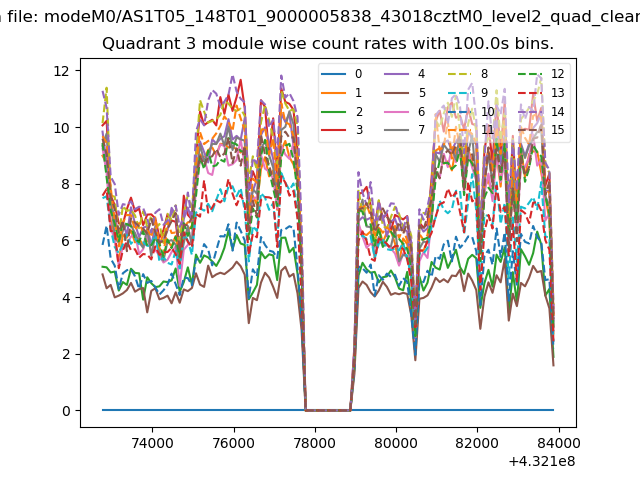
| Module-wise count rates for Quadrant C Data is divided into 100 sec bins |
 |
 |
| Module-wise count rates for Quadrant D Data is divided into 100 sec bins |
 |
 |
| Parameter | Plot |
|---|---|
| CZT HV Monitor | 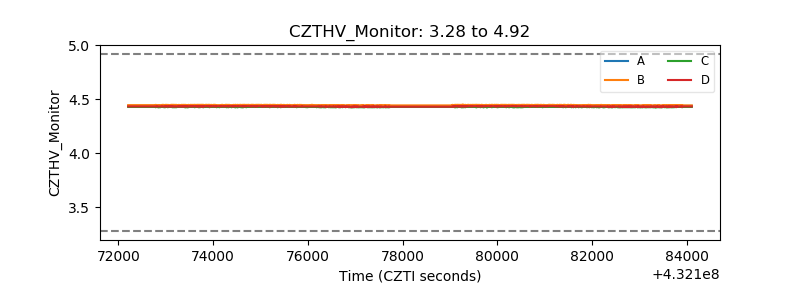 |
| D_VDD | 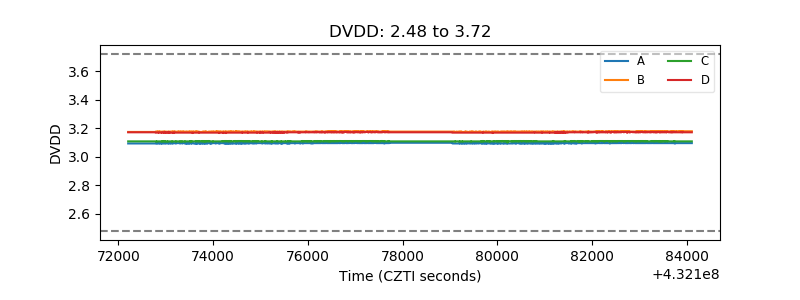 |
| Temperature 1 | 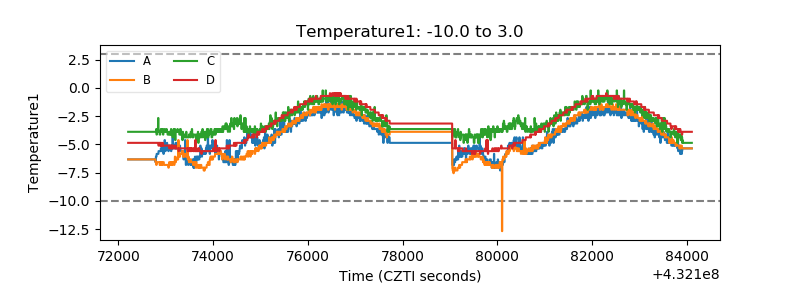 |
| Veto HV Monitor | 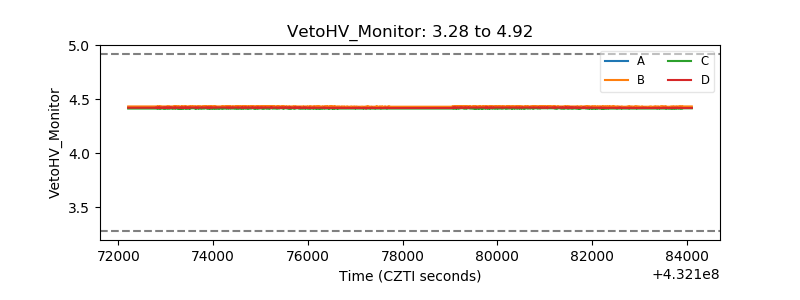 |
| Veto LLD | 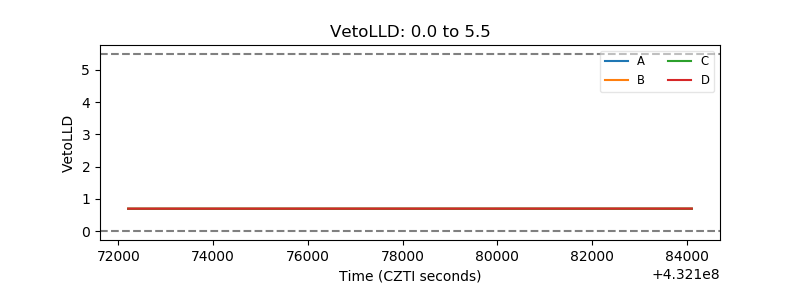 |
| Alpha Counter |  |
| _CPM_Rate |  |
| CZT Counter | 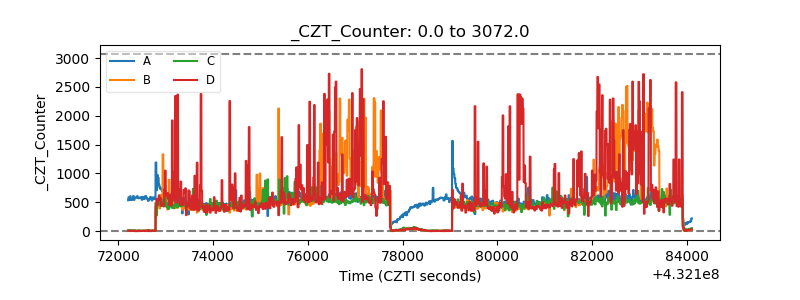 |
| +2.5 Volts monitor | 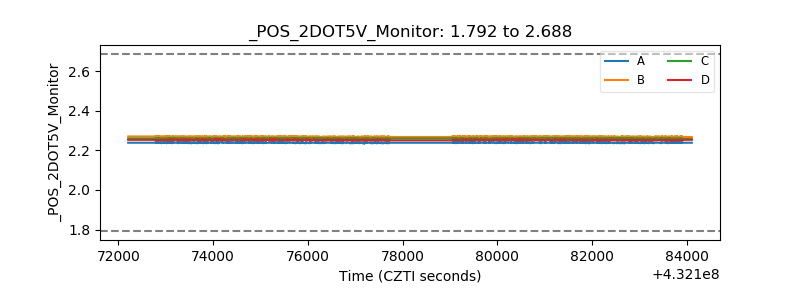 |
| +5 Volts monitor |  |
| _ROLL_ROT | 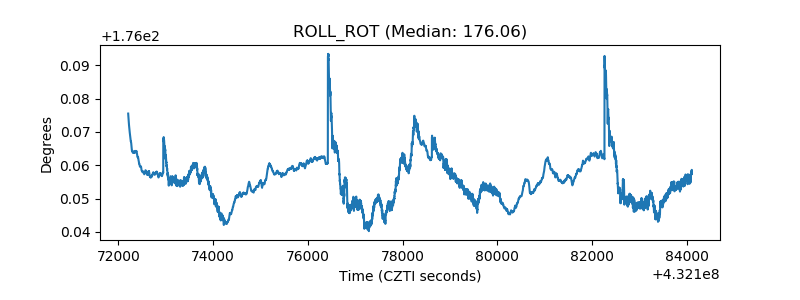 |
| _Roll_DEC | 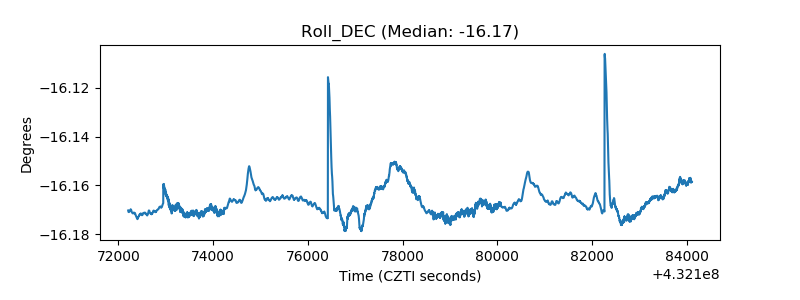 |
| _Roll_RA | 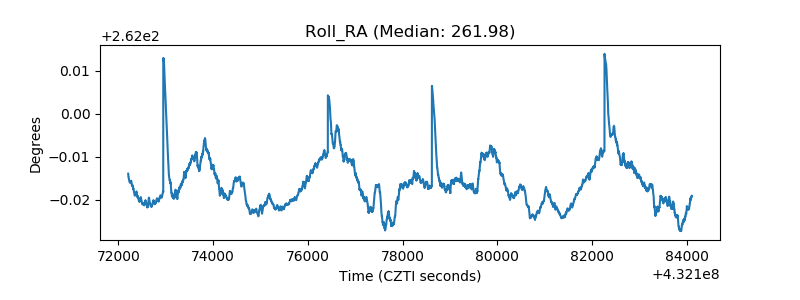 |
| Veto Counter | 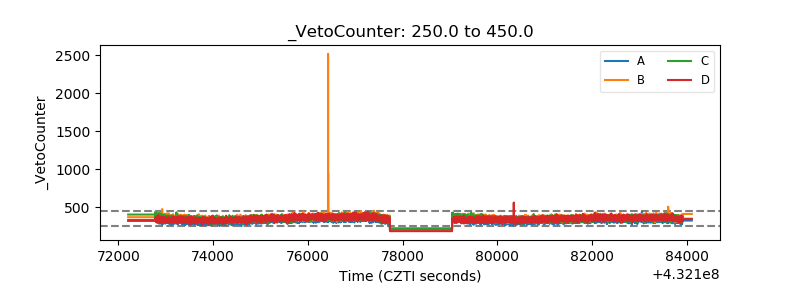 |