| Param | Original file | Final file |
|---|---|---|
| Filename | modeM0/AS1T05_148T01_9000005838_43019cztM0_level2.fits | modeM0/AS1T05_148T01_9000005838_43019cztM0_level2_quad_clean.evt |
| Size (bytes) | 485,640,000 | 122,742,720 |
| Size | 463.1 MB | 117.1 MB |
| Events in quadrant A | 3,833,100 | 875,103 |
| Events in quadrant B | 4,244,515 | 859,410 |
| Events in quadrant C | 3,254,251 | 846,453 |
| Events in quadrant D | 6,137,880 | 680,120 |
| Mode M9 | |||
|---|---|---|---|
| Quadrant | BADHDUFLAG | Total packets | Discarded packets |
| A | 0 | 29 | 0 |
| B | 0 | 29 | 0 |
| C | 0 | 29 | 0 |
| D | 0 | 29 | 0 |
| Mode SS | |||
|---|---|---|---|
| Quadrant | BADHDUFLAG | Total packets | Discarded packets |
| A | 0 | 136 | 0 |
| B | 0 | 136 | 0 |
| C | 0 | 136 | 0 |
| D | 0 | 136 | 0 |
| Mode M0 | |||
|---|---|---|---|
| Quadrant | BADHDUFLAG | Total packets | Discarded packets |
| A | 0 | 15087 | 2 |
| B | 0 | 16781 | 2 |
| C | 0 | 13205 | 2 |
| D | 0 | 22628 | 2 |
| Quadrant | Total seconds | Saturated seconds | Saturation percentage |
|---|---|---|---|
| A | 6528 | 36 | 0.551471% |
| B | 6528 | 291 | 4.457721% |
| C | 6529 | 3 | 0.045949% |
| D | 6529 | 854 | 13.080104% |
Noise dominated data is calculated using 1-second bins in cleaned event files. If a bin has >2000 counts, and if more than 50% of those come from <1% of pixels, then it is considered to be noise-dominated and hence unusable.
| Quadrant | # 1 sec bins | Bins with >0 counts | Bins with >2000 counts | High rate bins dominated by noise | Noise dominated (total time) | Noise dominated (detector-on time) | Marked lightcurve |
|---|---|---|---|---|---|---|---|
| A | 9452 | 6530 | 19 | 19 | 0.20% | 0.29% |  |
| B | 9452 | 6530 | 201 | 201 | 2.13% | 3.08% | 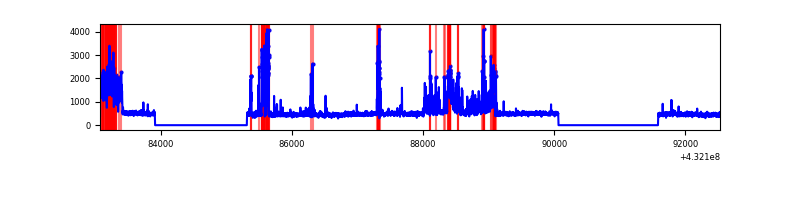 |
| C | 9453 | 6531 | 0 | 0 | 0.00% | 0.00% | 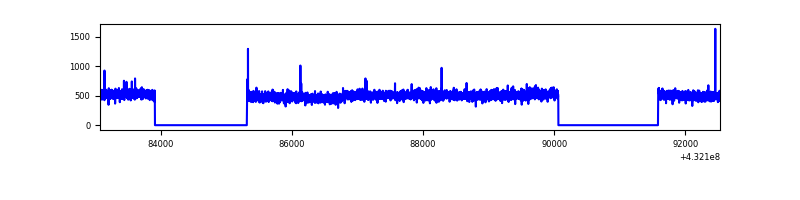 |
| D | 9453 | 6530 | 631 | 631 | 6.68% | 9.66% | 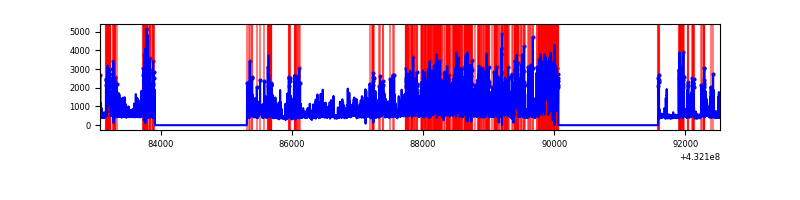 |
Top three noisy pixels from each quadrant. If the there are fewer than three noisy pixels in the level2.evt file, extra rows are filled as -1
| Pixel properties | Quadrant properties | ||||||
|---|---|---|---|---|---|---|---|
| Quadrant | DetID | PixID | Counts | Sigma | Mean | Median | Sigma |
| A | 10 | 83 | 679518 | 4031.4 | 779 | 767 | 168.4 |
| A | 15 | 237 | 121027 | 714.28 | 779 | 767 | 168.4 |
| A | 13 | 248 | 11557 | 64.09 | 779 | 767 | 168.4 |
| B | 0 | 186 | 868905 | 5570.28 | 767 | 750 | 155.9 |
| B | 3 | 112 | 308510 | 1974.66 | 767 | 750 | 155.9 |
| B | 15 | 85 | 35486 | 222.87 | 767 | 750 | 155.9 |
| C | 15 | 214 | 284787 | 1507.33 | 760 | 771 | 188.4 |
| C | 13 | 61 | 5094 | 22.94 | 760 | 771 | 188.4 |
| C | 15 | 111 | 4698 | 20.84 | 760 | 771 | 188.4 |
| D | 1 | 52 | 2343513 | 12820.4 | 708 | 688 | 182.7 |
| D | 13 | 249 | 906279 | 4955.57 | 708 | 688 | 182.7 |
| D | 12 | 6 | 91706 | 498.07 | 708 | 688 | 182.7 |
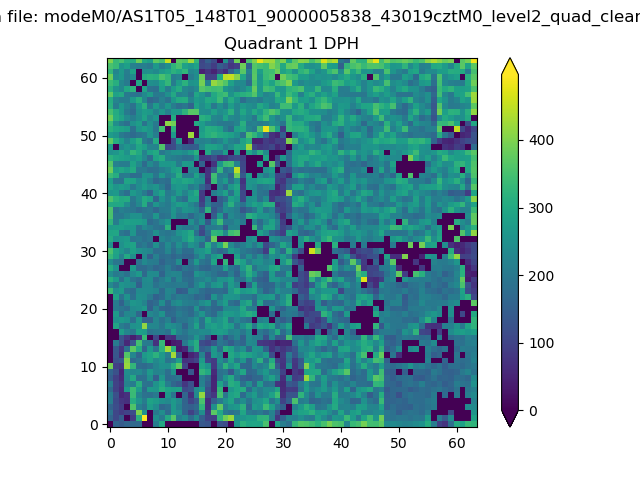
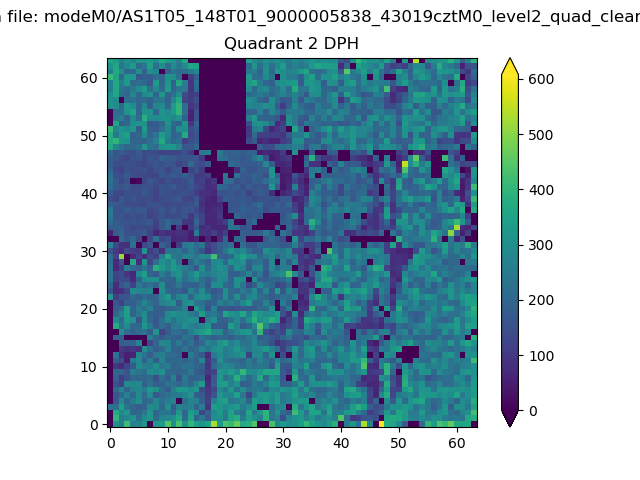
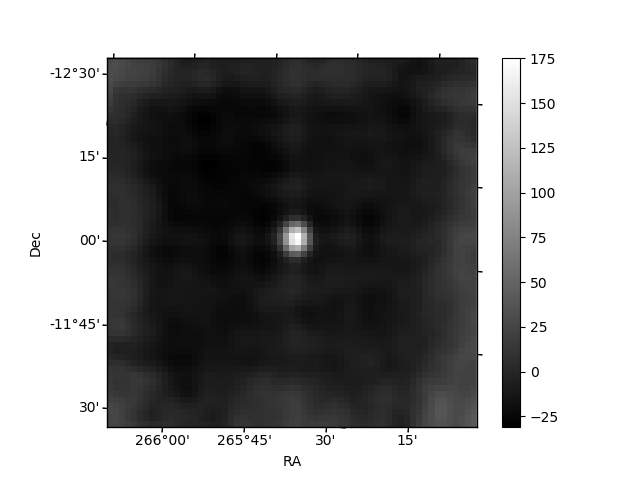
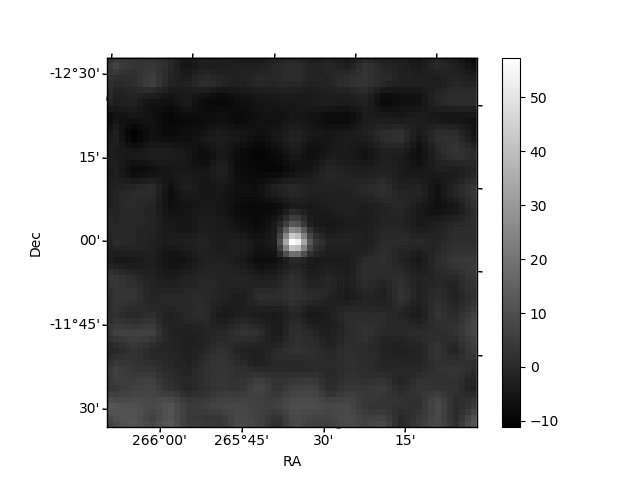
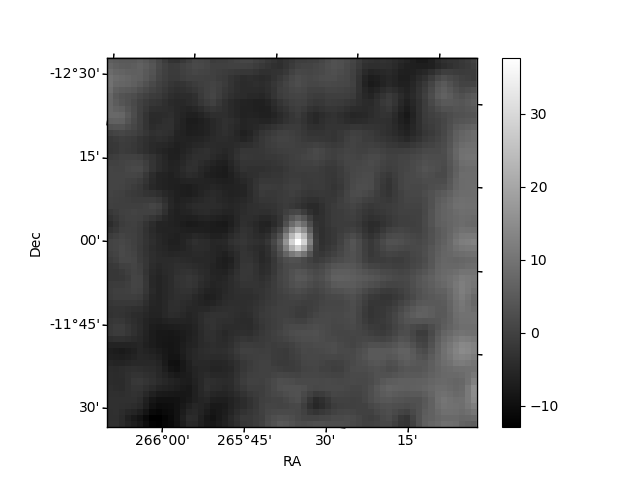
Histogram calculated using DETX and DETY for each event in the final _common_clean file
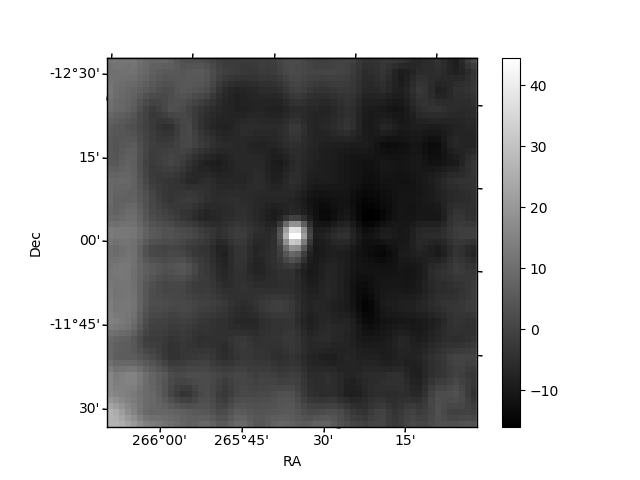
| Quadrant A | 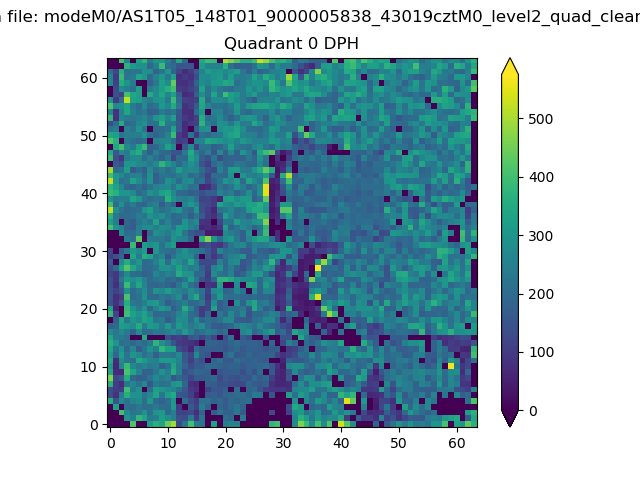 |
 |
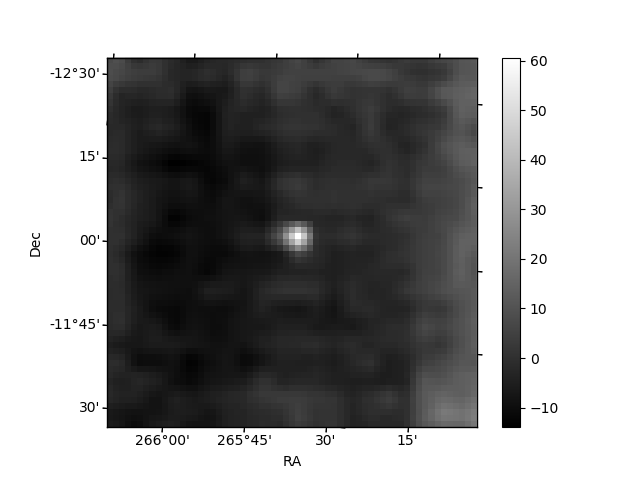
Quadrant B |
|---|---|---|---|
| Quadrant D | 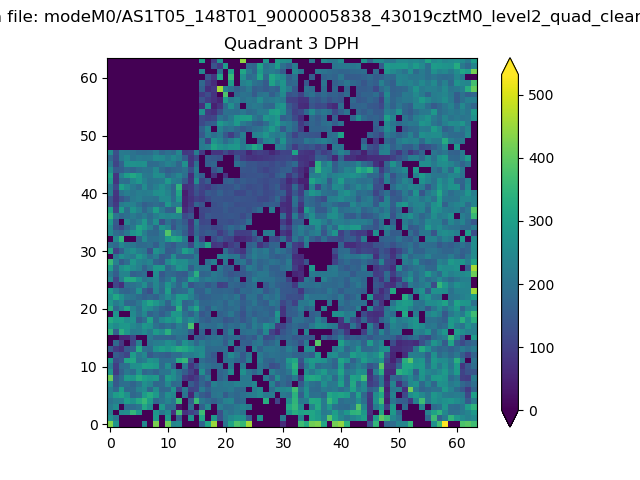 |
 |
Quadrant C |
| Plot type | Count rate plots | Images |
|---|---|---|
| Comparison with Poisson distribution Blue bars denote a histogram of data divided into 1 sec bins. Red curve is a Poisson curve with rate = median count rate of data. |
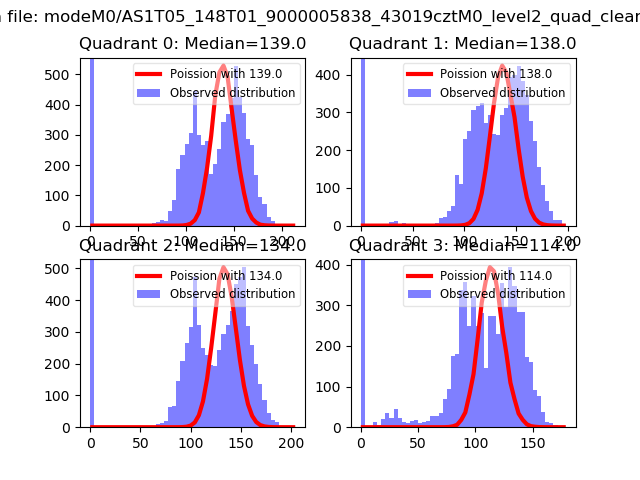 |
 |
| Quadrant-wise count rates Data is divided into 100 sec bins |
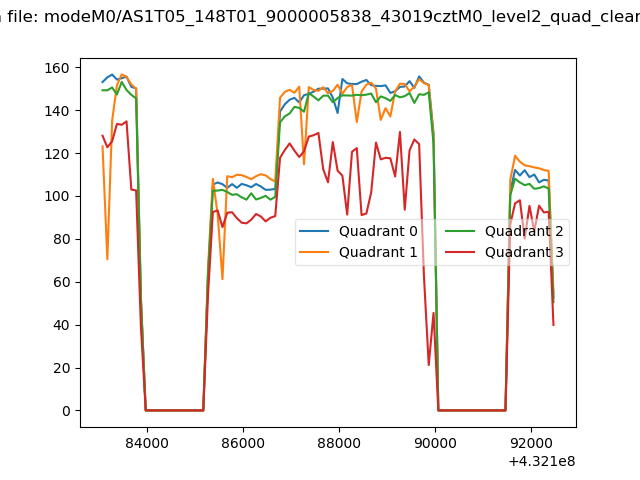 |
|
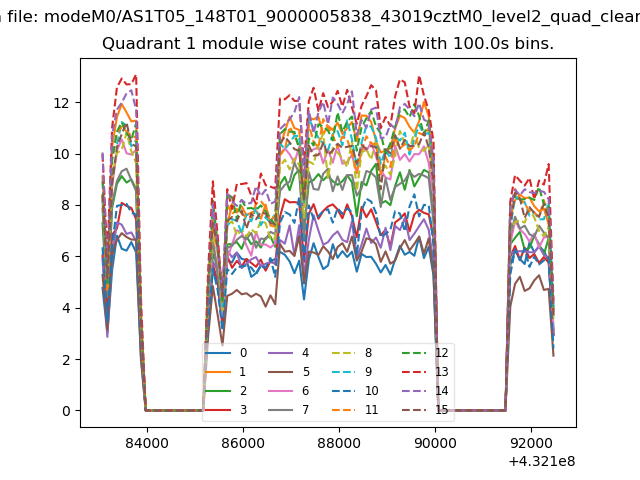
| Module-wise count rates for Quadrant A Data is divided into 100 sec bins |
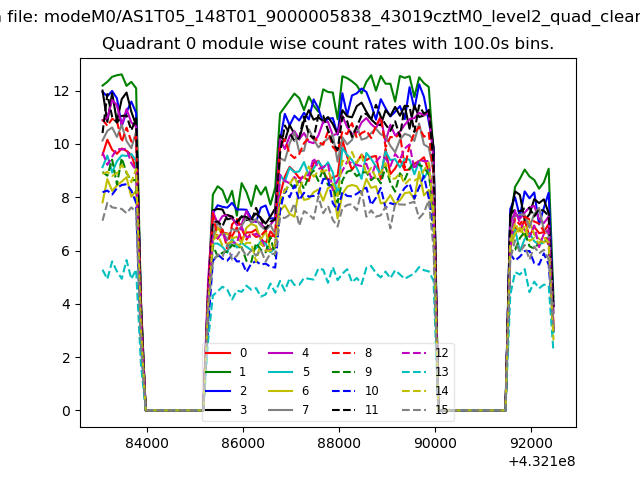 |
 |
| Module-wise count rates for Quadrant B Data is divided into 100 sec bins |
 |
 |
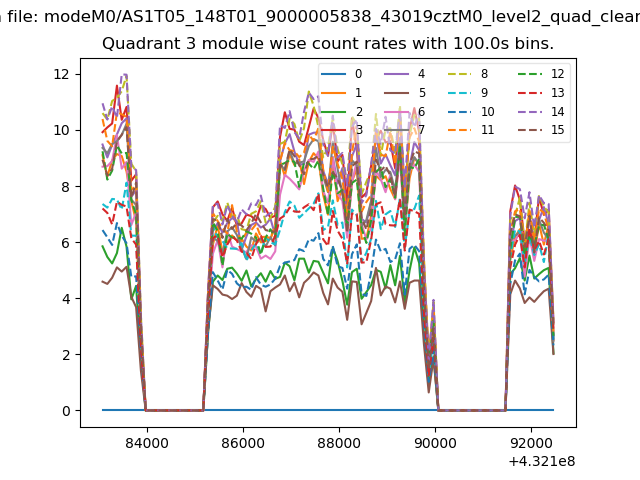
| Module-wise count rates for Quadrant C Data is divided into 100 sec bins |
 |
 |
| Module-wise count rates for Quadrant D Data is divided into 100 sec bins |
 |
 |
| Parameter | Plot |
|---|---|
| CZT HV Monitor | 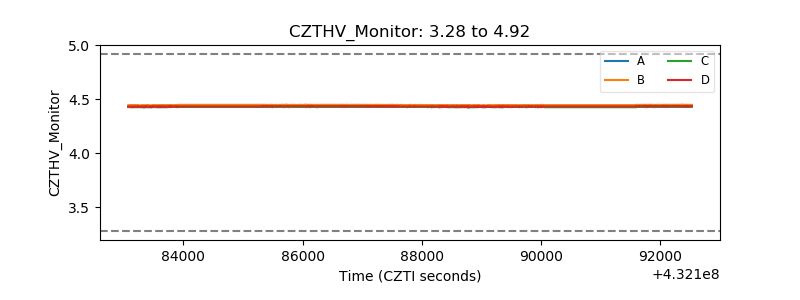 |
| D_VDD | 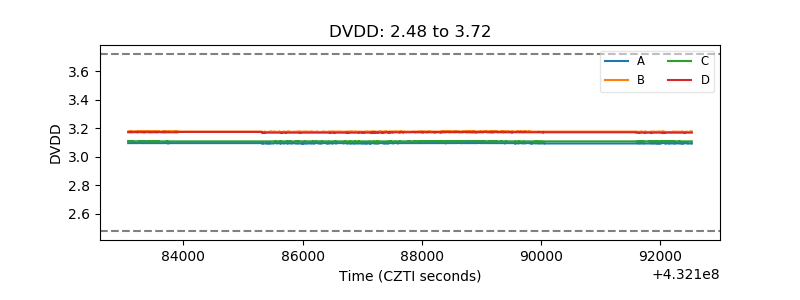 |
| Temperature 1 | 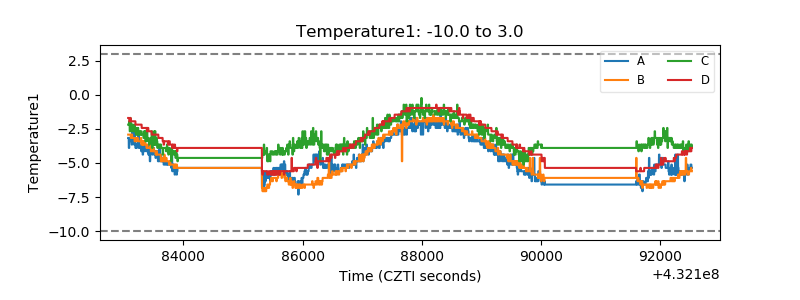 |
| Veto HV Monitor | 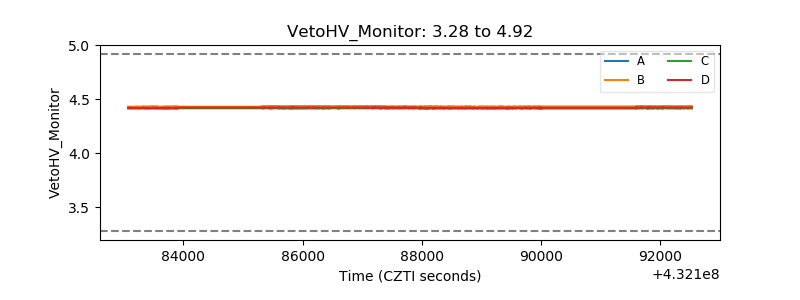 |
| Veto LLD | 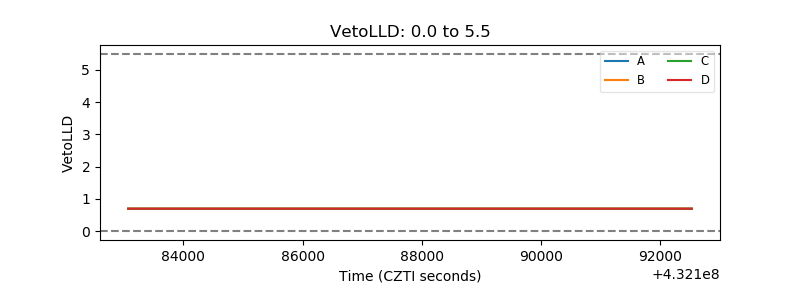 |
| Alpha Counter |  |
| _CPM_Rate |  |
| CZT Counter | 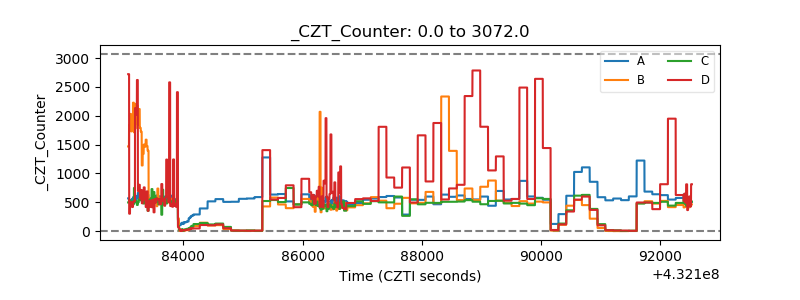 |
| +2.5 Volts monitor |  |
| +5 Volts monitor |  |
| _ROLL_ROT | 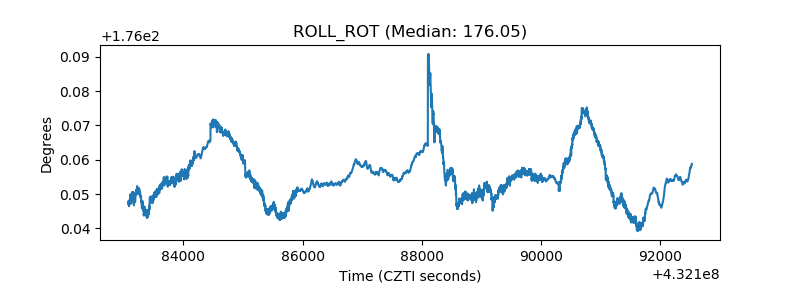 |
| _Roll_DEC | 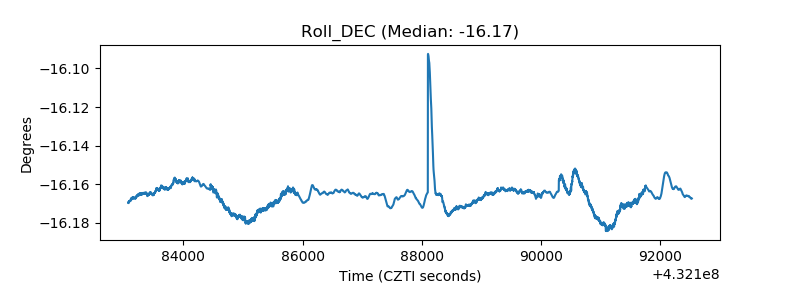 |
| _Roll_RA | 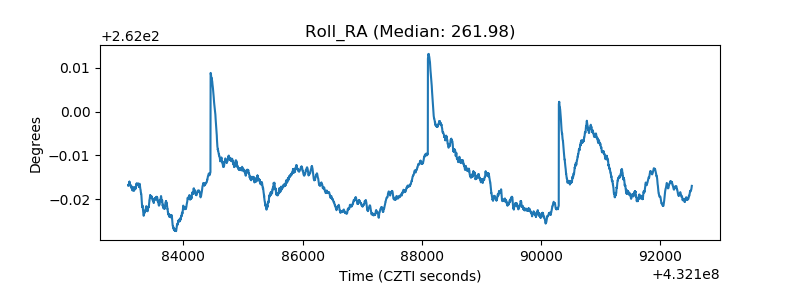 |
| Veto Counter | 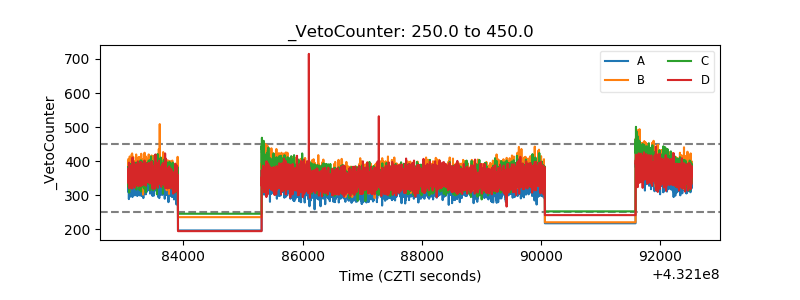 |