| Param | Original file | Final file |
|---|---|---|
| Filename | modeM0/AS1T05_148T01_9000005838_43020cztM0_level2.fits | modeM0/AS1T05_148T01_9000005838_43020cztM0_level2_quad_clean.evt |
| Size (bytes) | 463,749,120 | 111,127,680 |
| Size | 442.3 MB | 106.0 MB |
| Events in quadrant A | 3,509,285 | 805,451 |
| Events in quadrant B | 4,166,743 | 783,772 |
| Events in quadrant C | 2,968,364 | 779,131 |
| Events in quadrant D | 6,067,378 | 587,729 |
| Mode M9 | |||
|---|---|---|---|
| Quadrant | BADHDUFLAG | Total packets | Discarded packets |
| A | 0 | 32 | 0 |
| B | 0 | 32 | 0 |
| C | 0 | 32 | 0 |
| D | 0 | 32 | 0 |
| Mode SS | |||
|---|---|---|---|
| Quadrant | BADHDUFLAG | Total packets | Discarded packets |
| A | 0 | 122 | 0 |
| B | 0 | 122 | 0 |
| C | 0 | 122 | 0 |
| D | 0 | 122 | 0 |
| Mode M0 | |||
|---|---|---|---|
| Quadrant | BADHDUFLAG | Total packets | Discarded packets |
| A | 0 | 13811 | 2 |
| B | 0 | 16087 | 2 |
| C | 0 | 11908 | 2 |
| D | 0 | 21885 | 2 |
| Quadrant | Total seconds | Saturated seconds | Saturation percentage |
|---|---|---|---|
| A | 5849 | 29 | 0.495811% |
| B | 5849 | 367 | 6.274577% |
| C | 5849 | 6 | 0.102582% |
| D | 5849 | 1090 | 18.635664% |
Noise dominated data is calculated using 1-second bins in cleaned event files. If a bin has >2000 counts, and if more than 50% of those come from <1% of pixels, then it is considered to be noise-dominated and hence unusable.
| Quadrant | # 1 sec bins | Bins with >0 counts | Bins with >2000 counts | High rate bins dominated by noise | Noise dominated (total time) | Noise dominated (detector-on time) | Marked lightcurve |
|---|---|---|---|---|---|---|---|
| A | 9043 | 5851 | 12 | 12 | 0.13% | 0.21% | 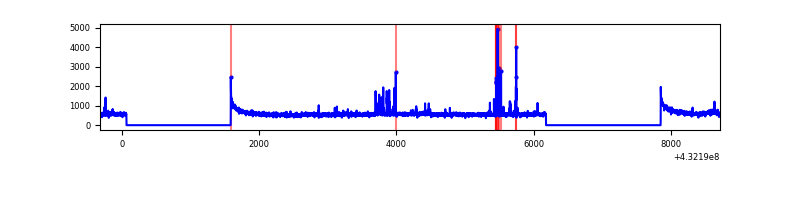 |
| B | 9043 | 5851 | 262 | 262 | 2.90% | 4.48% | 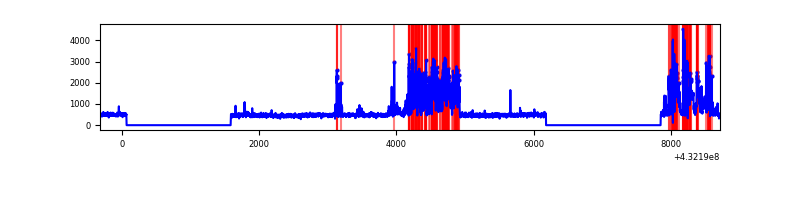 |
| C | 9043 | 5851 | 1 | 1 | 0.01% | 0.02% | 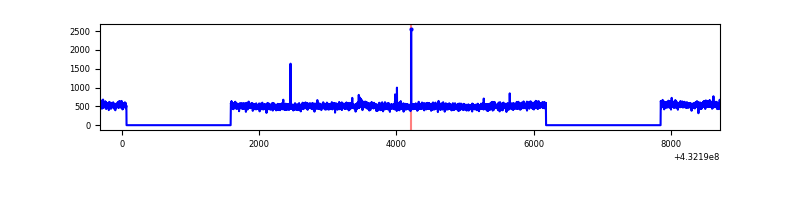 |
| D | 9043 | 5851 | 779 | 779 | 8.61% | 13.31% | 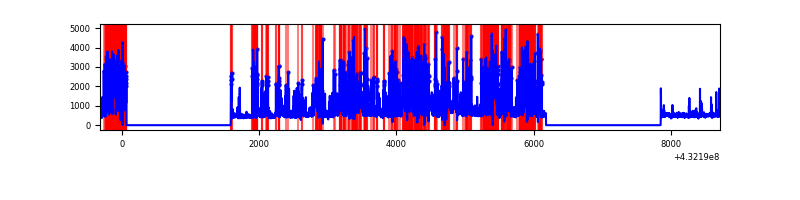 |
Top three noisy pixels from each quadrant. If the there are fewer than three noisy pixels in the level2.evt file, extra rows are filled as -1
| Pixel properties | Quadrant properties | ||||||
|---|---|---|---|---|---|---|---|
| Quadrant | DetID | PixID | Counts | Sigma | Mean | Median | Sigma |
| A | 10 | 83 | 614175 | 3977.13 | 710 | 698 | 154.3 |
| A | 15 | 237 | 81636 | 524.71 | 710 | 698 | 154.3 |
| A | 13 | 248 | 58694 | 375.98 | 710 | 698 | 154.3 |
| B | 0 | 186 | 817199 | 5706.8 | 689 | 674 | 143.1 |
| B | 3 | 112 | 626319 | 4372.72 | 689 | 674 | 143.1 |
| B | 15 | 85 | 18185 | 122.39 | 689 | 674 | 143.1 |
| C | 15 | 214 | 255100 | 1479.56 | 691 | 697 | 171.9 |
| C | 7 | 220 | 12567 | 69.03 | 691 | 697 | 171.9 |
| C | 4 | 0 | 8066 | 42.86 | 691 | 697 | 171.9 |
| D | 1 | 52 | 2354009 | 14730.58 | 621 | 603 | 159.8 |
| D | 13 | 249 | 1133835 | 7093.19 | 621 | 603 | 159.8 |
| D | 12 | 233 | 51227 | 316.87 | 621 | 603 | 159.8 |
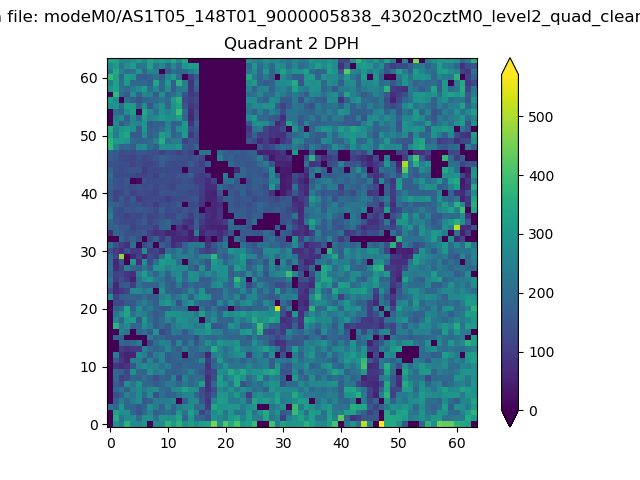
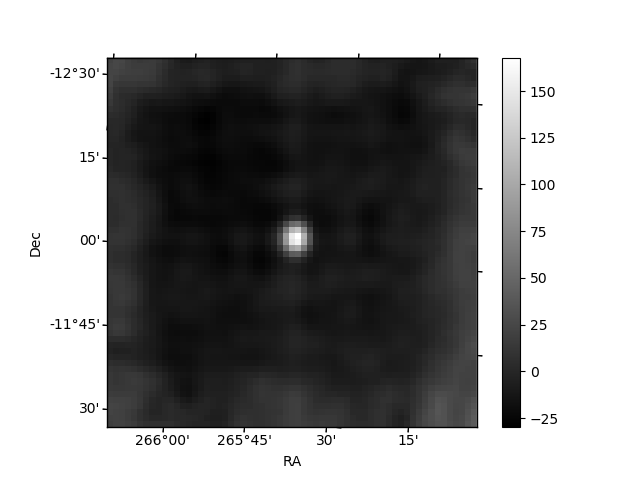
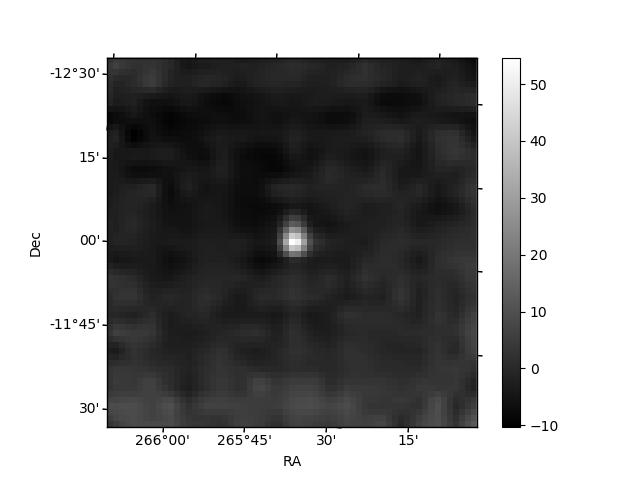
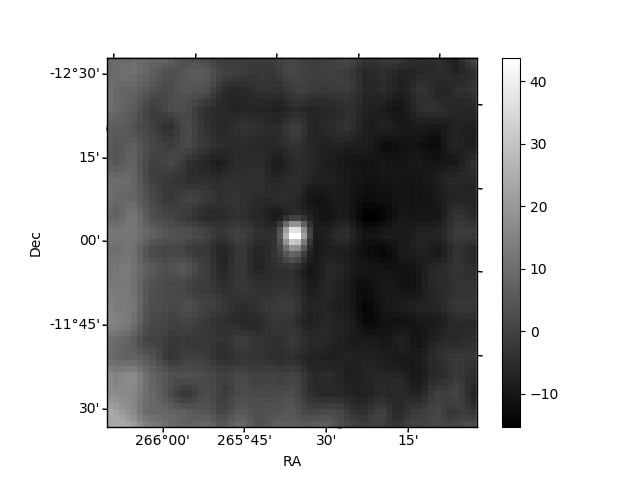
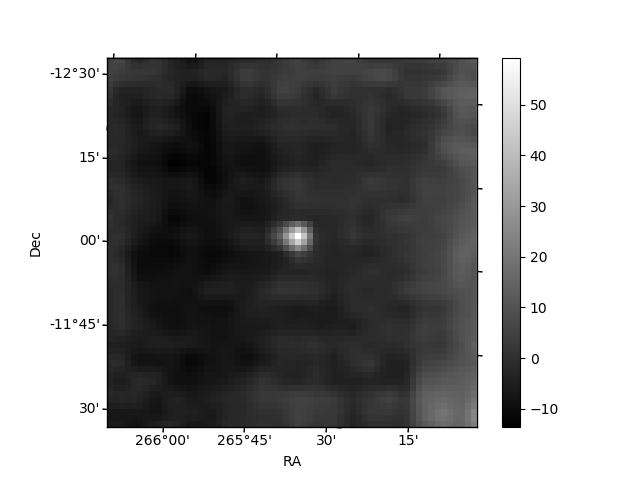
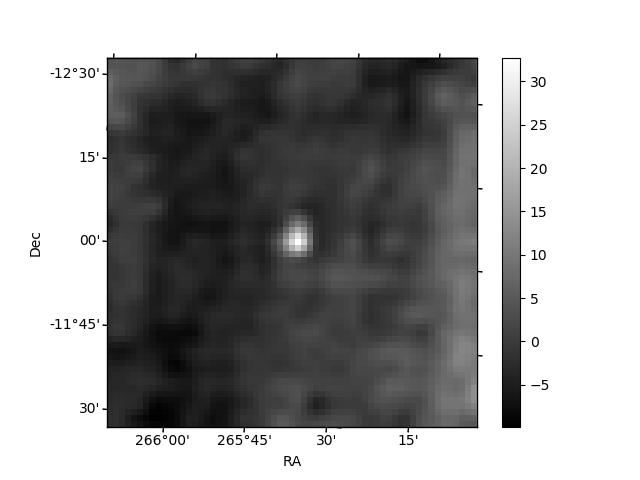
Histogram calculated using DETX and DETY for each event in the final _common_clean file
| Quadrant A | 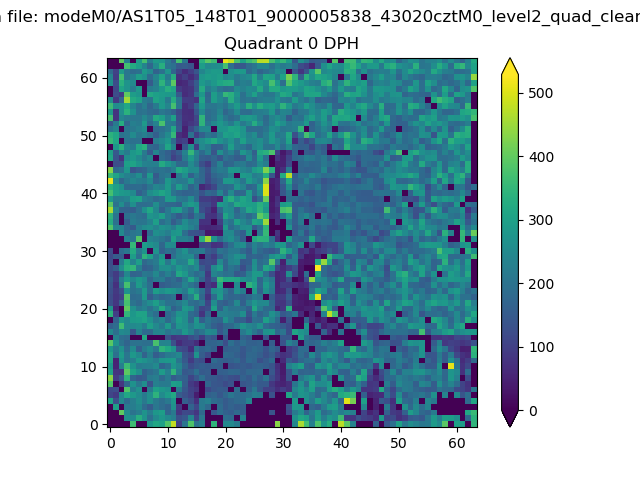 |
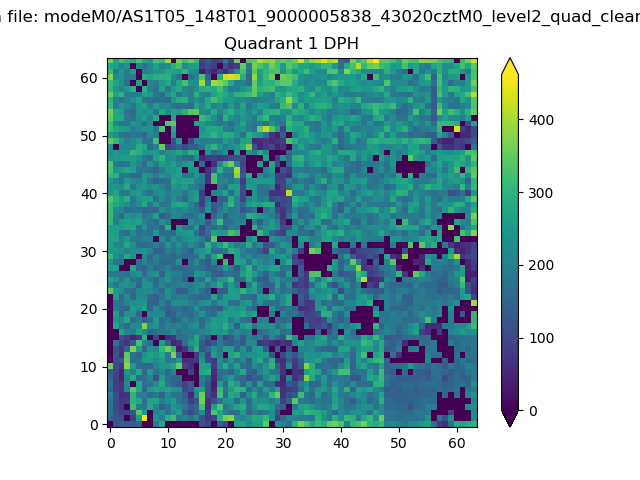 |
Quadrant B |
|---|---|---|---|
| Quadrant D | 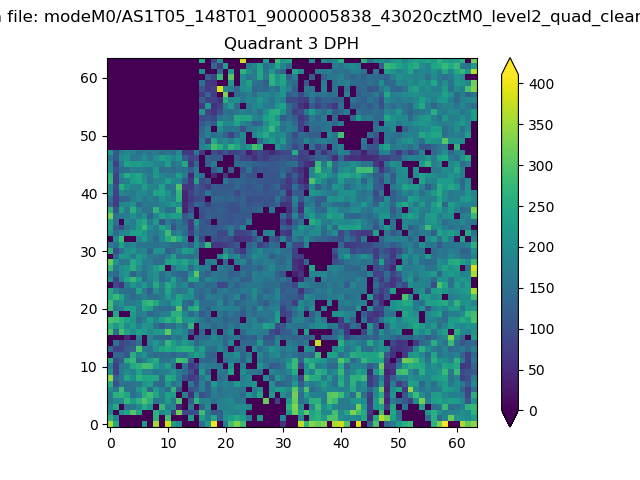 |
 |
Quadrant C |
| Plot type | Count rate plots | Images |
|---|---|---|
| Comparison with Poisson distribution Blue bars denote a histogram of data divided into 1 sec bins. Red curve is a Poisson curve with rate = median count rate of data. |
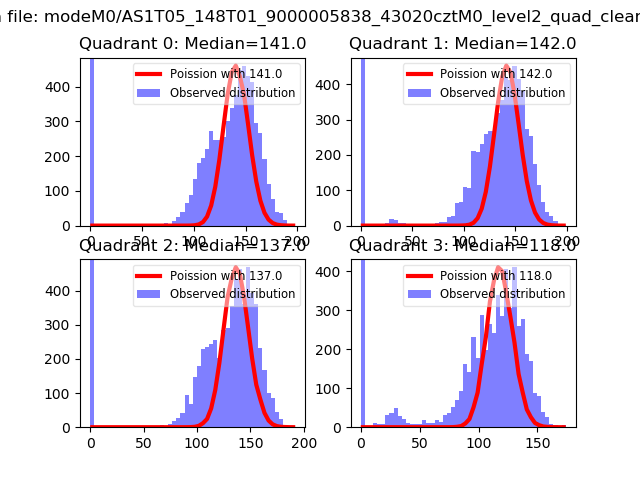 |
 |
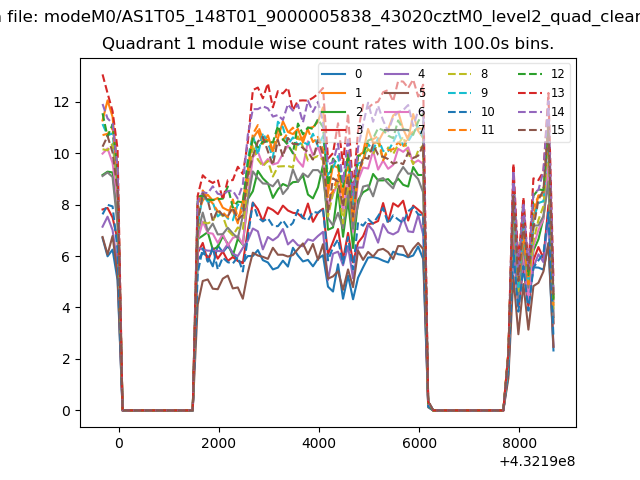
| Quadrant-wise count rates Data is divided into 100 sec bins |
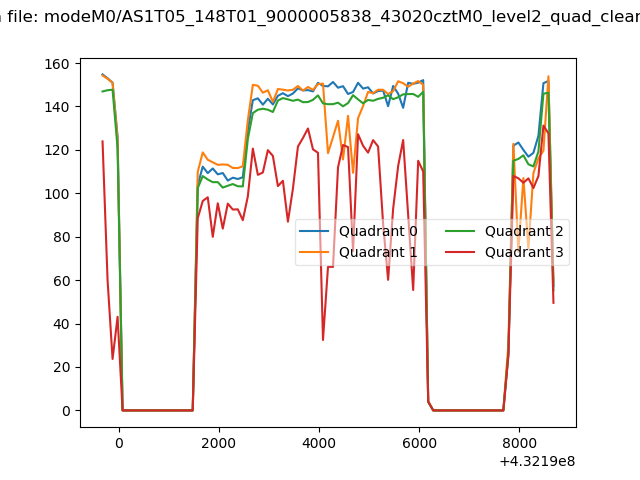 |
|
| Module-wise count rates for Quadrant A Data is divided into 100 sec bins |
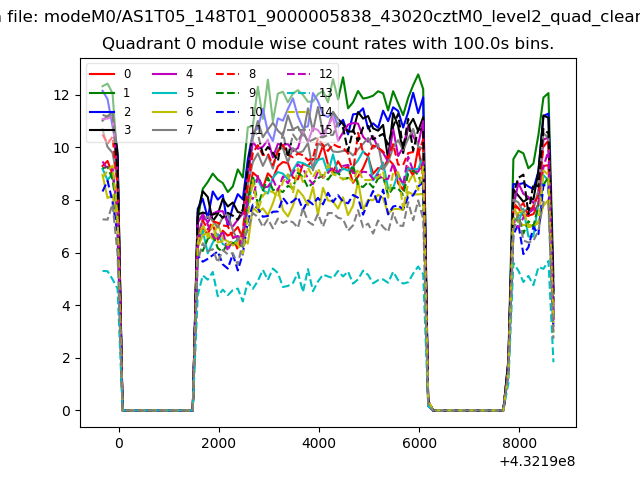 |
 |
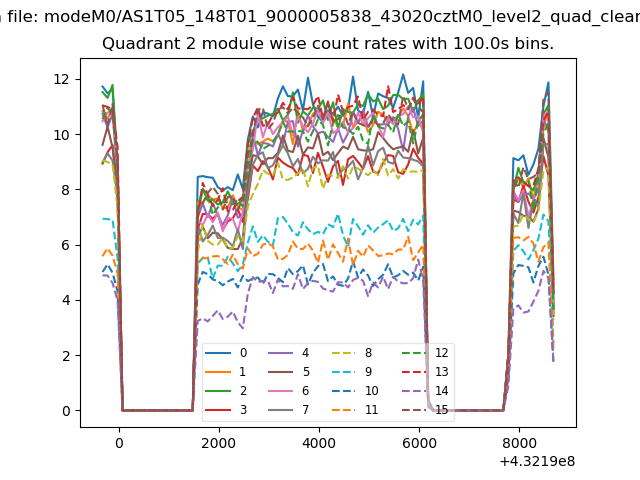
| Module-wise count rates for Quadrant B Data is divided into 100 sec bins |
 |
 |
| Module-wise count rates for Quadrant C Data is divided into 100 sec bins |
 |
 |
| Module-wise count rates for Quadrant D Data is divided into 100 sec bins |
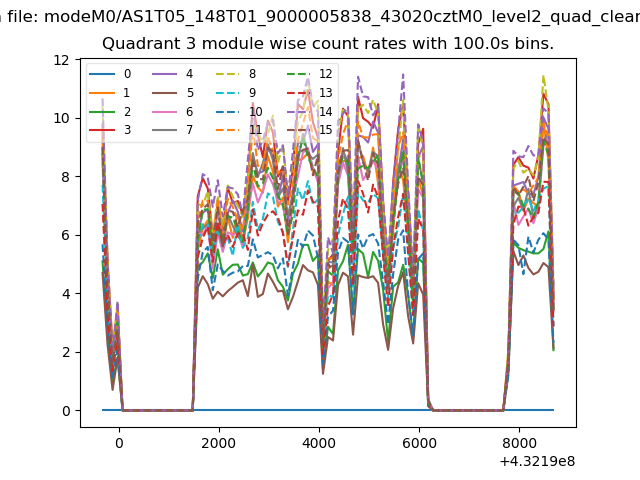 |
 |
| Parameter | Plot |
|---|---|
| CZT HV Monitor | 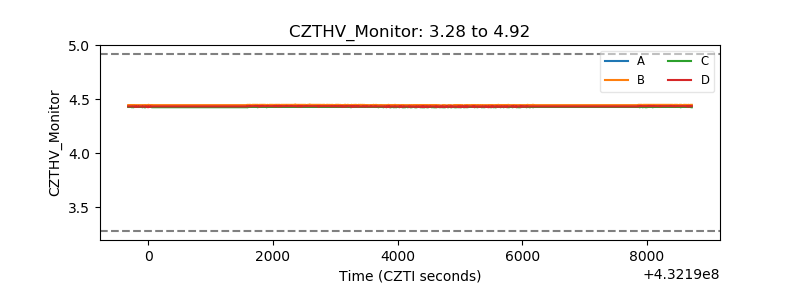 |
| D_VDD | 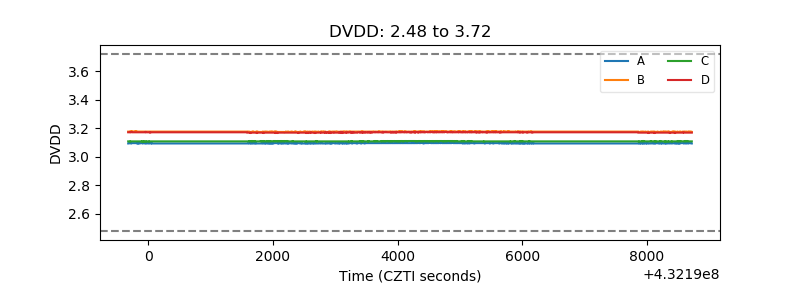 |
| Temperature 1 | 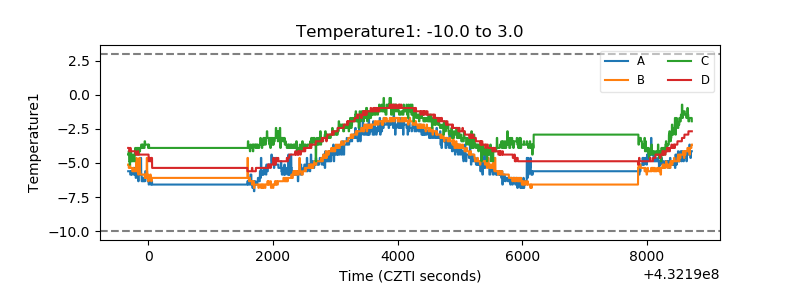 |
| Veto HV Monitor | 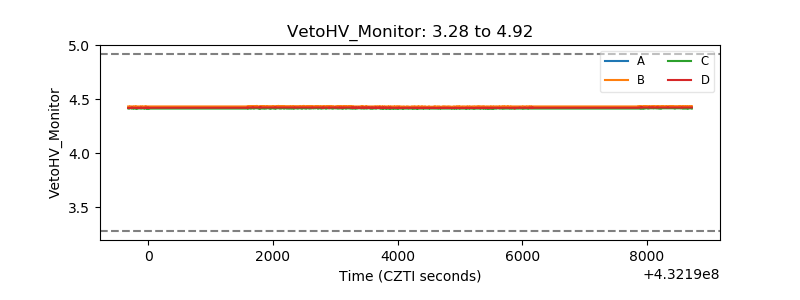 |
| Veto LLD | 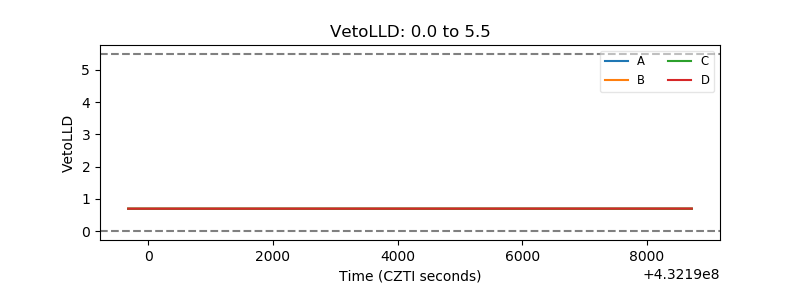 |
| Alpha Counter | 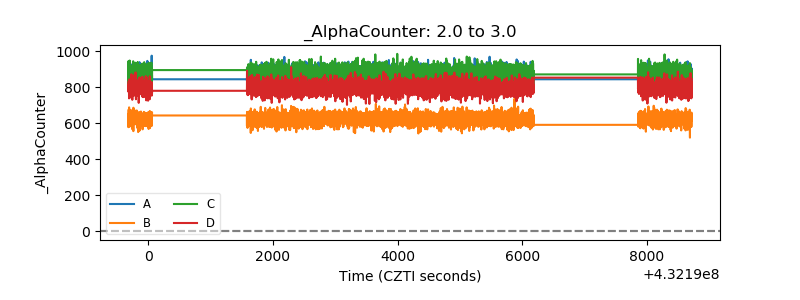 |
| _CPM_Rate | 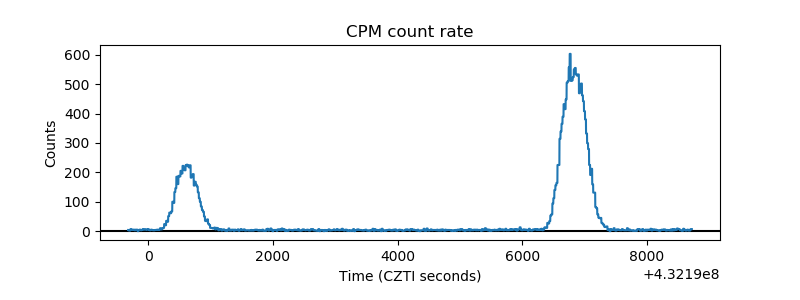 |
| CZT Counter | 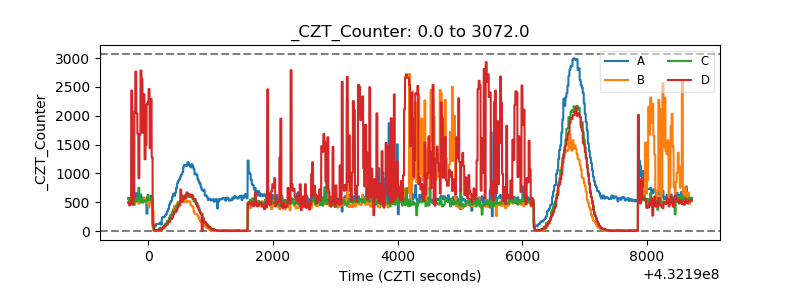 |
| +2.5 Volts monitor | 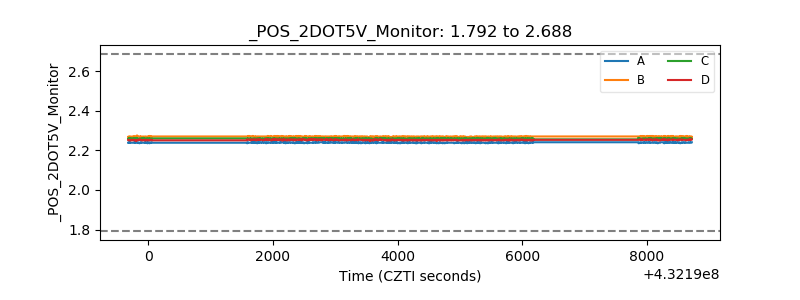 |
| +5 Volts monitor | 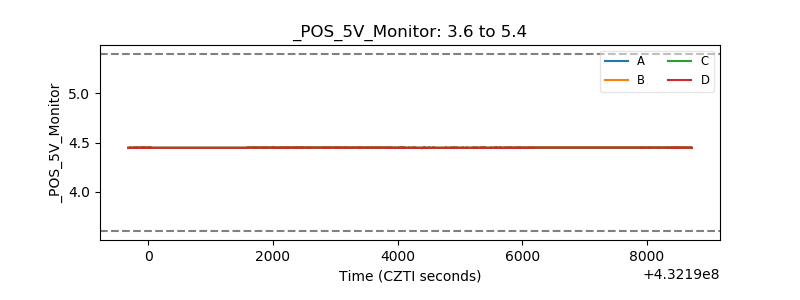 |
| _ROLL_ROT | 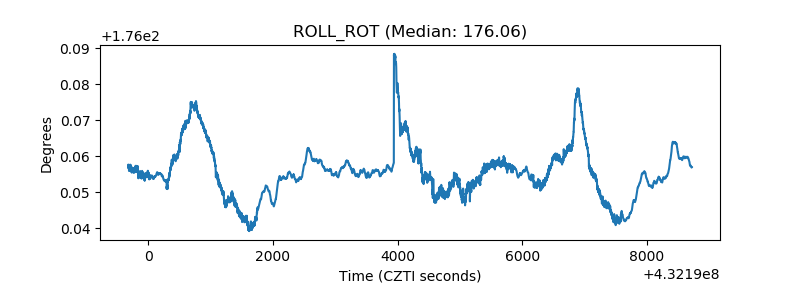 |
| _Roll_DEC | 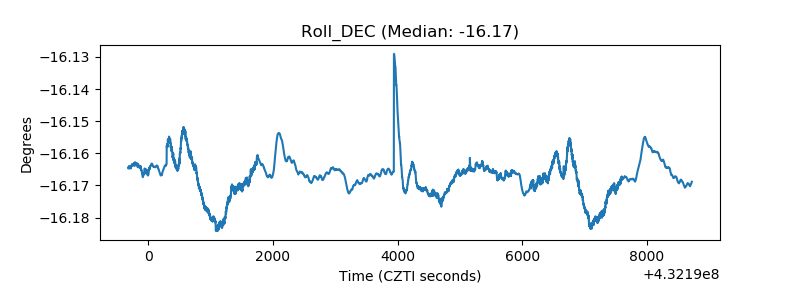 |
| _Roll_RA | 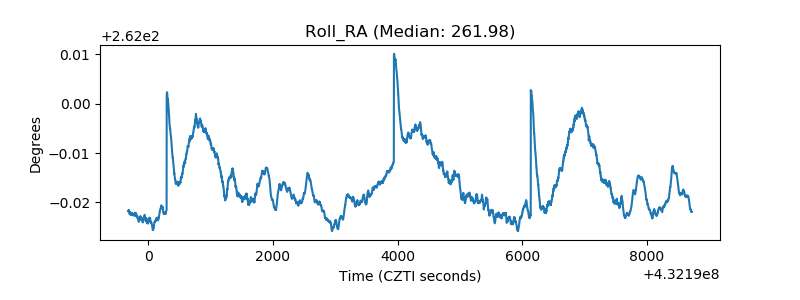 |
| Veto Counter | 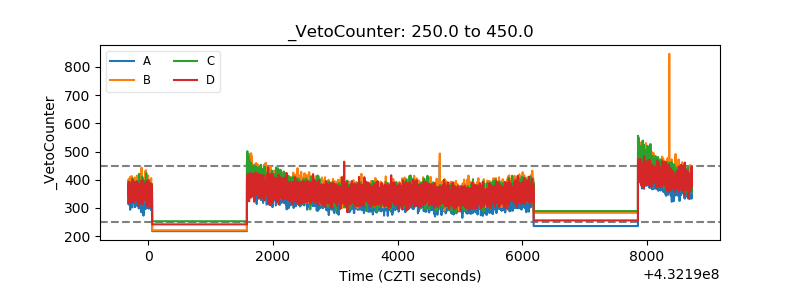 |