| Param | Original file | Final file |
|---|---|---|
| Filename | modeM0/AS1T05_148T01_9000005838_43022cztM0_level2.fits | modeM0/AS1T05_148T01_9000005838_43022cztM0_level2_quad_clean.evt |
| Size (bytes) | 419,512,320 | 107,398,080 |
| Size | 400.1 MB | 102.4 MB |
| Events in quadrant A | 3,270,084 | 779,154 |
| Events in quadrant B | 3,271,732 | 771,280 |
| Events in quadrant C | 2,756,475 | 751,212 |
| Events in quadrant D | 5,818,084 | 578,743 |
| Mode M9 | |||
|---|---|---|---|
| Quadrant | BADHDUFLAG | Total packets | Discarded packets |
| A | 0 | 33 | 0 |
| B | 0 | 34 | 0 |
| C | 0 | 34 | 0 |
| D | 0 | 34 | 0 |
| Mode SS | |||
|---|---|---|---|
| Quadrant | BADHDUFLAG | Total packets | Discarded packets |
| A | 0 | 112 | 0 |
| B | 0 | 112 | 0 |
| C | 0 | 112 | 0 |
| D | 0 | 112 | 0 |
| Mode M0 | |||
|---|---|---|---|
| Quadrant | BADHDUFLAG | Total packets | Discarded packets |
| A | 0 | 12901 | 2 |
| B | 0 | 12878 | 2 |
| C | 0 | 11077 | 2 |
| D | 0 | 20714 | 2 |
| Quadrant | Total seconds | Saturated seconds | Saturation percentage |
|---|---|---|---|
| A | 5306 | 37 | 0.697324% |
| B | 5306 | 190 | 3.580852% |
| C | 5306 | 6 | 0.113080% |
| D | 5306 | 942 | 17.753487% |
Noise dominated data is calculated using 1-second bins in cleaned event files. If a bin has >2000 counts, and if more than 50% of those come from <1% of pixels, then it is considered to be noise-dominated and hence unusable.
| Quadrant | # 1 sec bins | Bins with >0 counts | Bins with >2000 counts | High rate bins dominated by noise | Noise dominated (total time) | Noise dominated (detector-on time) | Marked lightcurve |
|---|---|---|---|---|---|---|---|
| A | 7068 | 5307 | 22 | 22 | 0.31% | 0.41% | 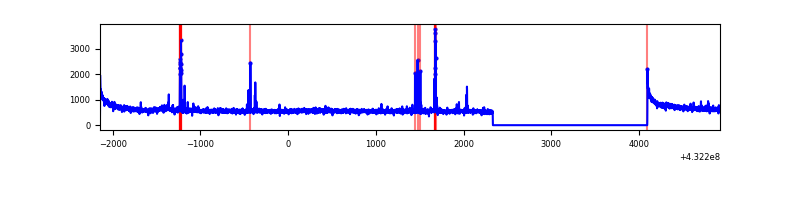 |
| B | 7068 | 5307 | 107 | 107 | 1.51% | 2.02% | 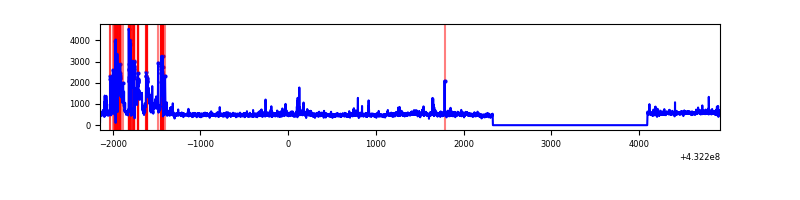 |
| C | 7068 | 5307 | 0 | 0 | 0.00% | 0.00% | 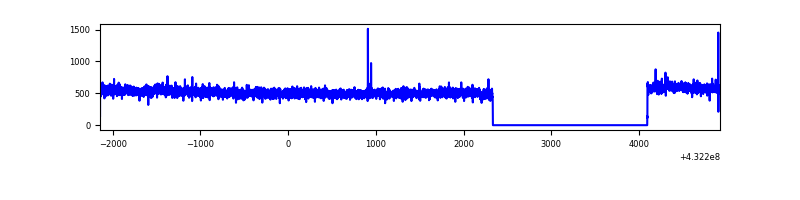 |
| D | 7068 | 5307 | 900 | 900 | 12.73% | 16.96% | 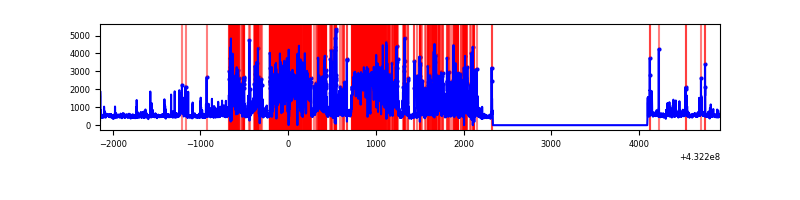 |
Top three noisy pixels from each quadrant. If the there are fewer than three noisy pixels in the level2.evt file, extra rows are filled as -1
| Pixel properties | Quadrant properties | ||||||
|---|---|---|---|---|---|---|---|
| Quadrant | DetID | PixID | Counts | Sigma | Mean | Median | Sigma |
| A | 10 | 83 | 586259 | 3986.06 | 666 | 657 | 146.9 |
| A | 15 | 237 | 82704 | 558.48 | 666 | 657 | 146.9 |
| A | 13 | 248 | 23742 | 157.13 | 666 | 657 | 146.9 |
| B | 3 | 112 | 581180 | 4299.91 | 649 | 635 | 135.0 |
| B | 0 | 189 | 63774 | 467.65 | 649 | 635 | 135.0 |
| B | 4 | 81 | 58233 | 426.61 | 649 | 635 | 135.0 |
| C | 15 | 214 | 234313 | 1448.37 | 645 | 651 | 161.3 |
| C | 15 | 111 | 6794 | 38.08 | 645 | 651 | 161.3 |
| C | 13 | 61 | 4263 | 22.39 | 645 | 651 | 161.3 |
| D | 1 | 52 | 2305352 | 14897.21 | 596 | 580 | 154.7 |
| D | 13 | 249 | 942942 | 6091.09 | 596 | 580 | 154.7 |
| D | 12 | 233 | 121668 | 782.67 | 596 | 580 | 154.7 |
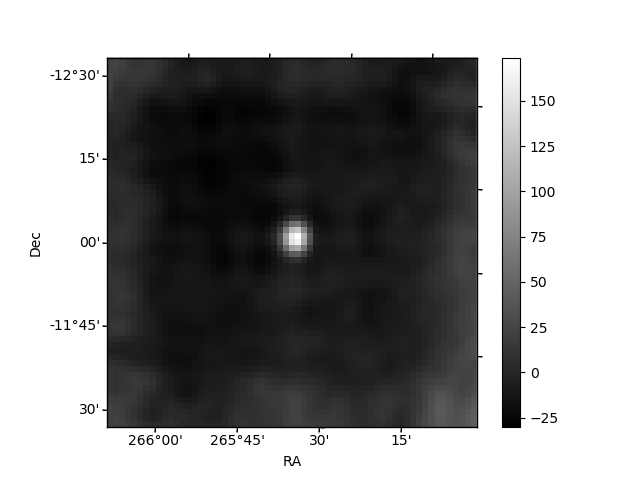
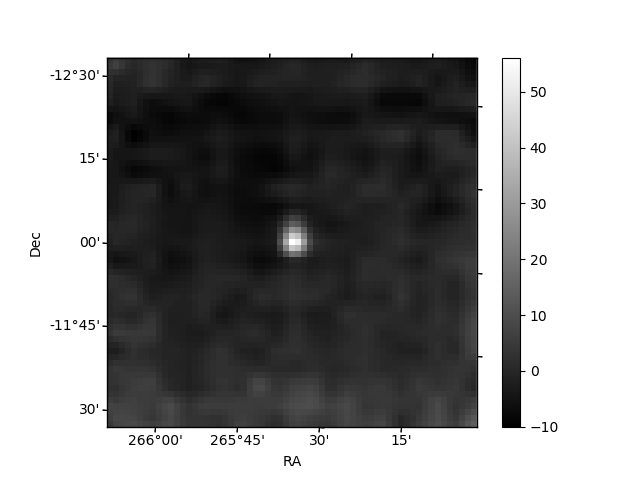
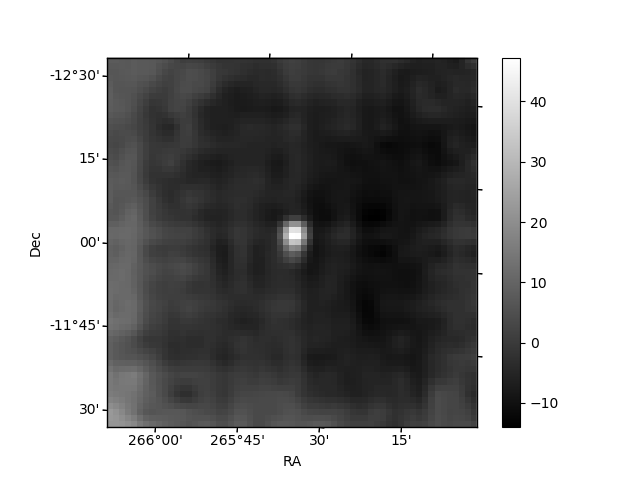
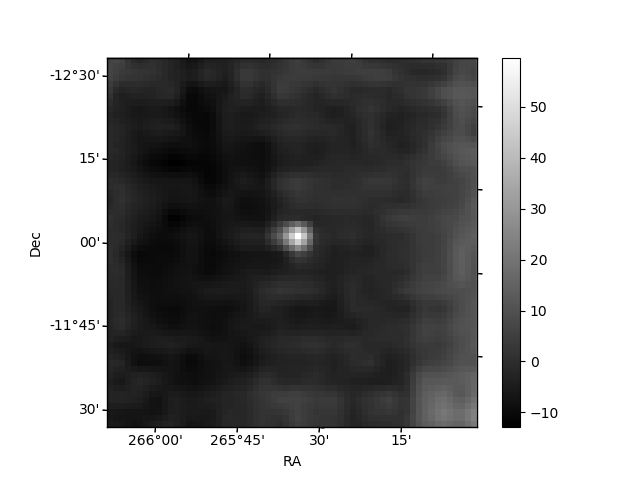
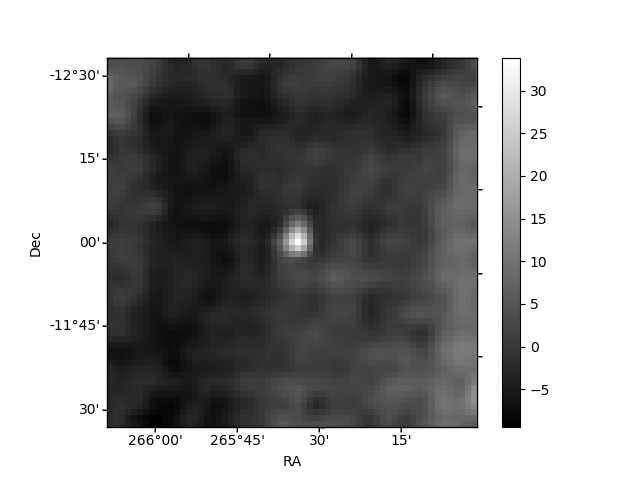
Histogram calculated using DETX and DETY for each event in the final _common_clean file
| Quadrant A | 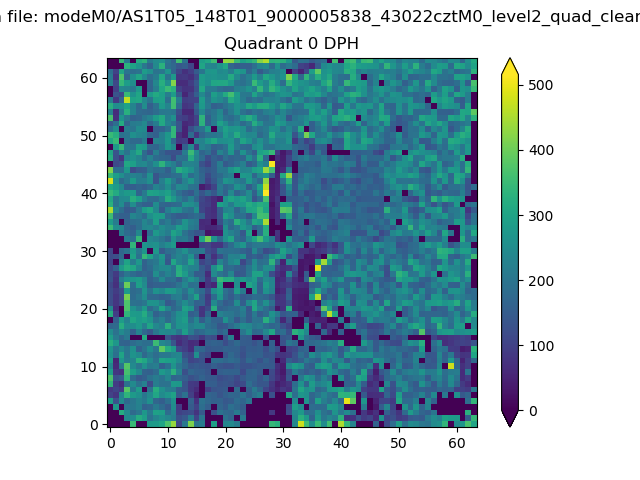 |
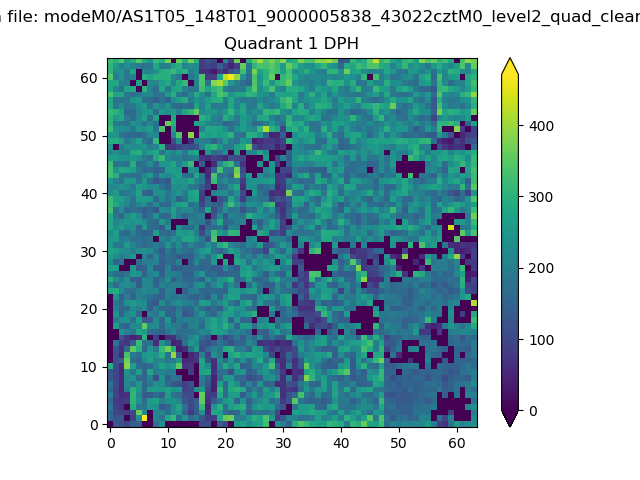 |
Quadrant B |
|---|---|---|---|
| Quadrant D | 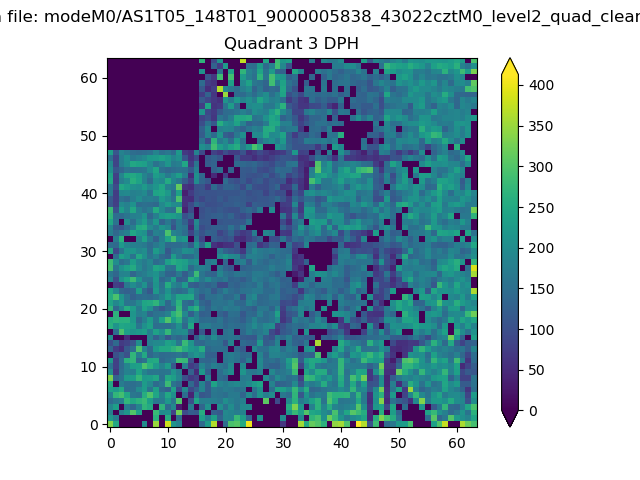 |
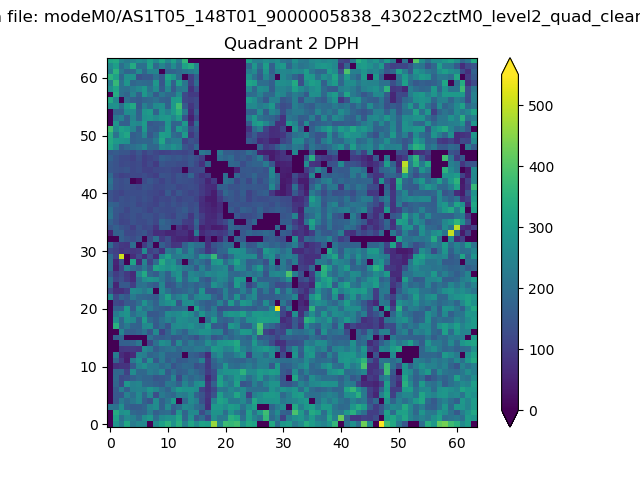 |
Quadrant C |
| Plot type | Count rate plots | Images |
|---|---|---|
| Comparison with Poisson distribution Blue bars denote a histogram of data divided into 1 sec bins. Red curve is a Poisson curve with rate = median count rate of data. |
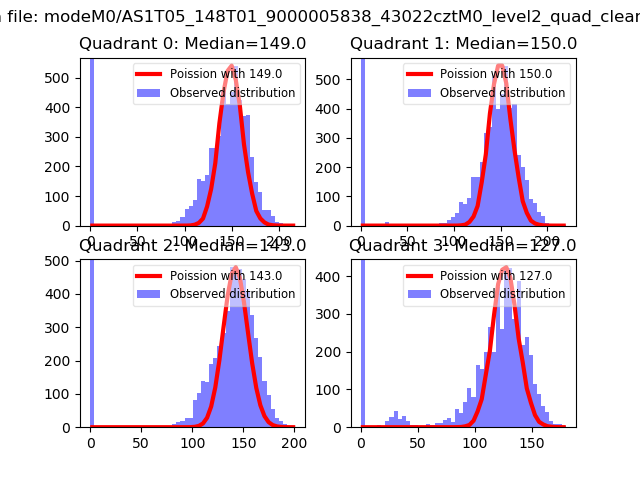 |
 |
| Quadrant-wise count rates Data is divided into 100 sec bins |
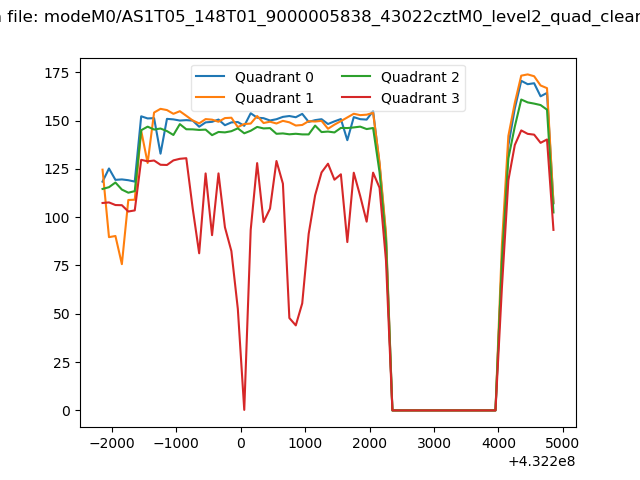 |
|
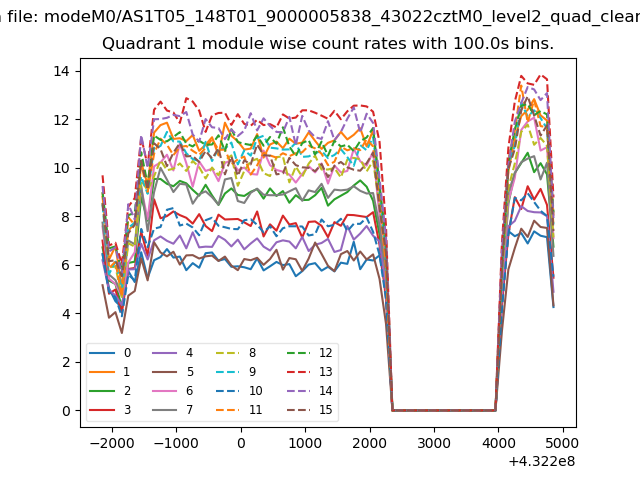
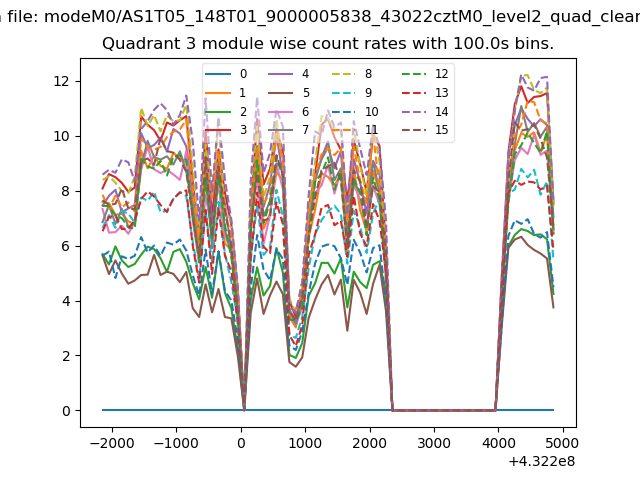
| Module-wise count rates for Quadrant A Data is divided into 100 sec bins |
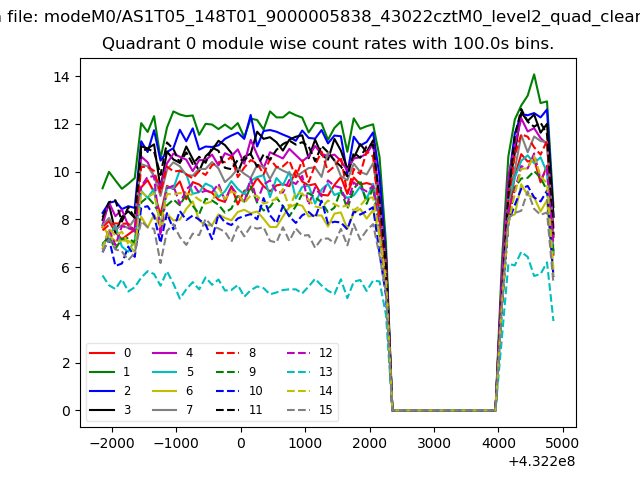 |
 |
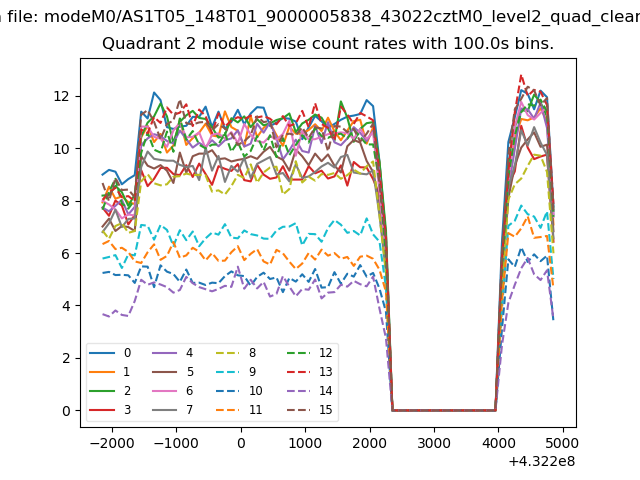
| Module-wise count rates for Quadrant B Data is divided into 100 sec bins |
 |
 |
| Module-wise count rates for Quadrant C Data is divided into 100 sec bins |
 |
 |
| Module-wise count rates for Quadrant D Data is divided into 100 sec bins |
 |
 |
| Parameter | Plot |
|---|---|
| CZT HV Monitor |  |
| D_VDD | 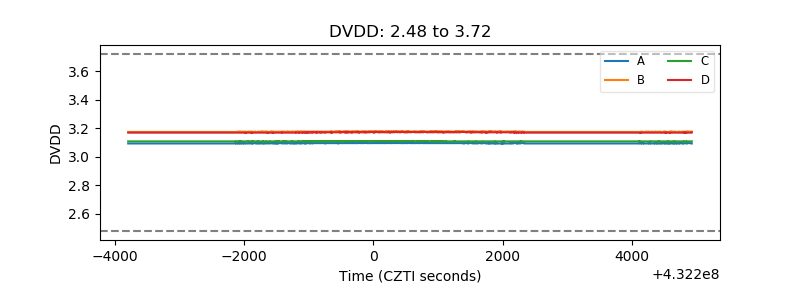 |
| Temperature 1 | 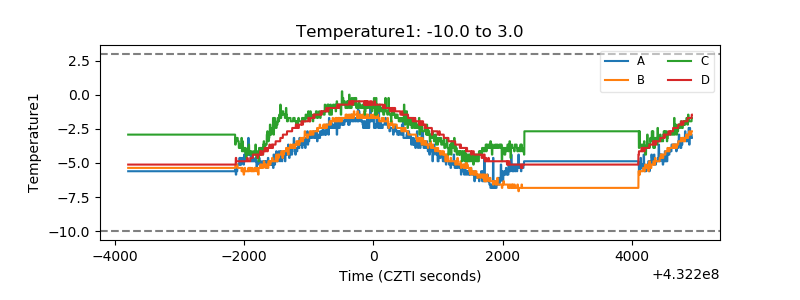 |
| Veto HV Monitor | 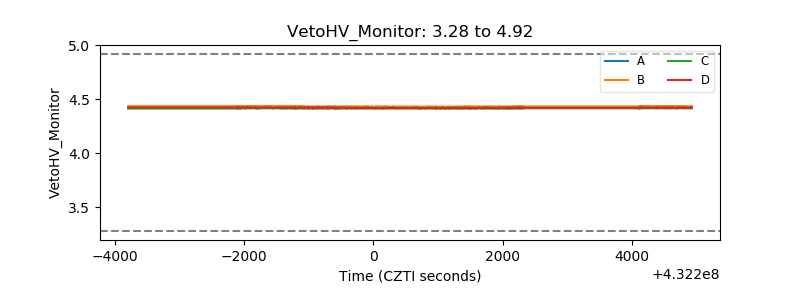 |
| Veto LLD | 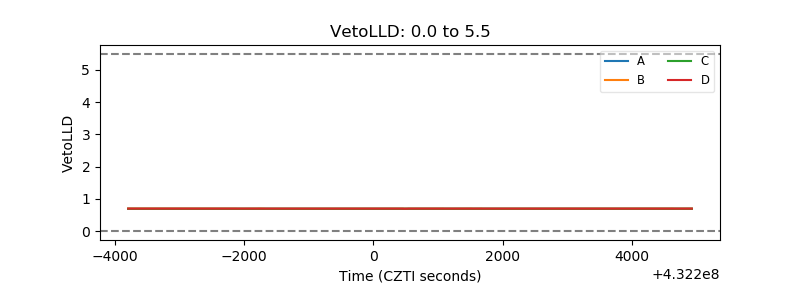 |
| Alpha Counter | 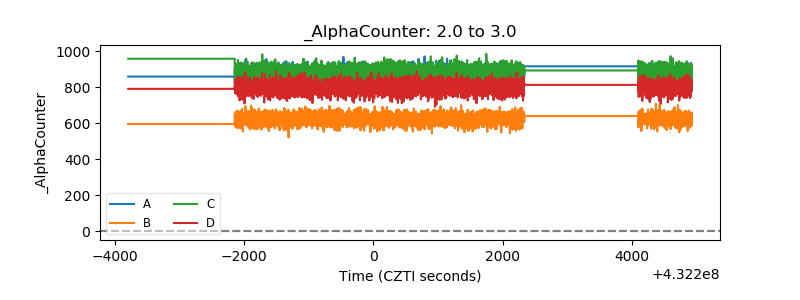 |
| _CPM_Rate | 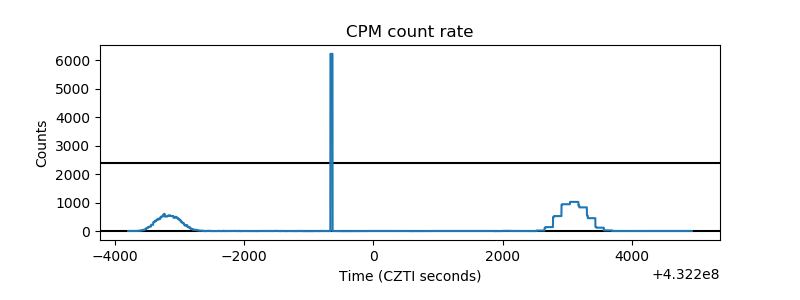 |
| CZT Counter | 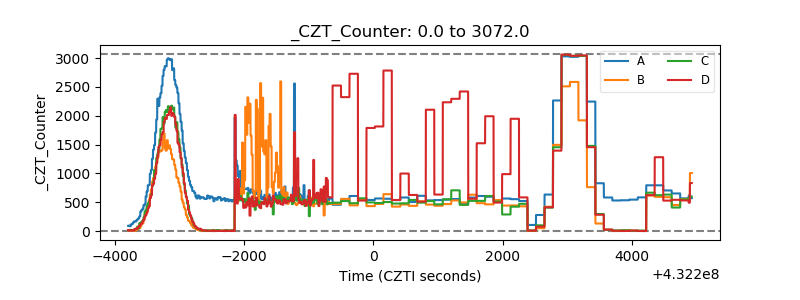 |
| +2.5 Volts monitor | 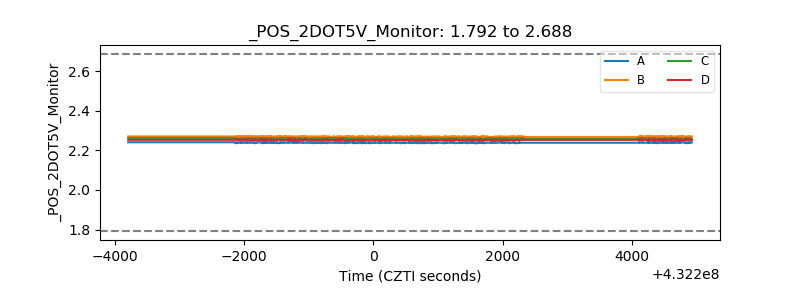 |
| +5 Volts monitor |  |
| _ROLL_ROT | 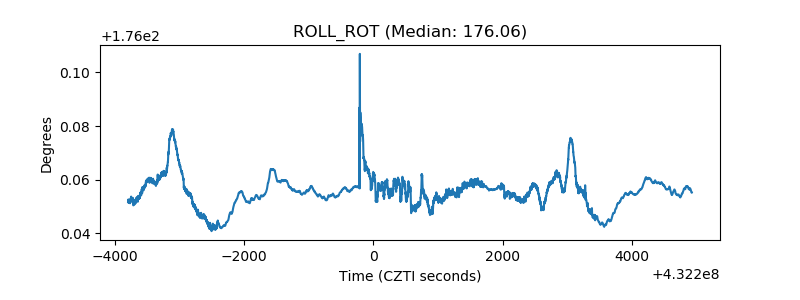 |
| _Roll_DEC | 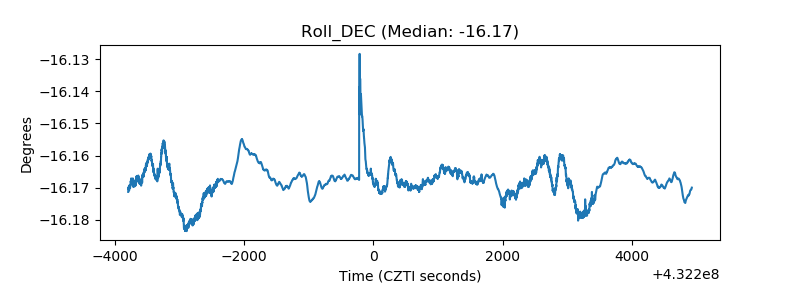 |
| _Roll_RA | 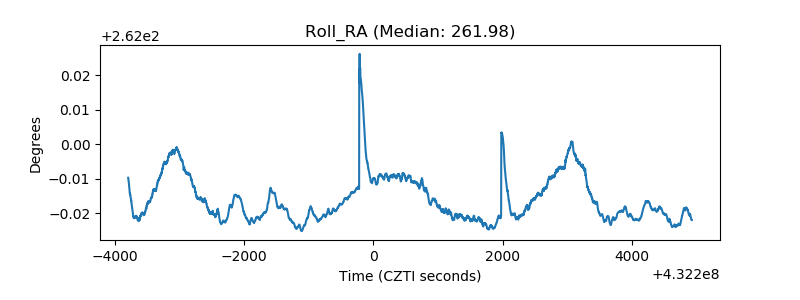 |
| Veto Counter | 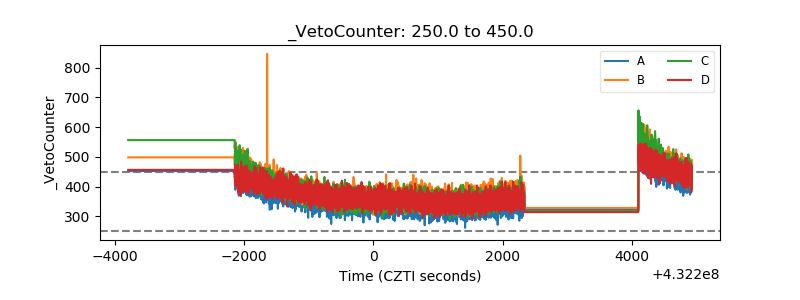 |