| Param | Original file | Final file |
|---|---|---|
| Filename | modeM0/AS1T05_148T01_9000005838_43023cztM0_level2.fits | modeM0/AS1T05_148T01_9000005838_43023cztM0_level2_quad_clean.evt |
| Size (bytes) | 396,270,720 | 113,613,120 |
| Size | 377.9 MB | 108.3 MB |
| Events in quadrant A | 3,368,014 | 821,566 |
| Events in quadrant B | 3,722,021 | 794,454 |
| Events in quadrant C | 2,806,523 | 789,376 |
| Events in quadrant D | 4,367,979 | 671,334 |
| Mode M9 | |||
|---|---|---|---|
| Quadrant | BADHDUFLAG | Total packets | Discarded packets |
| A | 0 | 31 | 0 |
| B | 0 | 32 | 0 |
| C | 0 | 32 | 0 |
| D | 0 | 32 | 0 |
| Mode SS | |||
|---|---|---|---|
| Quadrant | BADHDUFLAG | Total packets | Discarded packets |
| A | 0 | 106 | 0 |
| B | 0 | 106 | 0 |
| C | 0 | 106 | 0 |
| D | 0 | 106 | 0 |
| Mode M0 | |||
|---|---|---|---|
| Quadrant | BADHDUFLAG | Total packets | Discarded packets |
| A | 0 | 13326 | 2 |
| B | 0 | 14442 | 2 |
| C | 0 | 11374 | 2 |
| D | 0 | 16373 | 2 |
| Quadrant | Total seconds | Saturated seconds | Saturation percentage |
|---|---|---|---|
| A | 5198 | 54 | 1.038861% |
| B | 5198 | 291 | 5.598307% |
| C | 5198 | 3 | 0.057715% |
| D | 5198 | 406 | 7.810696% |
Noise dominated data is calculated using 1-second bins in cleaned event files. If a bin has >2000 counts, and if more than 50% of those come from <1% of pixels, then it is considered to be noise-dominated and hence unusable.
| Quadrant | # 1 sec bins | Bins with >0 counts | Bins with >2000 counts | High rate bins dominated by noise | Noise dominated (total time) | Noise dominated (detector-on time) | Marked lightcurve |
|---|---|---|---|---|---|---|---|
| A | 7109 | 5199 | 30 | 30 | 0.42% | 0.58% | 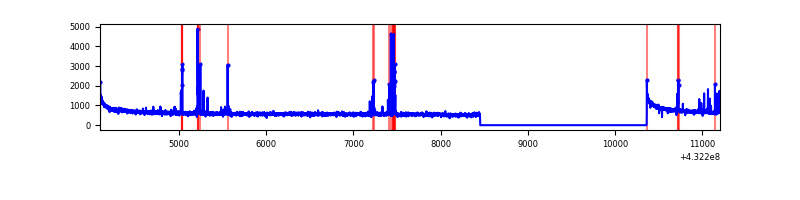 |
| B | 7109 | 5199 | 227 | 227 | 3.19% | 4.37% | 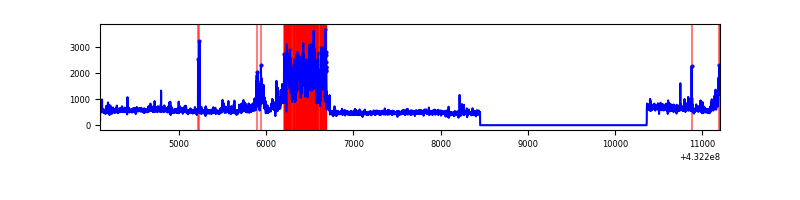 |
| C | 7109 | 5199 | 1 | 1 | 0.01% | 0.02% | 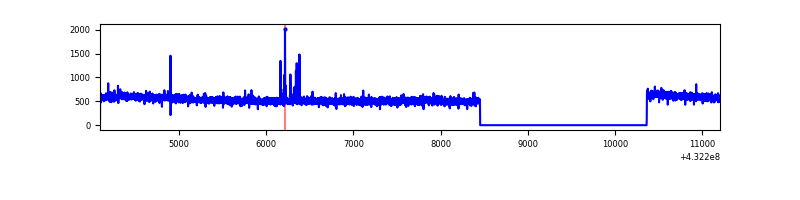 |
| D | 7109 | 5199 | 342 | 342 | 4.81% | 6.58% | 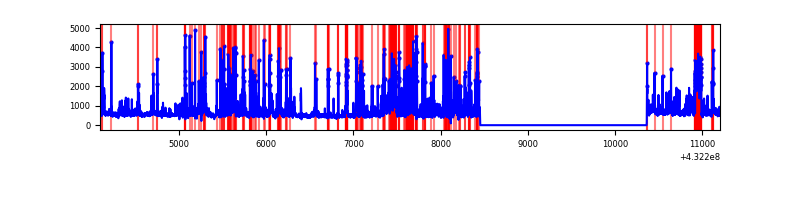 |
Top three noisy pixels from each quadrant. If the there are fewer than three noisy pixels in the level2.evt file, extra rows are filled as -1
| Pixel properties | Quadrant properties | ||||||
|---|---|---|---|---|---|---|---|
| Quadrant | DetID | PixID | Counts | Sigma | Mean | Median | Sigma |
| A | 10 | 83 | 579299 | 3861.2 | 680 | 668 | 149.9 |
| A | 15 | 237 | 154888 | 1029.11 | 680 | 668 | 149.9 |
| A | 13 | 248 | 7391 | 44.86 | 680 | 668 | 149.9 |
| B | 0 | 186 | 932996 | 6722.62 | 660 | 647 | 138.7 |
| B | 4 | 81 | 94051 | 673.48 | 660 | 647 | 138.7 |
| B | 0 | 189 | 63800 | 455.36 | 660 | 647 | 138.7 |
| C | 15 | 214 | 229296 | 1388.5 | 653 | 660 | 164.7 |
| C | 5 | 250 | 21529 | 126.74 | 653 | 660 | 164.7 |
| C | 14 | 254 | 7302 | 40.34 | 653 | 660 | 164.7 |
| D | 1 | 52 | 788403 | 4713.63 | 633 | 615 | 167.1 |
| D | 13 | 249 | 632375 | 3780.06 | 633 | 615 | 167.1 |
| D | 12 | 233 | 214869 | 1281.96 | 633 | 615 | 167.1 |
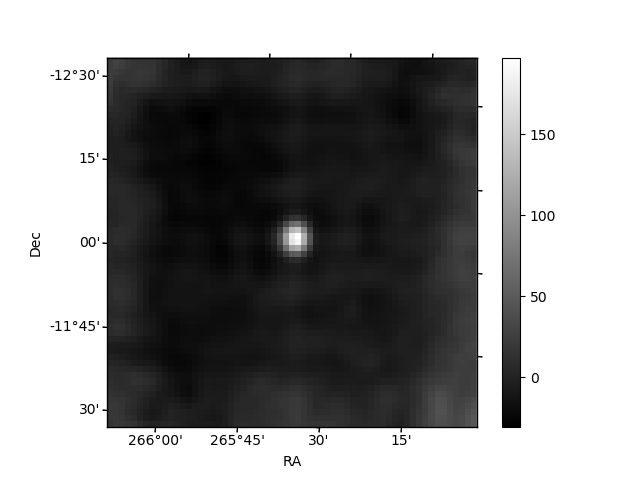
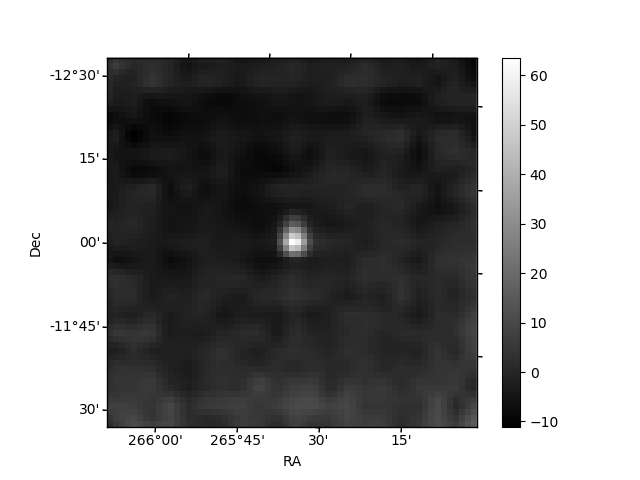
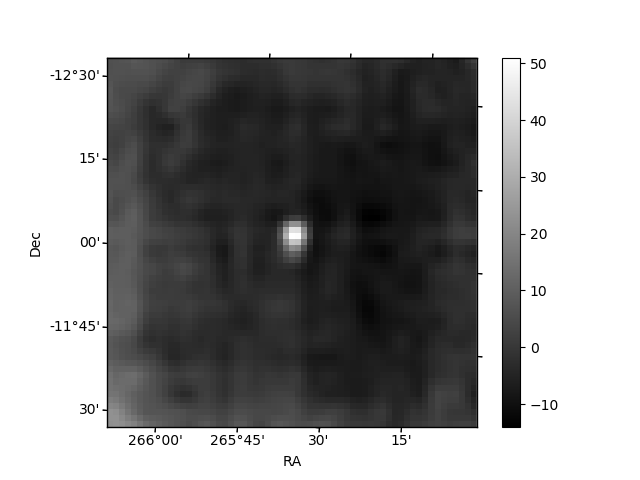
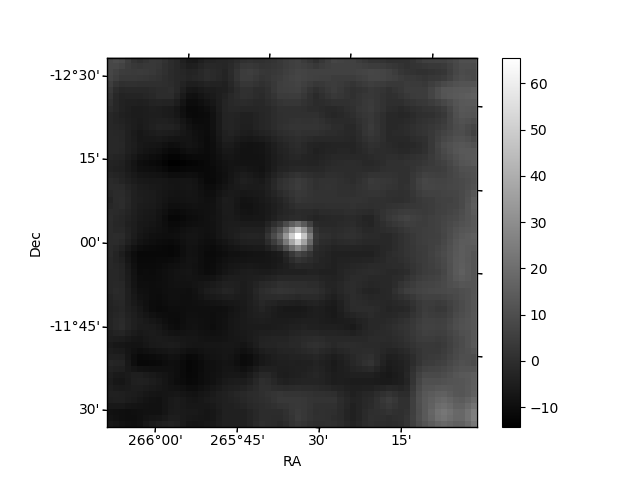
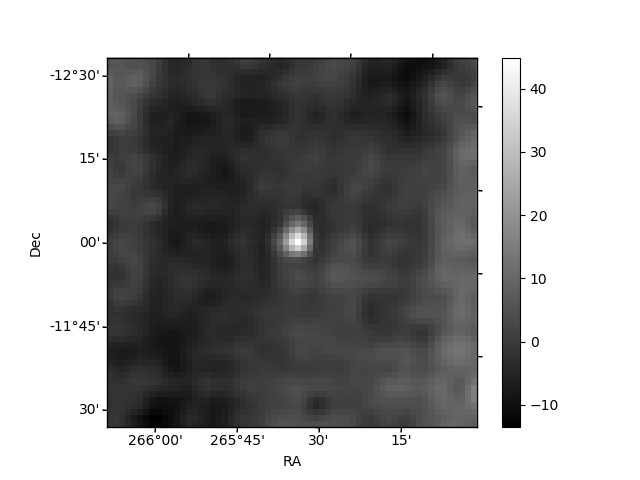
Histogram calculated using DETX and DETY for each event in the final _common_clean file
| Quadrant A | 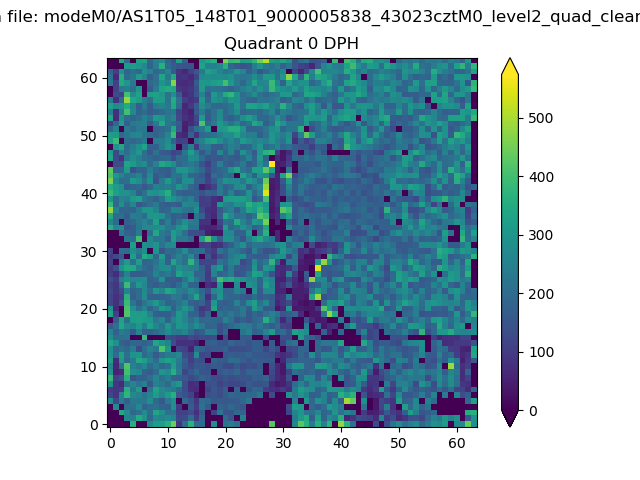 |
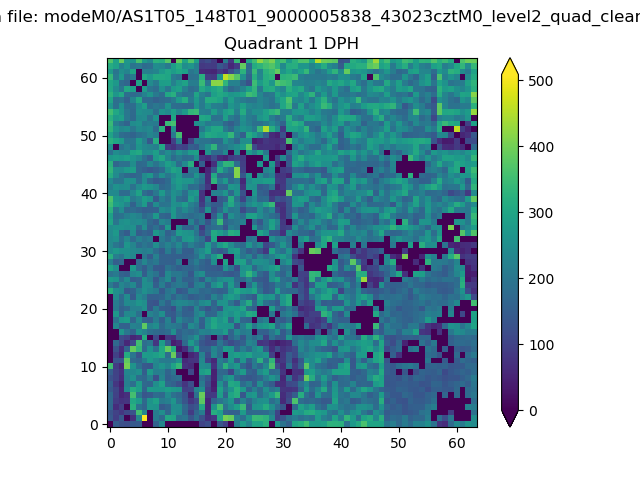 |
Quadrant B |
|---|---|---|---|
| Quadrant D | 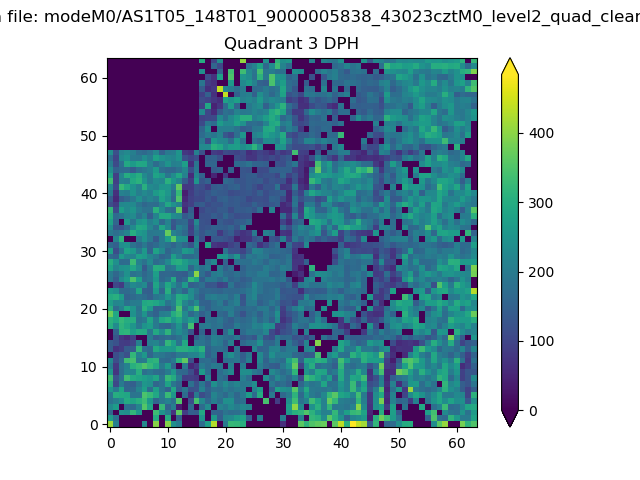 |
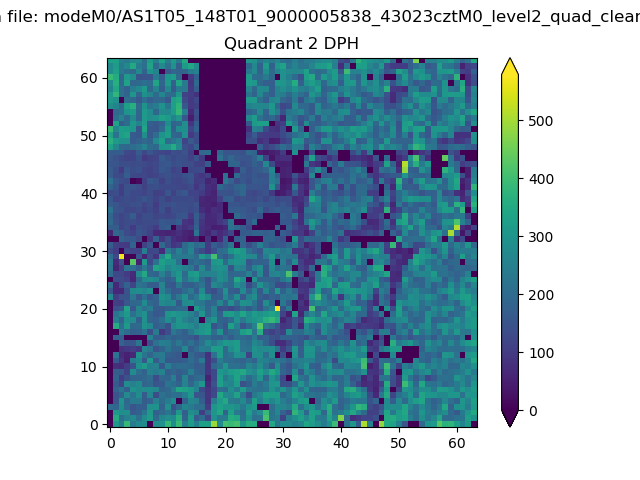 |
Quadrant C |
| Plot type | Count rate plots | Images |
|---|---|---|
| Comparison with Poisson distribution Blue bars denote a histogram of data divided into 1 sec bins. Red curve is a Poisson curve with rate = median count rate of data. |
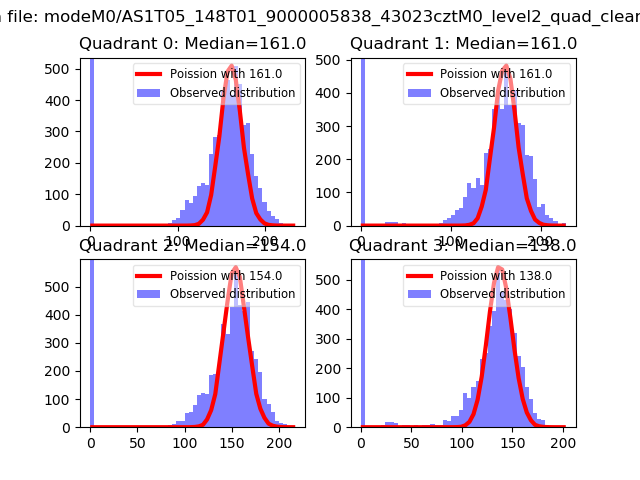 |
 |
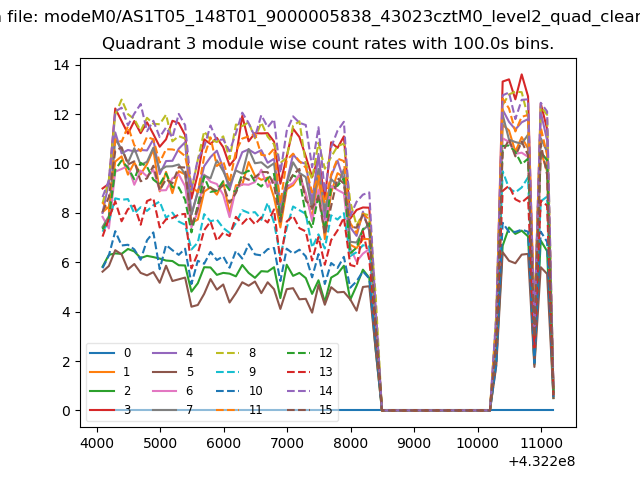
| Quadrant-wise count rates Data is divided into 100 sec bins |
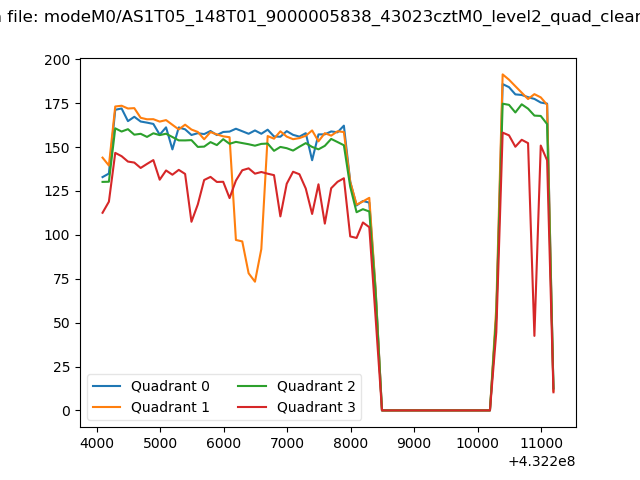 |
|
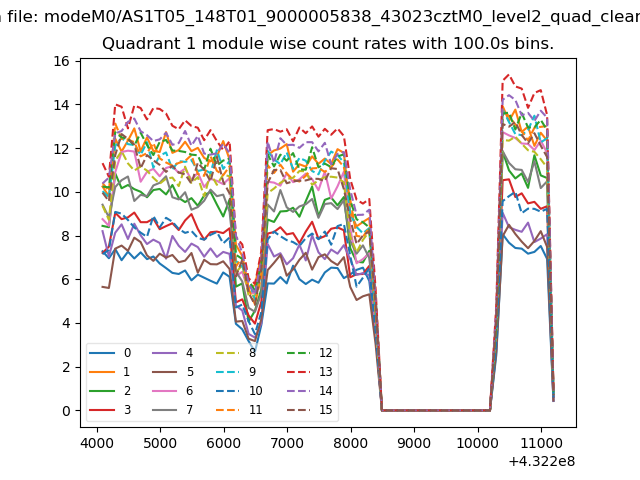
| Module-wise count rates for Quadrant A Data is divided into 100 sec bins |
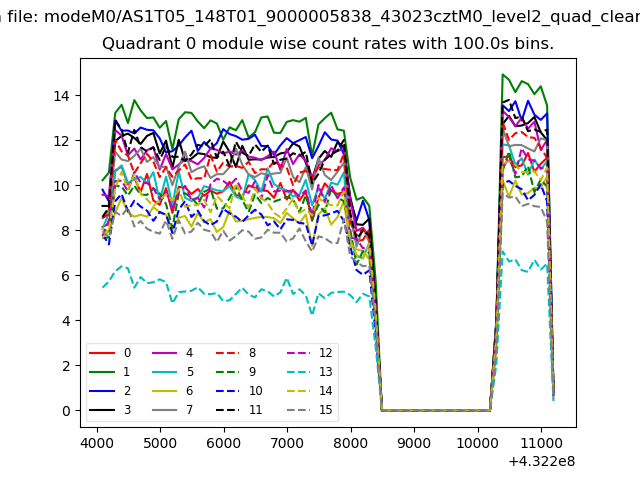 |
 |
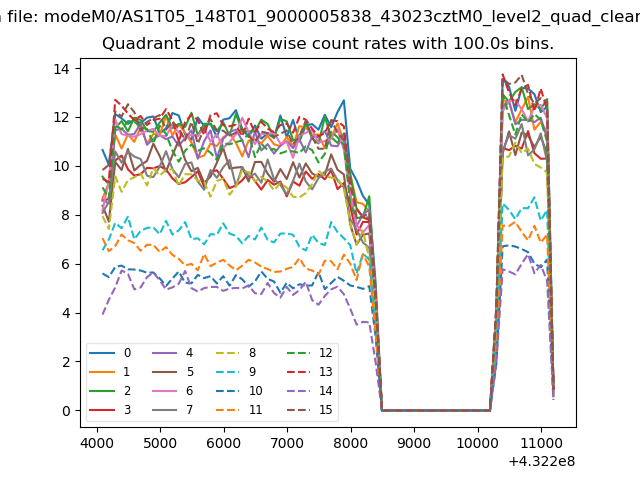
| Module-wise count rates for Quadrant B Data is divided into 100 sec bins |
 |
 |
| Module-wise count rates for Quadrant C Data is divided into 100 sec bins |
 |
 |
| Module-wise count rates for Quadrant D Data is divided into 100 sec bins |
 |
 |
| Parameter | Plot |
|---|---|
| CZT HV Monitor | 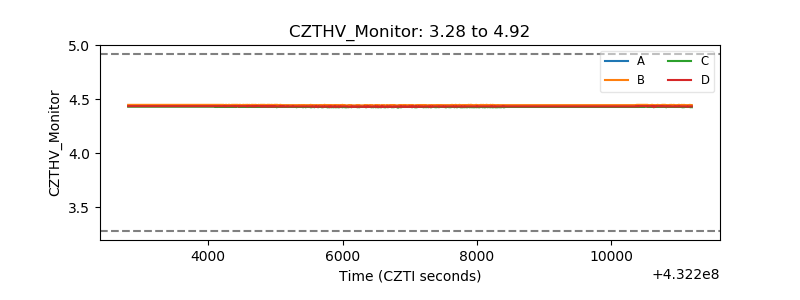 |
| D_VDD | 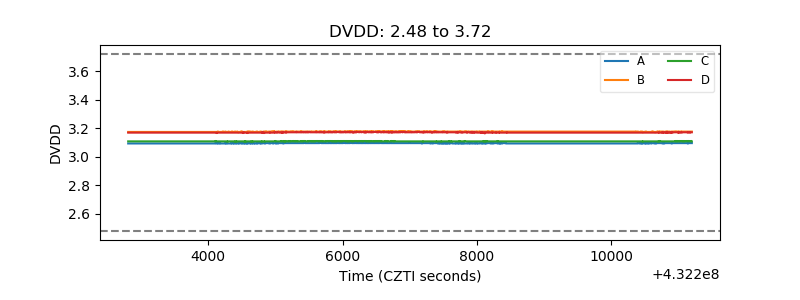 |
| Temperature 1 | 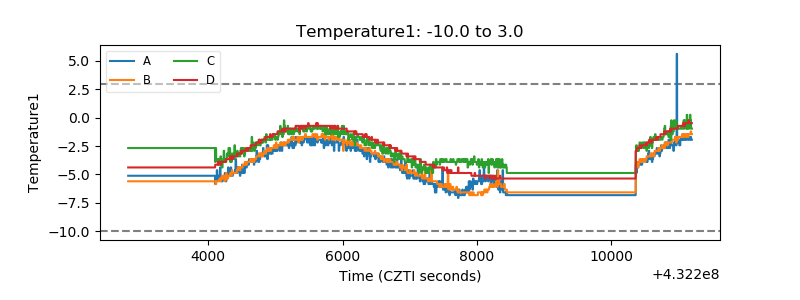 |
| Veto HV Monitor |  |
| Veto LLD | 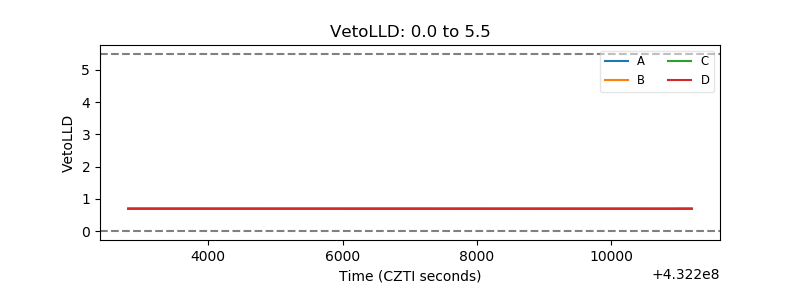 |
| Alpha Counter | 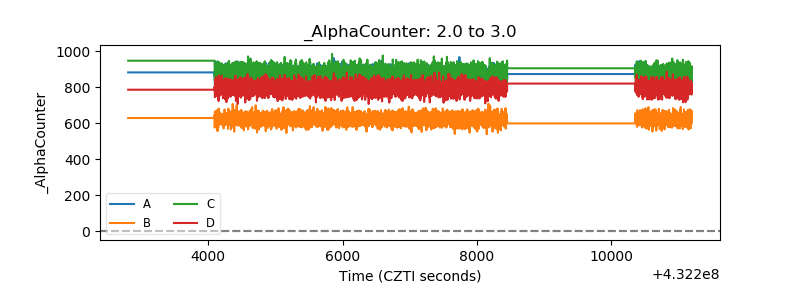 |
| _CPM_Rate | 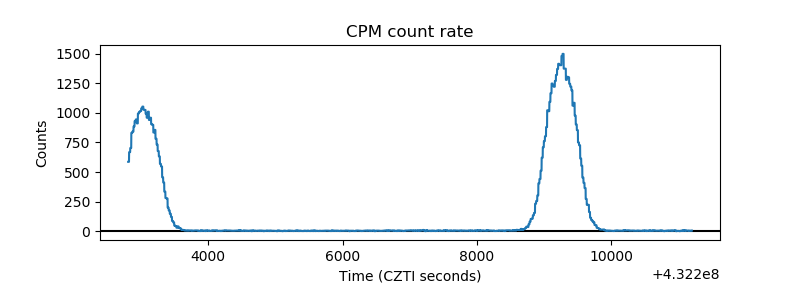 |
| CZT Counter | 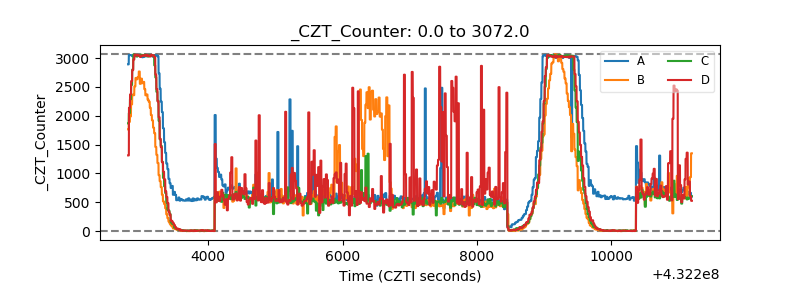 |
| +2.5 Volts monitor | 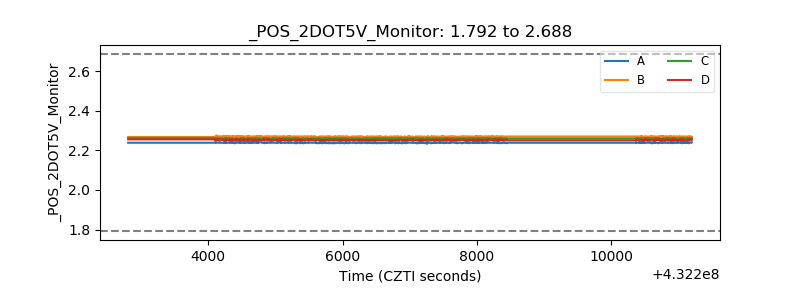 |
| +5 Volts monitor | 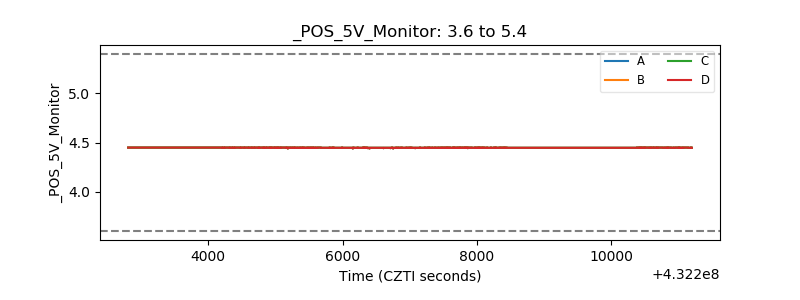 |
| _ROLL_ROT | 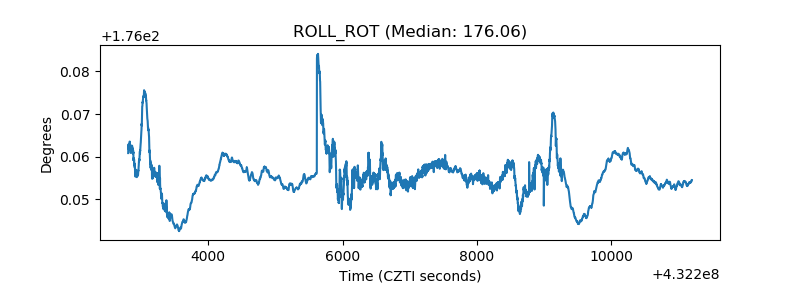 |
| _Roll_DEC | 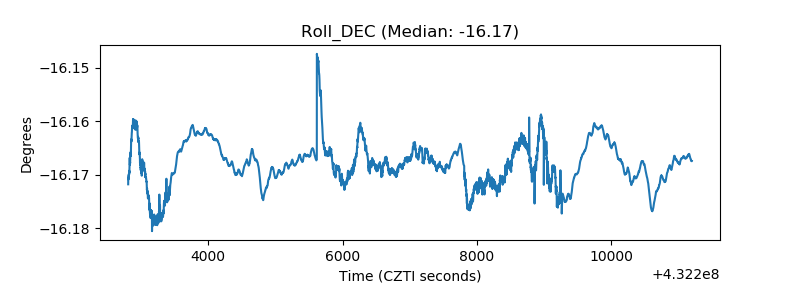 |
| _Roll_RA | 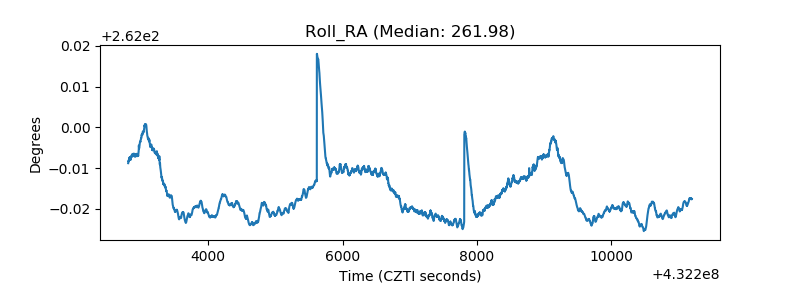 |
| Veto Counter | 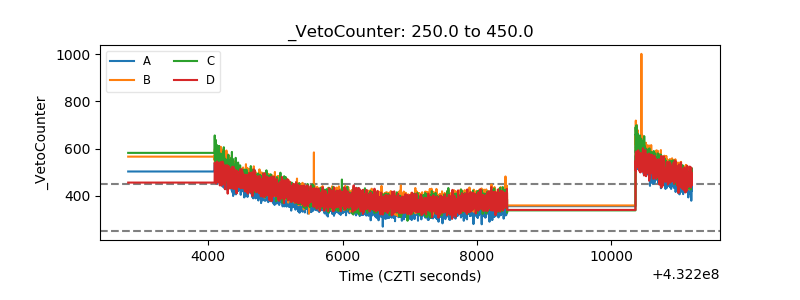 |