| Param | Original file | Final file |
|---|---|---|
| Filename | modeM0/AS1T05_148T01_9000005838_43024cztM0_level2.fits | modeM0/AS1T05_148T01_9000005838_43024cztM0_level2_quad_clean.evt |
| Size (bytes) | 462,571,200 | 108,371,520 |
| Size | 441.1 MB | 103.4 MB |
| Events in quadrant A | 3,583,797 | 803,754 |
| Events in quadrant B | 5,363,056 | 703,578 |
| Events in quadrant C | 2,724,035 | 780,910 |
| Events in quadrant D | 5,058,354 | 638,940 |
| Mode M9 | |||
|---|---|---|---|
| Quadrant | BADHDUFLAG | Total packets | Discarded packets |
| A | 0 | 24 | 0 |
| B | 0 | 25 | 0 |
| C | 0 | 25 | 0 |
| D | 0 | 25 | 0 |
| Mode SS | |||
|---|---|---|---|
| Quadrant | BADHDUFLAG | Total packets | Discarded packets |
| A | 0 | 102 | 0 |
| B | 0 | 102 | 0 |
| C | 0 | 102 | 0 |
| D | 0 | 102 | 0 |
| Mode M0 | |||
|---|---|---|---|
| Quadrant | BADHDUFLAG | Total packets | Discarded packets |
| A | 0 | 14025 | 2 |
| B | 0 | 19378 | 2 |
| C | 0 | 11120 | 2 |
| D | 0 | 18527 | 4 |
| Quadrant | Total seconds | Saturated seconds | Saturation percentage |
|---|---|---|---|
| A | 5068 | 153 | 3.018942% |
| B | 5068 | 917 | 18.093923% |
| C | 5068 | 4 | 0.078927% |
| D | 5067 | 661 | 13.045194% |
Noise dominated data is calculated using 1-second bins in cleaned event files. If a bin has >2000 counts, and if more than 50% of those come from <1% of pixels, then it is considered to be noise-dominated and hence unusable.
| Quadrant | # 1 sec bins | Bins with >0 counts | Bins with >2000 counts | High rate bins dominated by noise | Noise dominated (total time) | Noise dominated (detector-on time) | Marked lightcurve |
|---|---|---|---|---|---|---|---|
| A | 7100 | 5069 | 111 | 111 | 1.56% | 2.19% | 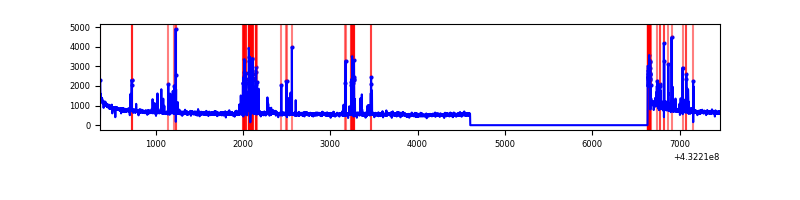 |
| B | 7100 | 5069 | 736 | 736 | 10.37% | 14.52% | 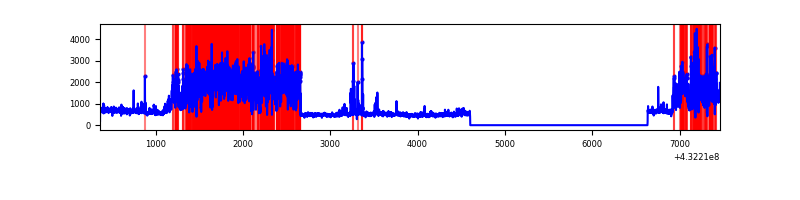 |
| C | 7100 | 5069 | 0 | 0 | 0.00% | 0.00% | 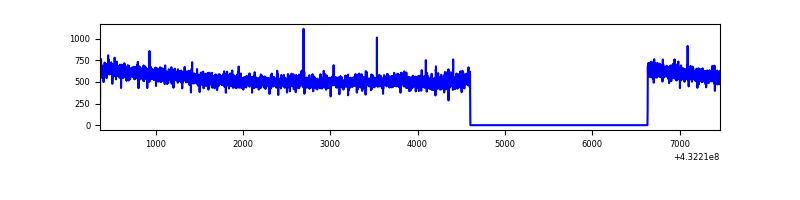 |
| D | 7099 | 5068 | 533 | 533 | 7.51% | 10.52% | 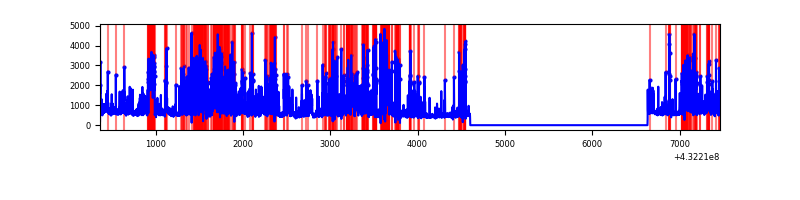 |
Top three noisy pixels from each quadrant. If the there are fewer than three noisy pixels in the level2.evt file, extra rows are filled as -1
| Pixel properties | Quadrant properties | ||||||
|---|---|---|---|---|---|---|---|
| Quadrant | DetID | PixID | Counts | Sigma | Mean | Median | Sigma |
| A | 10 | 83 | 570148 | 3935.67 | 663 | 654 | 144.7 |
| A | 15 | 237 | 447976 | 3091.36 | 663 | 654 | 144.7 |
| A | 13 | 6 | 8682 | 55.48 | 663 | 654 | 144.7 |
| B | 0 | 186 | 2477745 | 19280.94 | 624 | 612 | 128.5 |
| B | 0 | 189 | 245183 | 1903.64 | 624 | 612 | 128.5 |
| B | 5 | 255 | 73178 | 564.82 | 624 | 612 | 128.5 |
| C | 15 | 214 | 221313 | 1390.69 | 640 | 648 | 158.7 |
| C | 13 | 61 | 4247 | 22.68 | 640 | 648 | 158.7 |
| C | 15 | 111 | 3693 | 19.19 | 640 | 648 | 158.7 |
| D | 1 | 52 | 1486877 | 9465.37 | 606 | 589 | 157.0 |
| D | 13 | 249 | 780785 | 4968.65 | 606 | 589 | 157.0 |
| D | 12 | 233 | 214412 | 1361.72 | 606 | 589 | 157.0 |
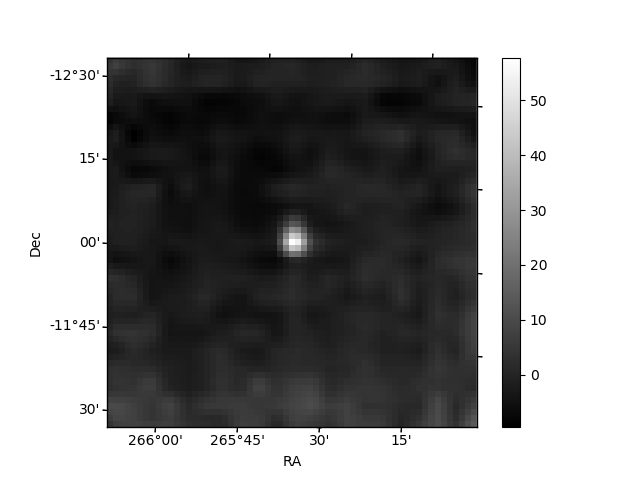
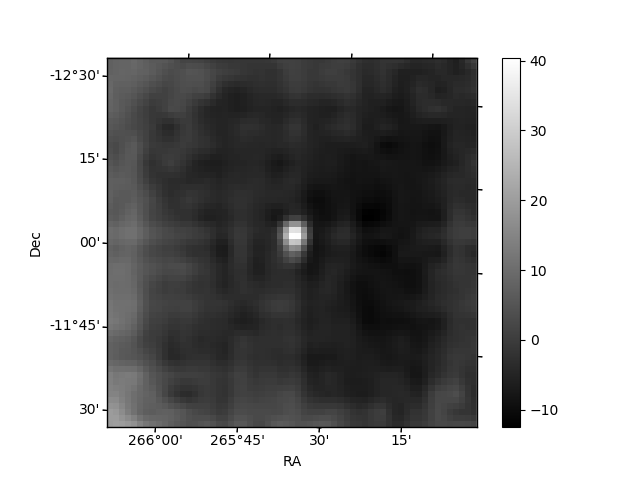
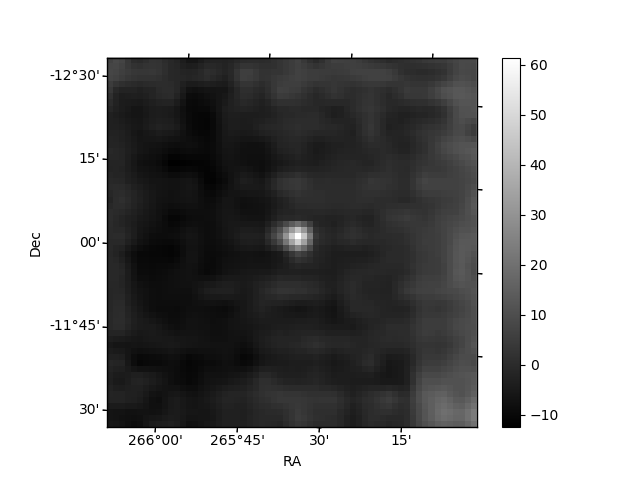
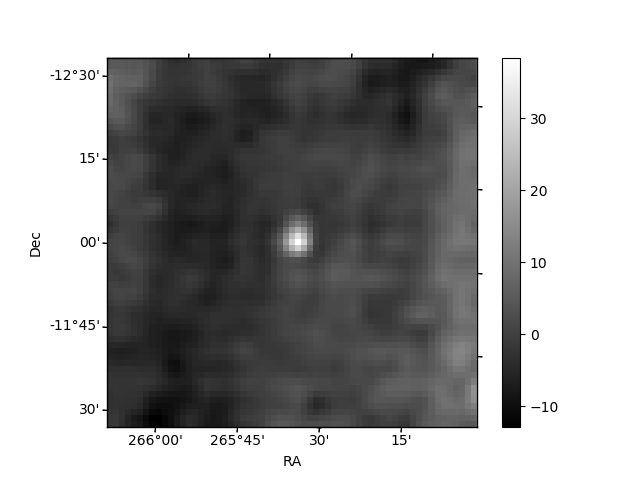
Histogram calculated using DETX and DETY for each event in the final _common_clean file
| Quadrant A | 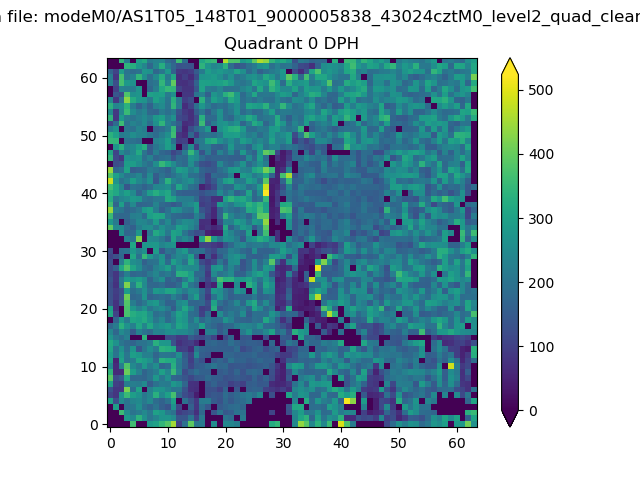 |
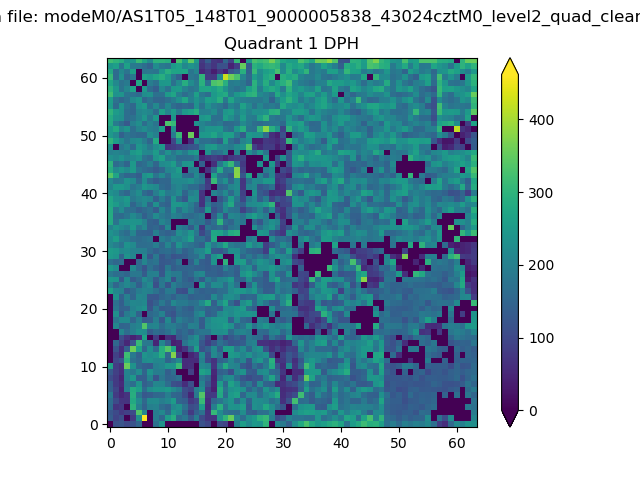 |
Quadrant B |
|---|---|---|---|
| Quadrant D | 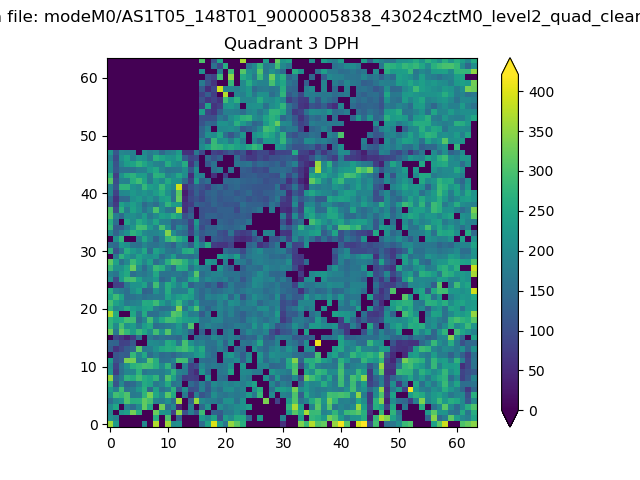 |
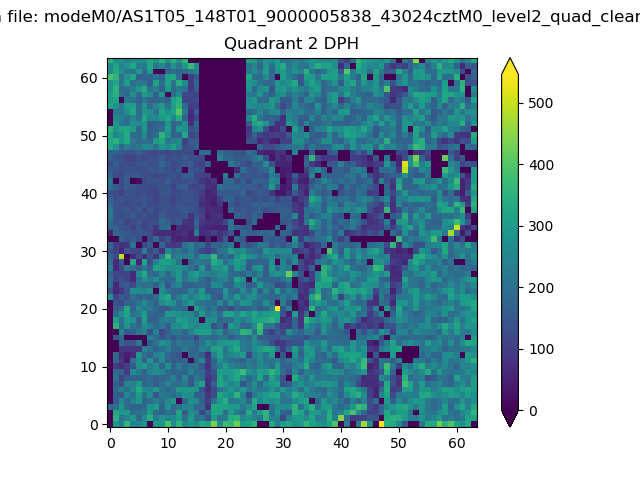 |
Quadrant C |
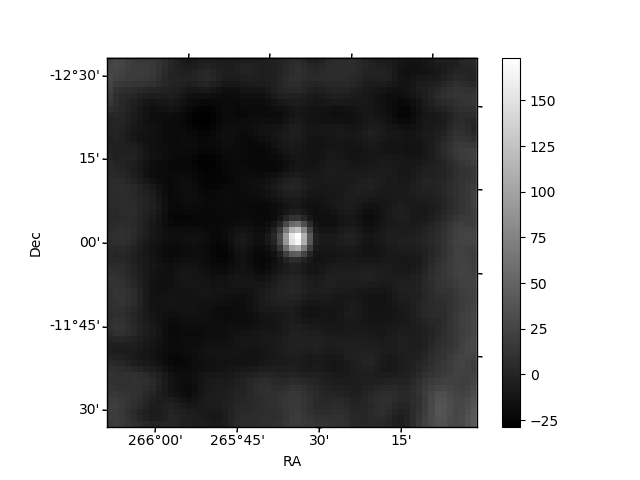
| Plot type | Count rate plots | Images |
|---|---|---|
| Comparison with Poisson distribution Blue bars denote a histogram of data divided into 1 sec bins. Red curve is a Poisson curve with rate = median count rate of data. |
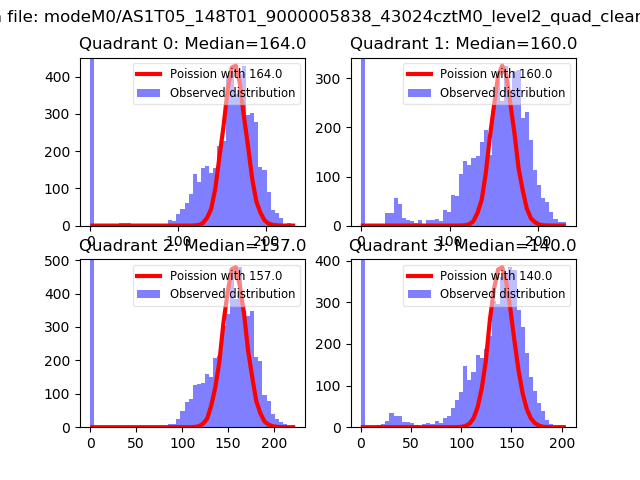 |
 |
| Quadrant-wise count rates Data is divided into 100 sec bins |
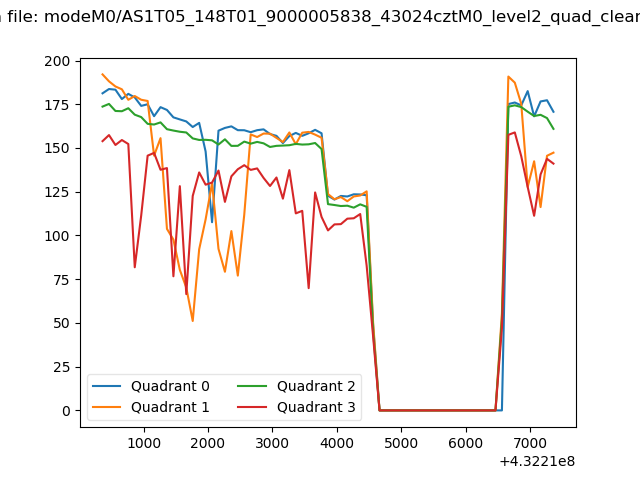 |
|
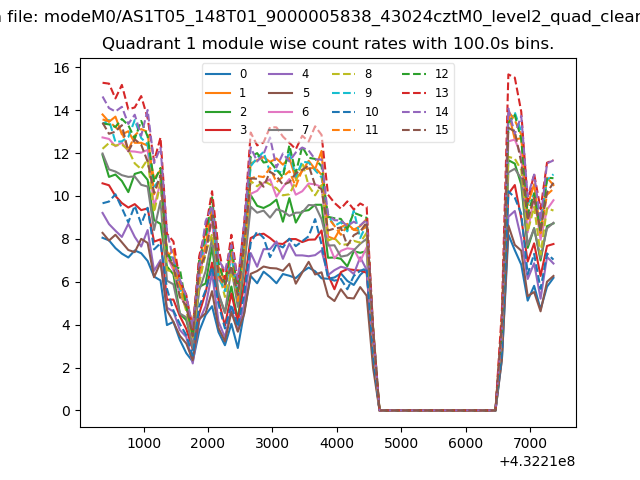
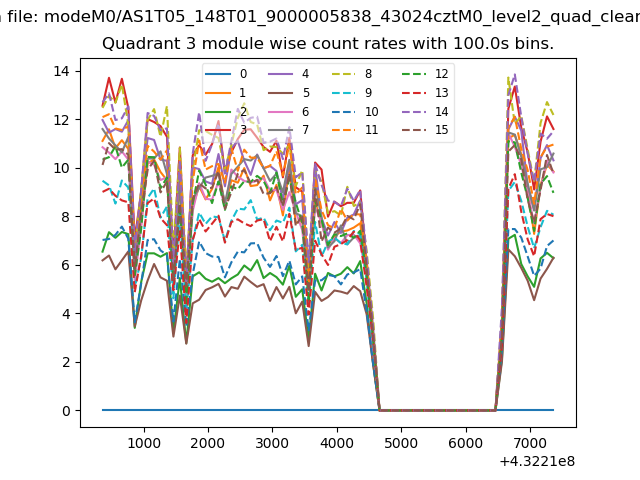
| Module-wise count rates for Quadrant A Data is divided into 100 sec bins |
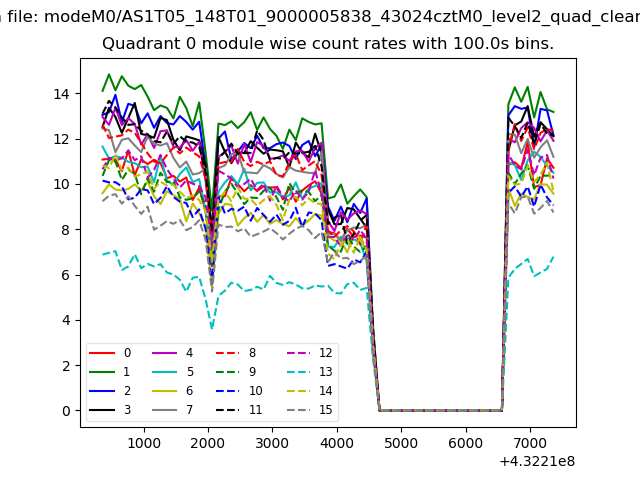 |
 |
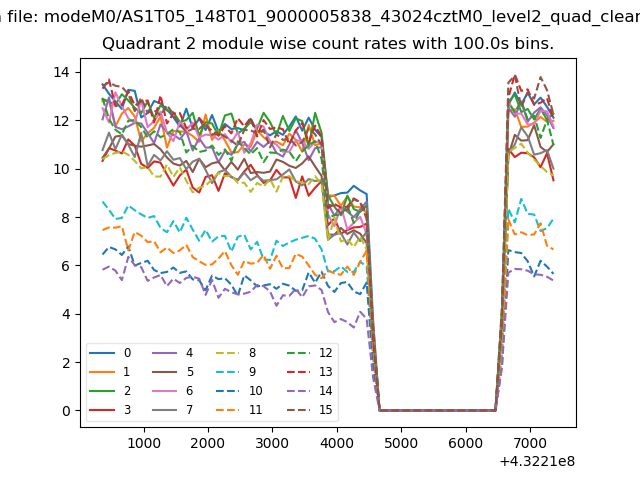
| Module-wise count rates for Quadrant B Data is divided into 100 sec bins |
 |
 |
| Module-wise count rates for Quadrant C Data is divided into 100 sec bins |
 |
 |
| Module-wise count rates for Quadrant D Data is divided into 100 sec bins |
 |
 |
| Parameter | Plot |
|---|---|
| CZT HV Monitor | 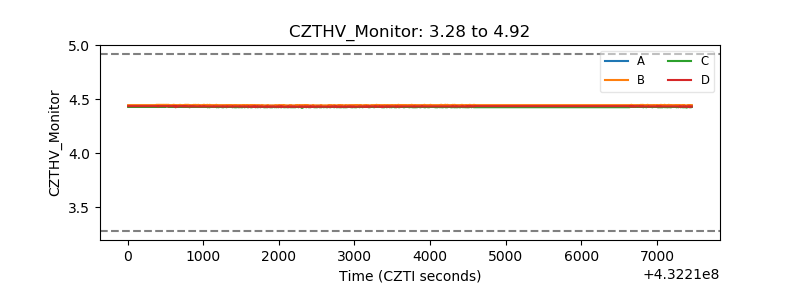 |
| D_VDD | 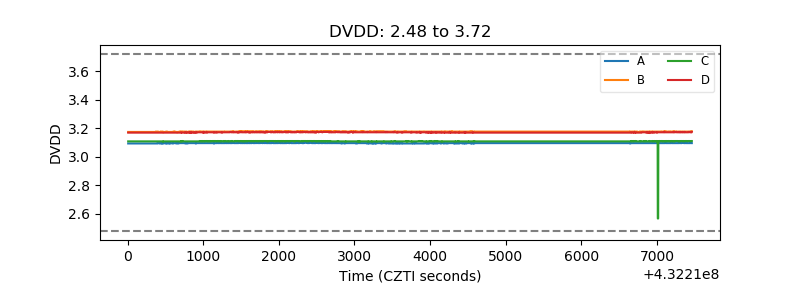 |
| Temperature 1 |  |
| Veto HV Monitor | 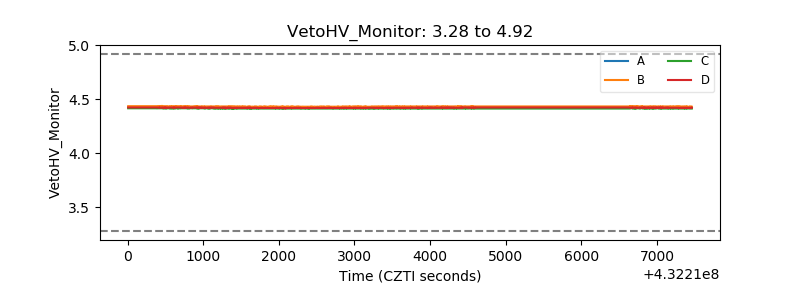 |
| Veto LLD | 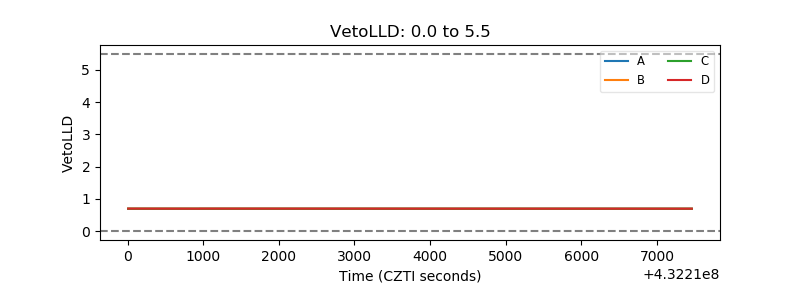 |
| Alpha Counter | 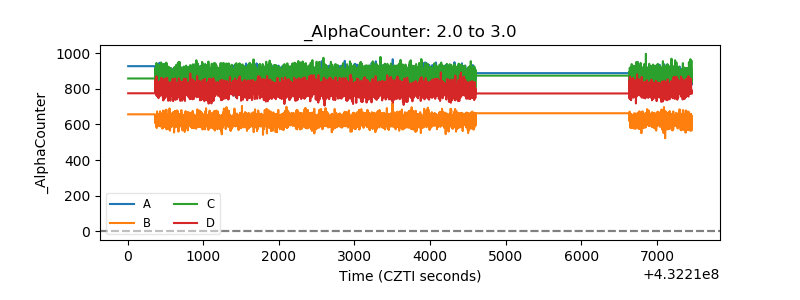 |
| _CPM_Rate | 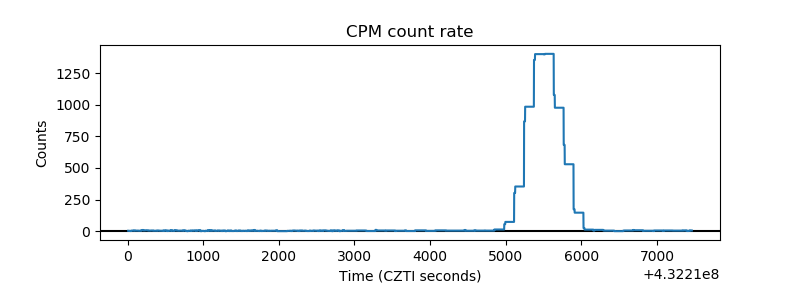 |
| CZT Counter | 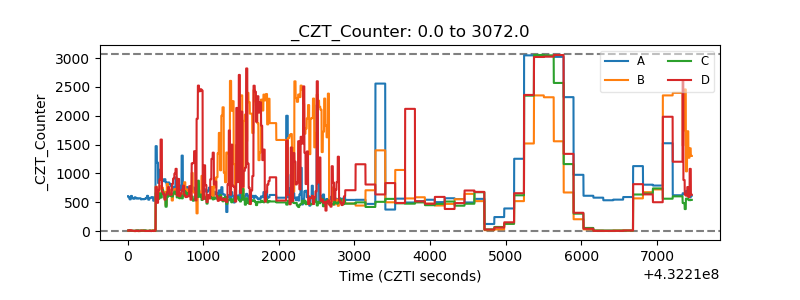 |
| +2.5 Volts monitor | 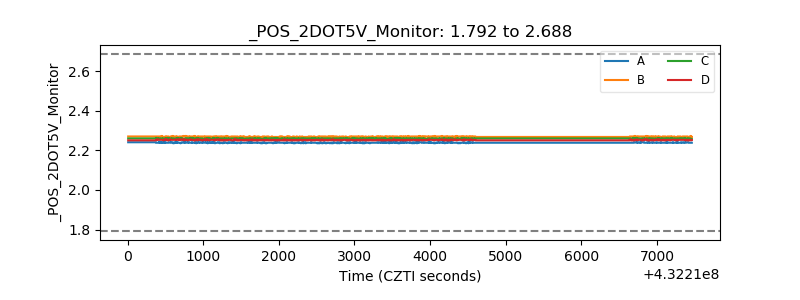 |
| +5 Volts monitor | 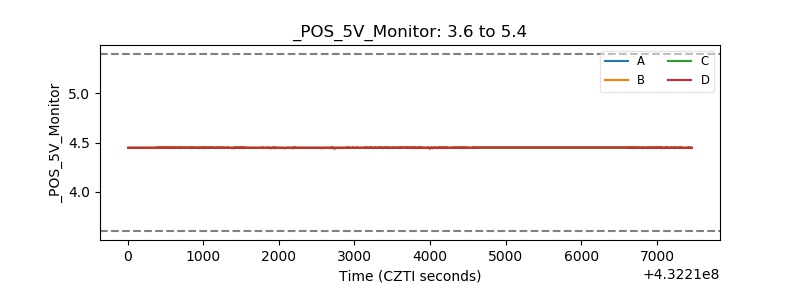 |
| _ROLL_ROT | 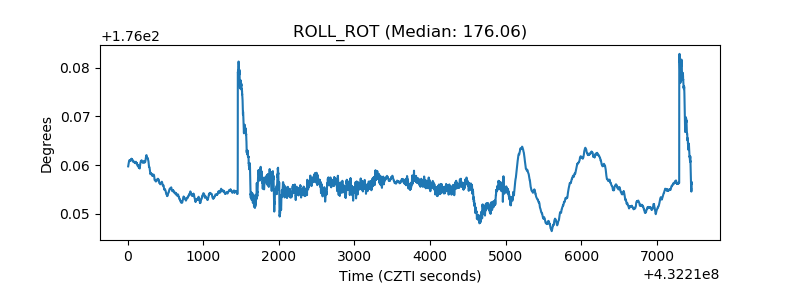 |
| _Roll_DEC | 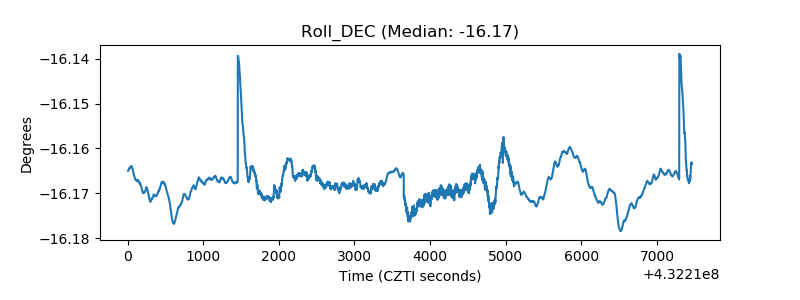 |
| _Roll_RA | 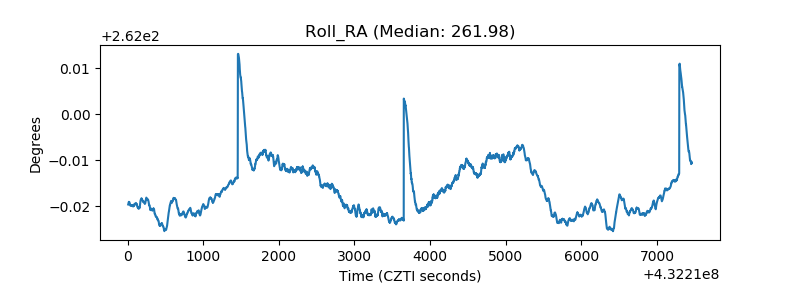 |
| Veto Counter | 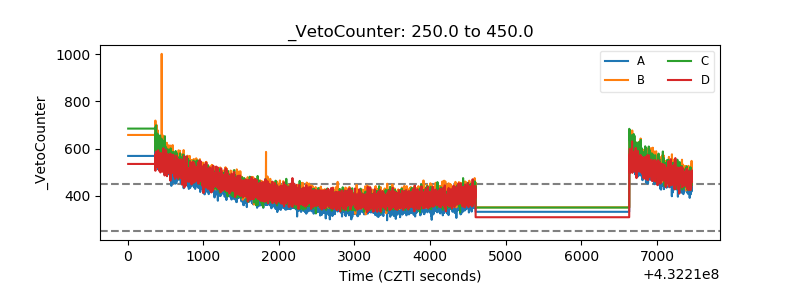 |