| Param | Original file | Final file |
|---|---|---|
| Filename | modeM0/AS1T05_148T01_9000005838_43025cztM0_level2.fits | modeM0/AS1T05_148T01_9000005838_43025cztM0_level2_quad_clean.evt |
| Size (bytes) | 486,653,760 | 107,121,600 |
| Size | 464.1 MB | 102.2 MB |
| Events in quadrant A | 3,473,441 | 810,629 |
| Events in quadrant B | 6,460,933 | 637,783 |
| Events in quadrant C | 2,747,558 | 785,056 |
| Events in quadrant D | 4,928,070 | 646,001 |
| Mode M9 | |||
|---|---|---|---|
| Quadrant | BADHDUFLAG | Total packets | Discarded packets |
| A | 0 | 21 | 0 |
| B | 0 | 22 | 0 |
| C | 0 | 22 | 0 |
| D | 0 | 22 | 0 |
| Mode SS | |||
|---|---|---|---|
| Quadrant | BADHDUFLAG | Total packets | Discarded packets |
| A | 0 | 106 | 0 |
| B | 0 | 106 | 0 |
| C | 0 | 106 | 0 |
| D | 0 | 106 | 0 |
| Mode M0 | |||
|---|---|---|---|
| Quadrant | BADHDUFLAG | Total packets | Discarded packets |
| A | 0 | 13744 | 2 |
| B | 0 | 22668 | 2 |
| C | 0 | 11122 | 2 |
| D | 0 | 18190 | 2 |
| Quadrant | Total seconds | Saturated seconds | Saturation percentage |
|---|---|---|---|
| A | 5206 | 130 | 2.497119% |
| B | 5206 | 1380 | 26.507876% |
| C | 5205 | 2 | 0.038425% |
| D | 5205 | 630 | 12.103746% |
Noise dominated data is calculated using 1-second bins in cleaned event files. If a bin has >2000 counts, and if more than 50% of those come from <1% of pixels, then it is considered to be noise-dominated and hence unusable.
| Quadrant | # 1 sec bins | Bins with >0 counts | Bins with >2000 counts | High rate bins dominated by noise | Noise dominated (total time) | Noise dominated (detector-on time) | Marked lightcurve |
|---|---|---|---|---|---|---|---|
| A | 7328 | 5207 | 75 | 75 | 1.02% | 1.44% | 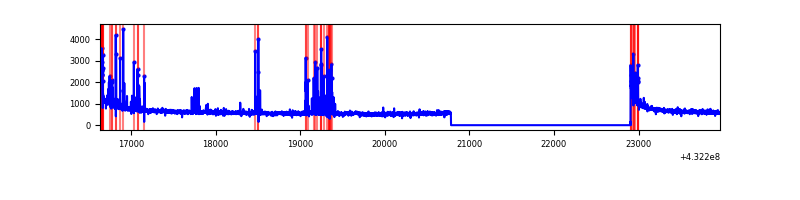 |
| B | 7328 | 5207 | 1099 | 1099 | 15.00% | 21.11% | 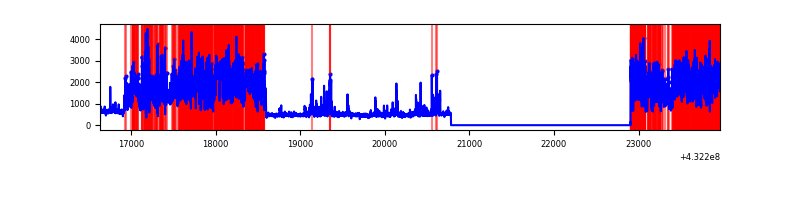 |
| C | 7327 | 5205 | 0 | 0 | 0.00% | 0.00% | 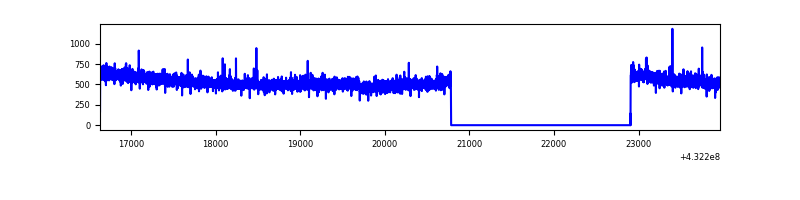 |
| D | 7327 | 5205 | 559 | 559 | 7.63% | 10.74% | 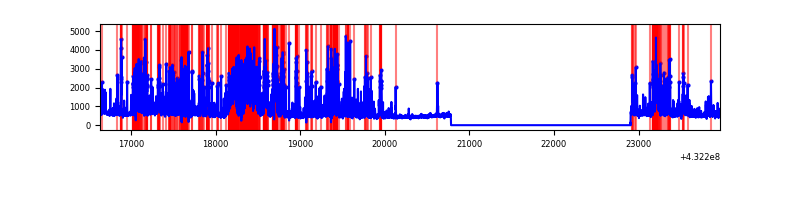 |
Top three noisy pixels from each quadrant. If the there are fewer than three noisy pixels in the level2.evt file, extra rows are filled as -1
| Pixel properties | Quadrant properties | ||||||
|---|---|---|---|---|---|---|---|
| Quadrant | DetID | PixID | Counts | Sigma | Mean | Median | Sigma |
| A | 10 | 83 | 594632 | 4082.32 | 665 | 656 | 145.5 |
| A | 15 | 237 | 304552 | 2088.64 | 665 | 656 | 145.5 |
| A | 13 | 254 | 7235 | 45.22 | 665 | 656 | 145.5 |
| B | 0 | 186 | 3092707 | 25037.72 | 606 | 596 | 123.5 |
| B | 5 | 255 | 743791 | 6017.87 | 606 | 596 | 123.5 |
| B | 0 | 189 | 107784 | 867.93 | 606 | 596 | 123.5 |
| C | 15 | 214 | 227612 | 1429.7 | 641 | 650 | 158.7 |
| C | 12 | 249 | 8295 | 48.16 | 641 | 650 | 158.7 |
| C | 14 | 254 | 6472 | 36.67 | 641 | 650 | 158.7 |
| D | 1 | 52 | 1313626 | 8296.47 | 611 | 594 | 158.3 |
| D | 13 | 249 | 585797 | 3697.64 | 611 | 594 | 158.3 |
| D | 10 | 118 | 469510 | 2962.87 | 611 | 594 | 158.3 |
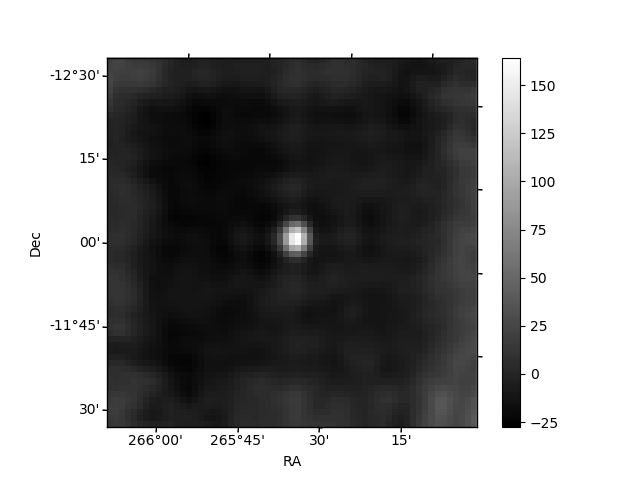
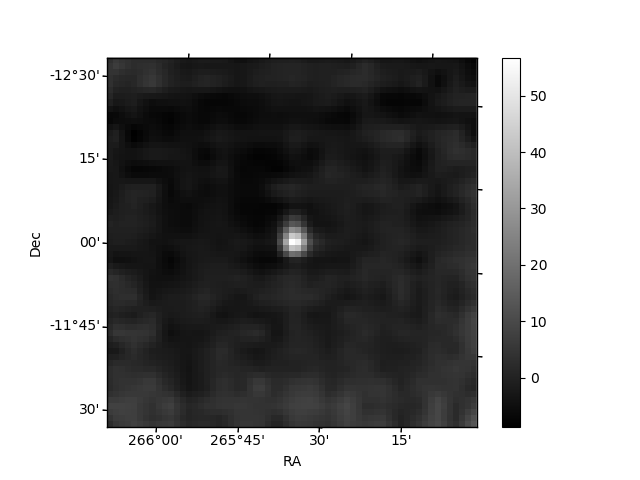
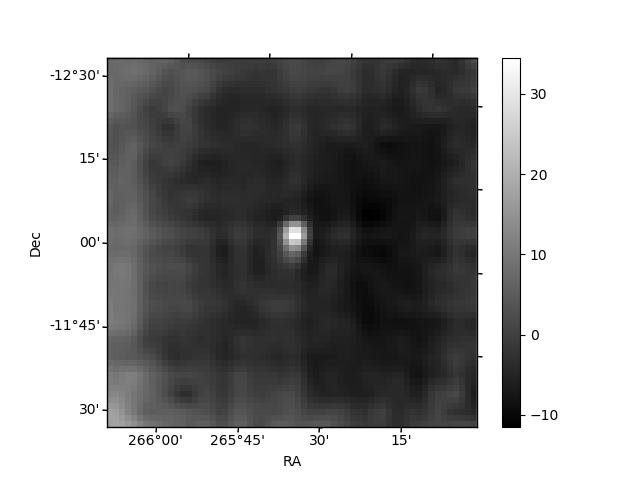
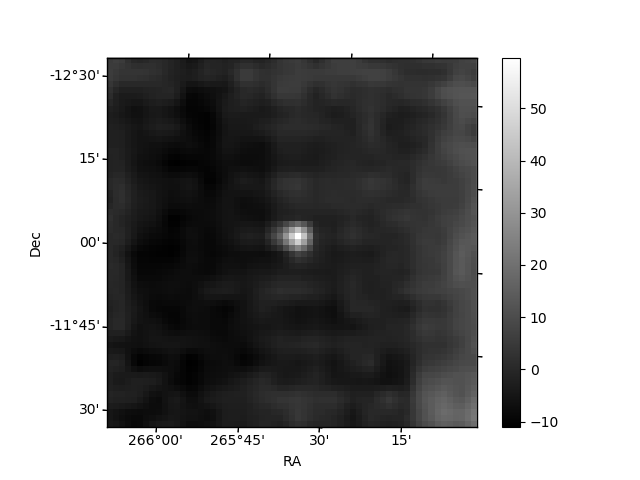
Histogram calculated using DETX and DETY for each event in the final _common_clean file
| Quadrant A | 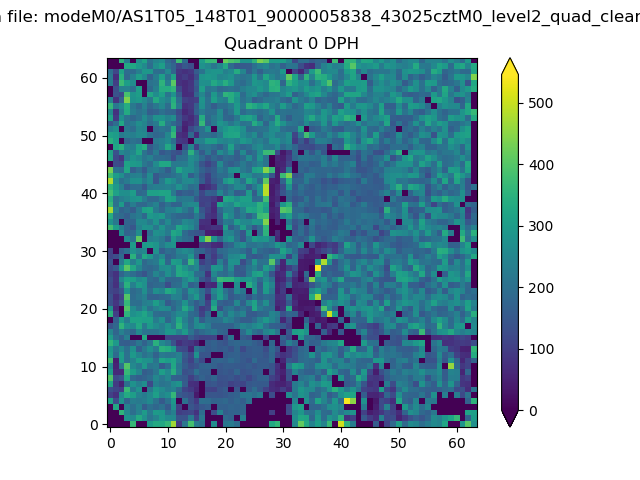 |
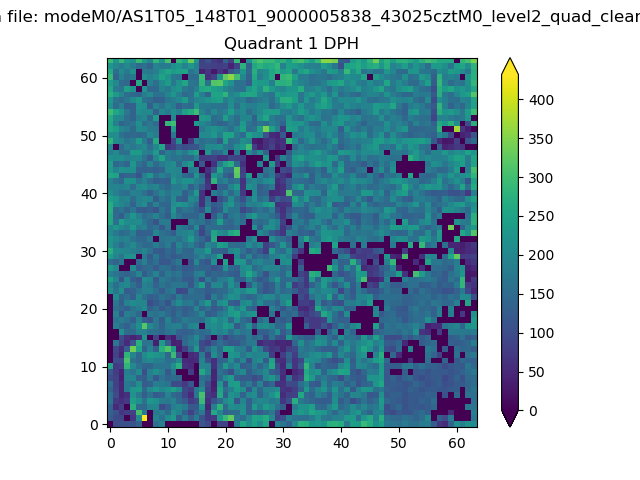 |
Quadrant B |
|---|---|---|---|
| Quadrant D |  |
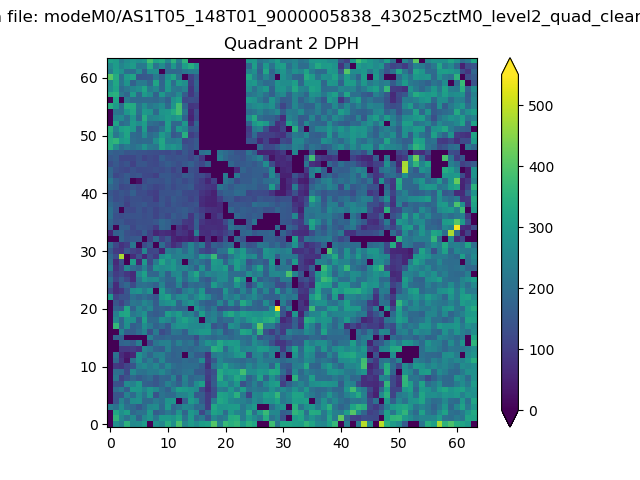 |
Quadrant C |
| Plot type | Count rate plots | Images |
|---|---|---|
| Comparison with Poisson distribution Blue bars denote a histogram of data divided into 1 sec bins. Red curve is a Poisson curve with rate = median count rate of data. |
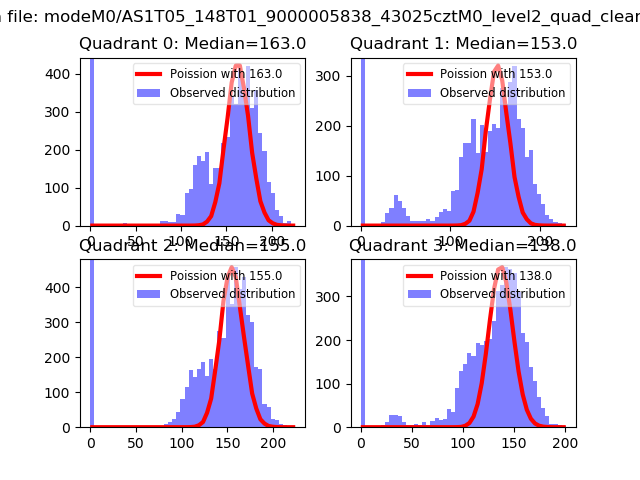 |
 |
| Quadrant-wise count rates Data is divided into 100 sec bins |
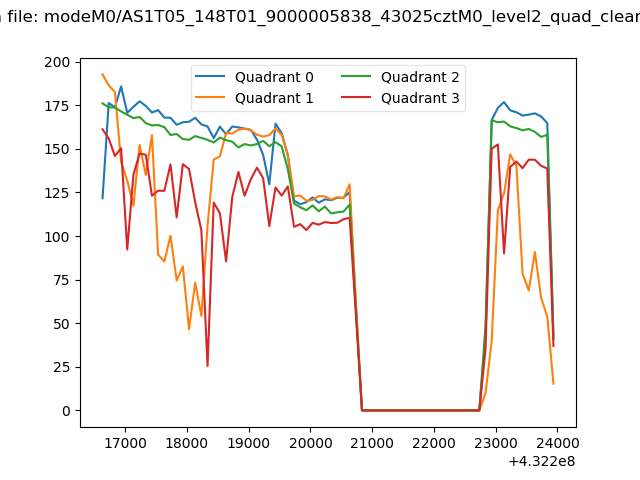 |
|
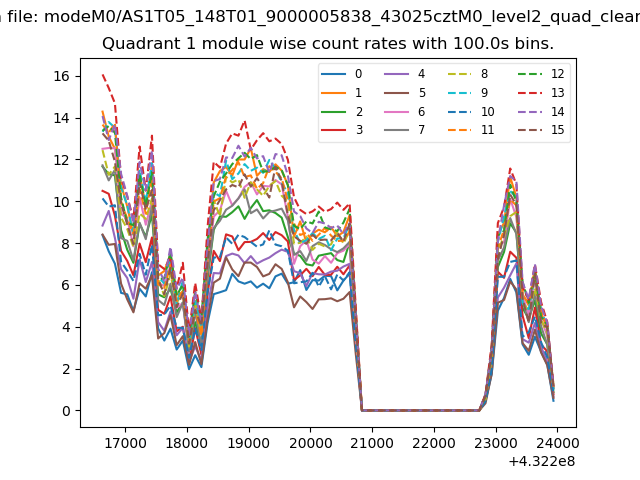
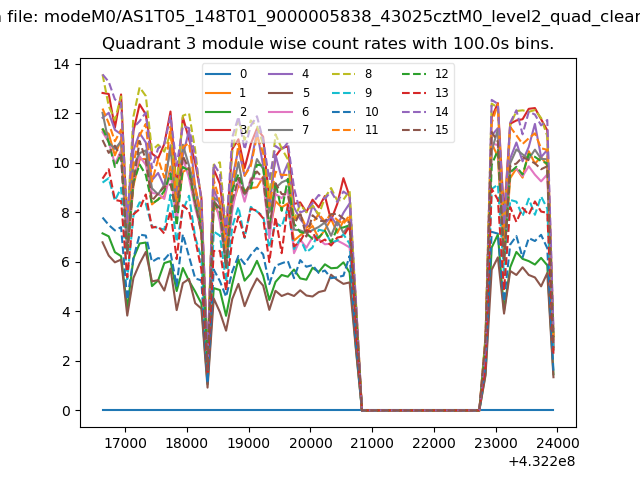
| Module-wise count rates for Quadrant A Data is divided into 100 sec bins |
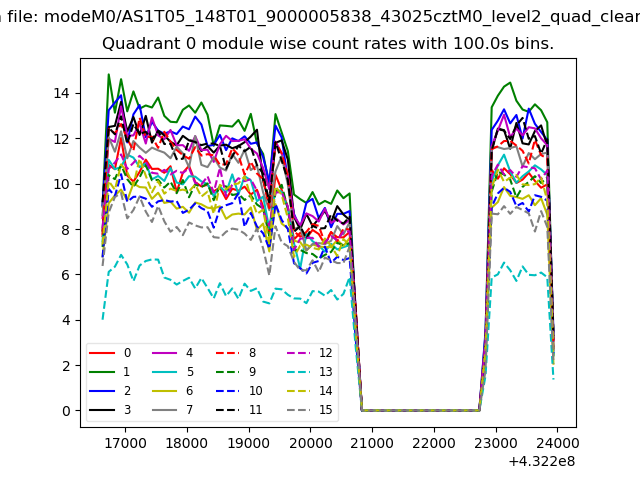 |
 |
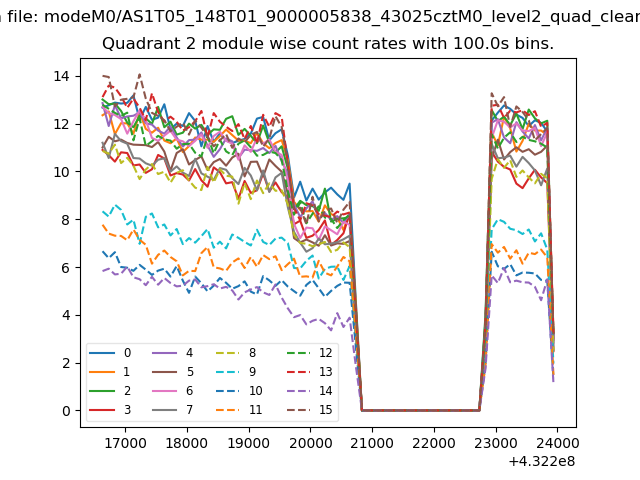
| Module-wise count rates for Quadrant B Data is divided into 100 sec bins |
 |
 |
| Module-wise count rates for Quadrant C Data is divided into 100 sec bins |
 |
 |
| Module-wise count rates for Quadrant D Data is divided into 100 sec bins |
 |
 |
| Parameter | Plot |
|---|---|
| CZT HV Monitor | 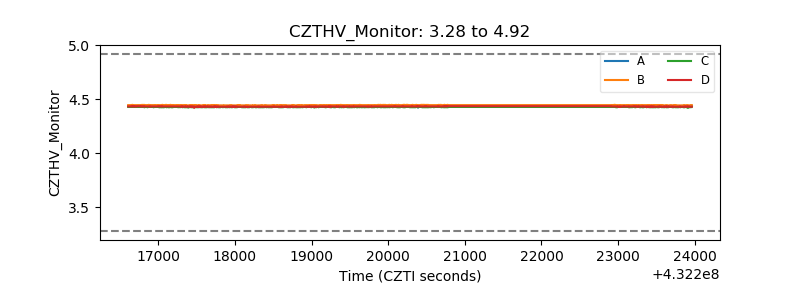 |
| D_VDD | 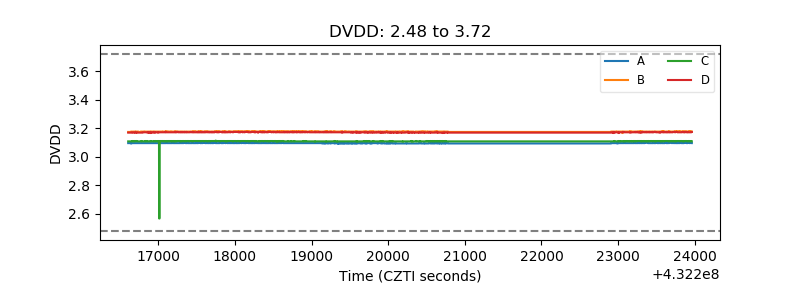 |
| Temperature 1 | 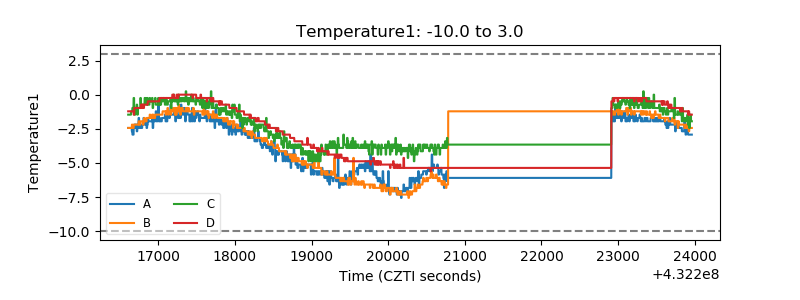 |
| Veto HV Monitor |  |
| Veto LLD | 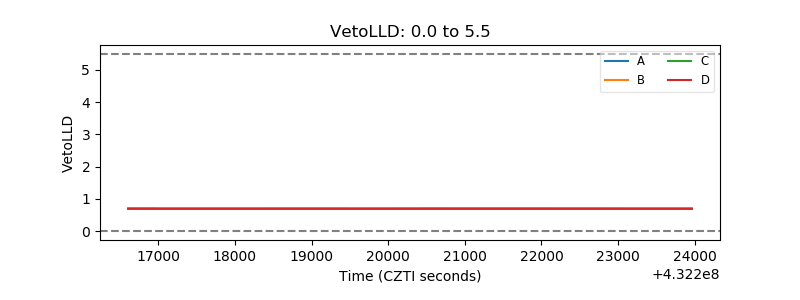 |
| Alpha Counter | 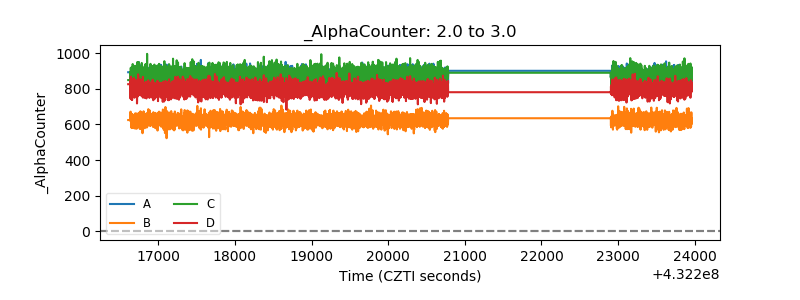 |
| _CPM_Rate | 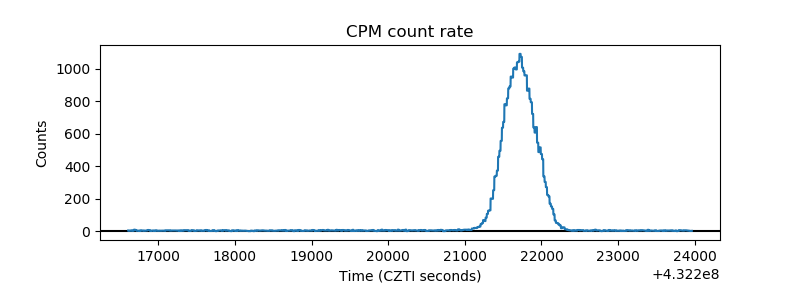 |
| CZT Counter | 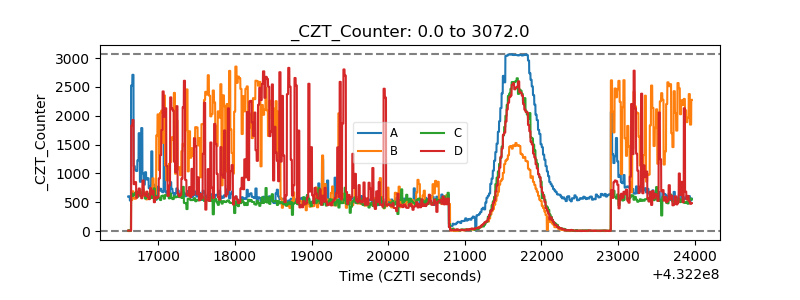 |
| +2.5 Volts monitor | 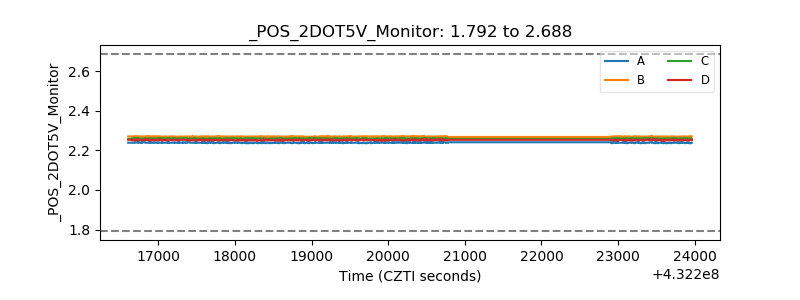 |
| +5 Volts monitor | 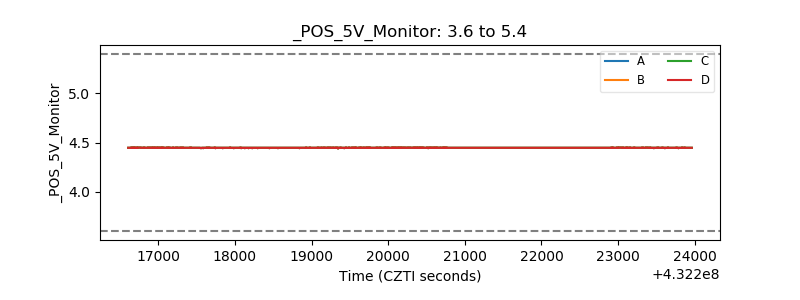 |
| _ROLL_ROT | 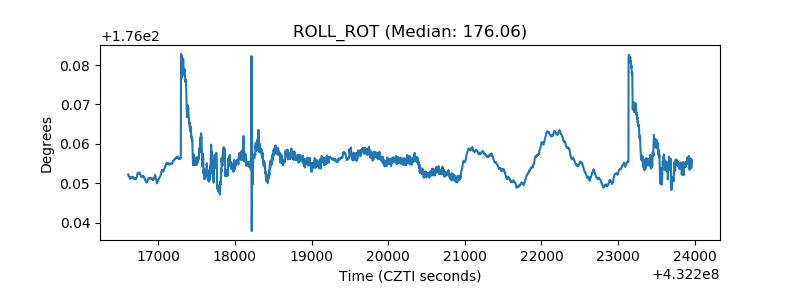 |
| _Roll_DEC | 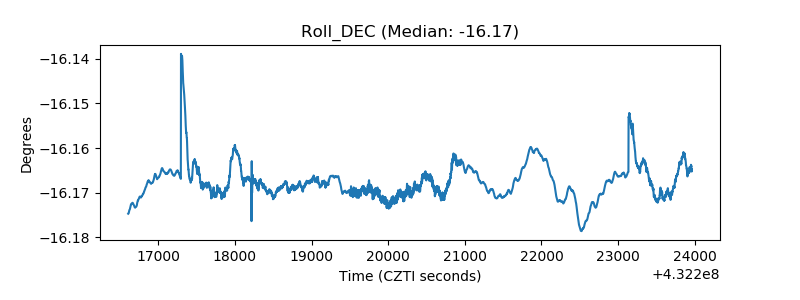 |
| _Roll_RA | 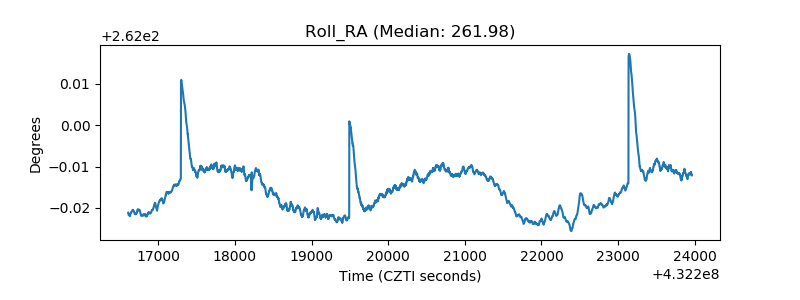 |
| Veto Counter | 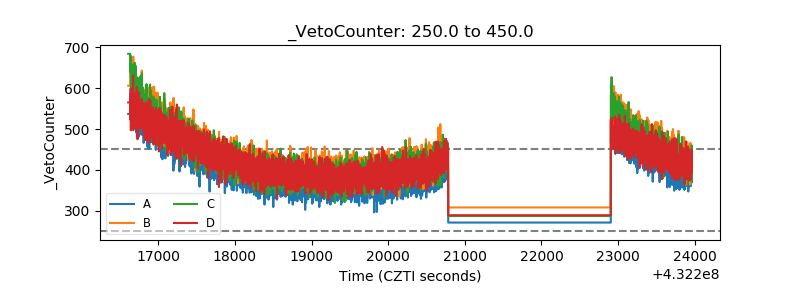 |