| Param | Original file | Final file |
|---|---|---|
| Filename | modeM0/AS1T05_148T01_9000005838_43026cztM0_level2.fits | modeM0/AS1T05_148T01_9000005838_43026cztM0_level2_quad_clean.evt |
| Size (bytes) | 461,119,680 | 99,172,800 |
| Size | 439.8 MB | 94.6 MB |
| Events in quadrant A | 3,090,283 | 755,323 |
| Events in quadrant B | 6,021,641 | 575,021 |
| Events in quadrant C | 2,567,346 | 722,073 |
| Events in quadrant D | 4,996,187 | 595,615 |
| Mode M9 | |||
|---|---|---|---|
| Quadrant | BADHDUFLAG | Total packets | Discarded packets |
| A | 0 | 21 | 0 |
| B | 0 | 21 | 0 |
| C | 0 | 21 | 0 |
| D | 0 | 21 | 0 |
| Mode SS | |||
|---|---|---|---|
| Quadrant | BADHDUFLAG | Total packets | Discarded packets |
| A | 0 | 104 | 0 |
| B | 0 | 104 | 0 |
| C | 0 | 104 | 0 |
| D | 0 | 104 | 0 |
| Mode M0 | |||
|---|---|---|---|
| Quadrant | BADHDUFLAG | Total packets | Discarded packets |
| A | 0 | 12356 | 1 |
| B | 0 | 21264 | 1 |
| C | 0 | 10458 | 1 |
| D | 0 | 18288 | 1 |
| Quadrant | Total seconds | Saturated seconds | Saturation percentage |
|---|---|---|---|
| A | 5066 | 33 | 0.651402% |
| B | 5067 | 1332 | 26.287744% |
| C | 5067 | 2 | 0.039471% |
| D | 5067 | 623 | 12.295244% |
Noise dominated data is calculated using 1-second bins in cleaned event files. If a bin has >2000 counts, and if more than 50% of those come from <1% of pixels, then it is considered to be noise-dominated and hence unusable.
| Quadrant | # 1 sec bins | Bins with >0 counts | Bins with >2000 counts | High rate bins dominated by noise | Noise dominated (total time) | Noise dominated (detector-on time) | Marked lightcurve |
|---|---|---|---|---|---|---|---|
| A | 7218 | 5067 | 23 | 23 | 0.32% | 0.45% | 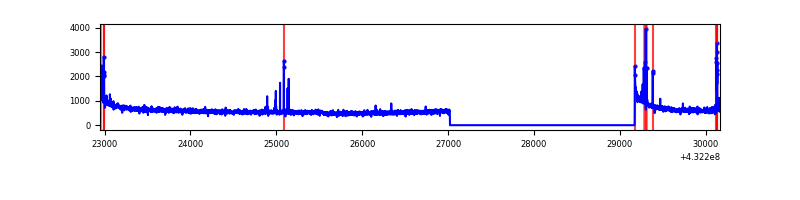 |
| B | 7219 | 5068 | 1097 | 1097 | 15.20% | 21.65% | 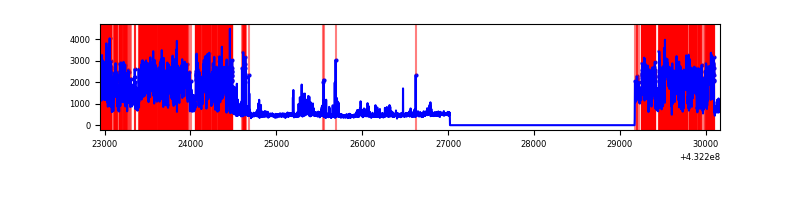 |
| C | 7219 | 5068 | 0 | 0 | 0.00% | 0.00% | 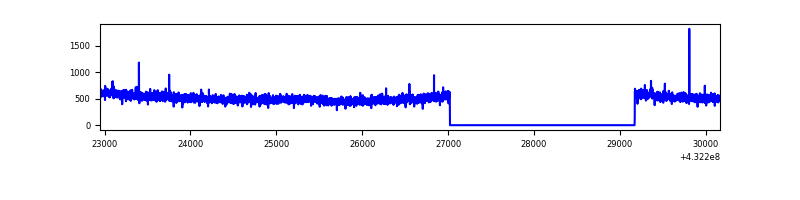 |
| D | 7219 | 5068 | 600 | 600 | 8.31% | 11.84% | 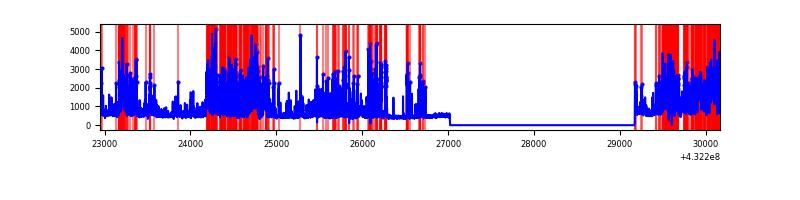 |
Top three noisy pixels from each quadrant. If the there are fewer than three noisy pixels in the level2.evt file, extra rows are filled as -1
| Pixel properties | Quadrant properties | ||||||
|---|---|---|---|---|---|---|---|
| Quadrant | DetID | PixID | Counts | Sigma | Mean | Median | Sigma |
| A | 10 | 83 | 578428 | 4207.63 | 624 | 612 | 137.3 |
| A | 15 | 237 | 92442 | 668.7 | 624 | 612 | 137.3 |
| A | 13 | 6 | 8564 | 57.9 | 624 | 612 | 137.3 |
| B | 0 | 186 | 2700040 | 23445.82 | 566 | 556 | 115.1 |
| B | 5 | 255 | 930319 | 8075.27 | 566 | 556 | 115.1 |
| B | 0 | 189 | 78034 | 672.92 | 566 | 556 | 115.1 |
| C | 15 | 214 | 218461 | 1459.26 | 599 | 605 | 149.3 |
| C | 12 | 249 | 8899 | 55.56 | 599 | 605 | 149.3 |
| C | 13 | 61 | 4004 | 22.77 | 599 | 605 | 149.3 |
| D | 1 | 52 | 1299153 | 8704.3 | 570 | 553 | 149.2 |
| D | 13 | 249 | 486873 | 3259.72 | 570 | 553 | 149.2 |
| D | 10 | 118 | 458774 | 3071.38 | 570 | 553 | 149.2 |
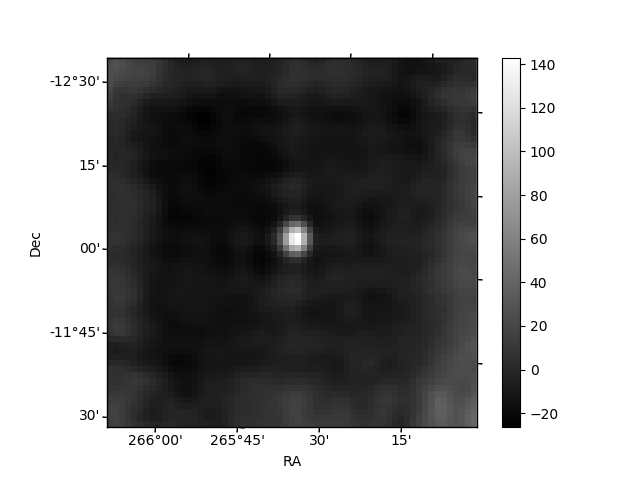
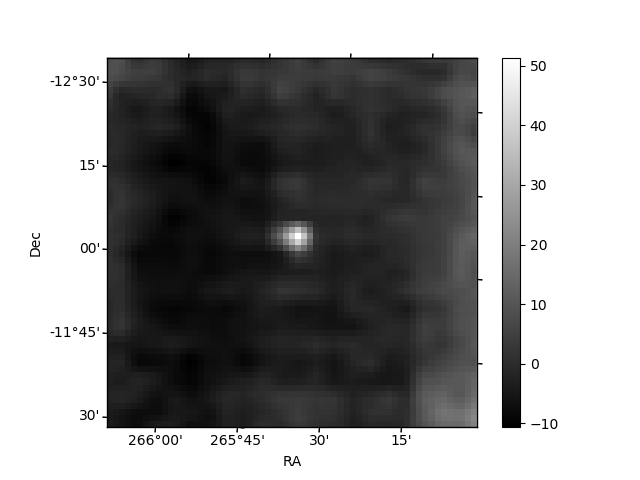
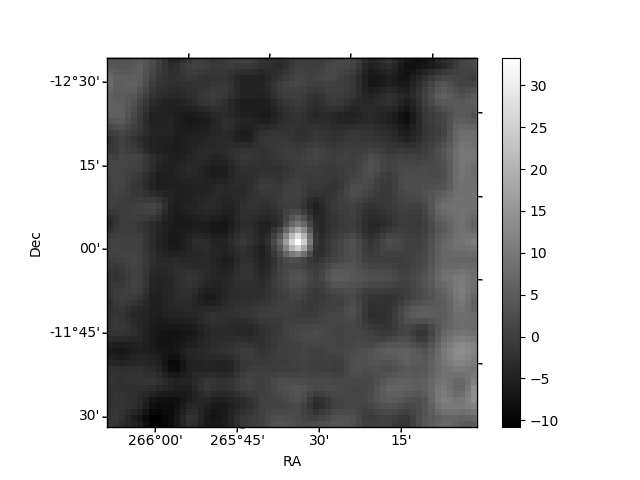
Histogram calculated using DETX and DETY for each event in the final _common_clean file
| Quadrant A | 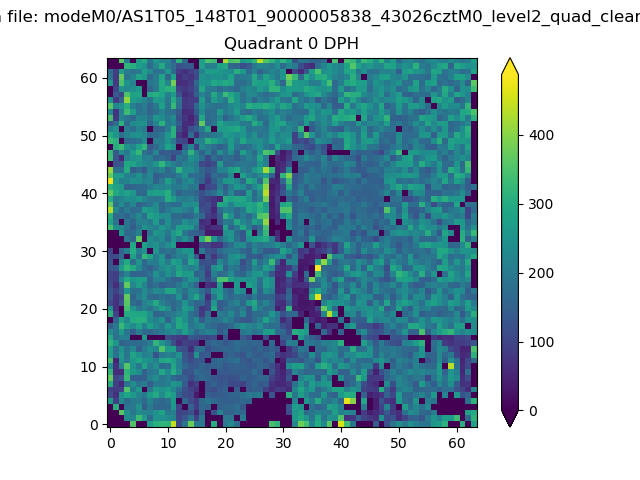 |
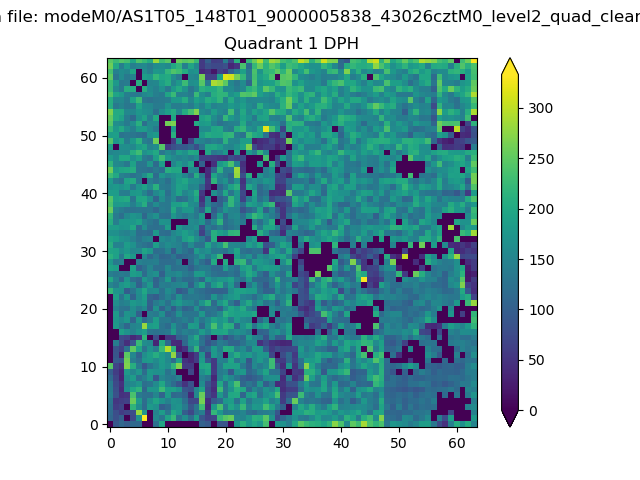 |
Quadrant B |
|---|---|---|---|
| Quadrant D | 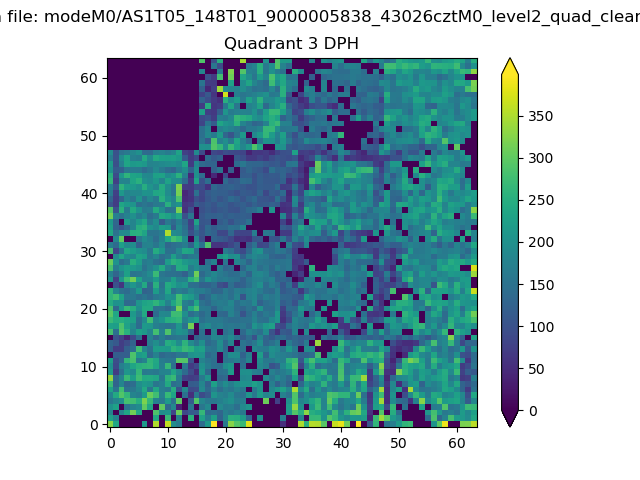 |
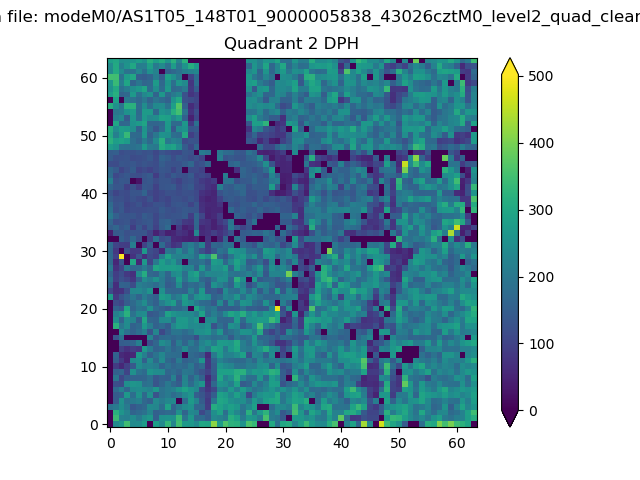 |
Quadrant C |
| Plot type | Count rate plots | Images |
|---|---|---|
| Comparison with Poisson distribution Blue bars denote a histogram of data divided into 1 sec bins. Red curve is a Poisson curve with rate = median count rate of data. |
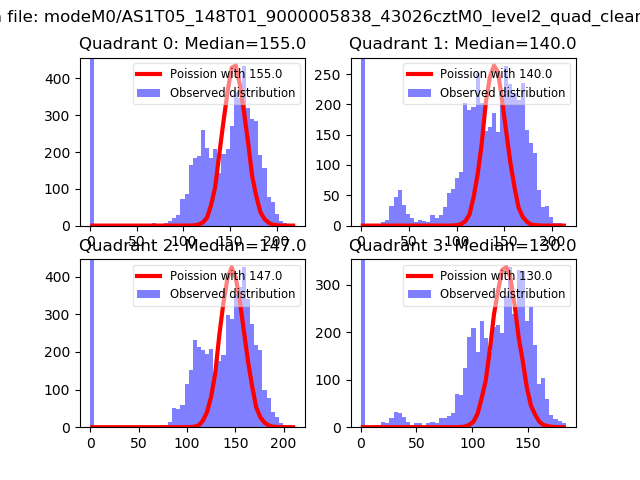 |
 |
| Quadrant-wise count rates Data is divided into 100 sec bins |
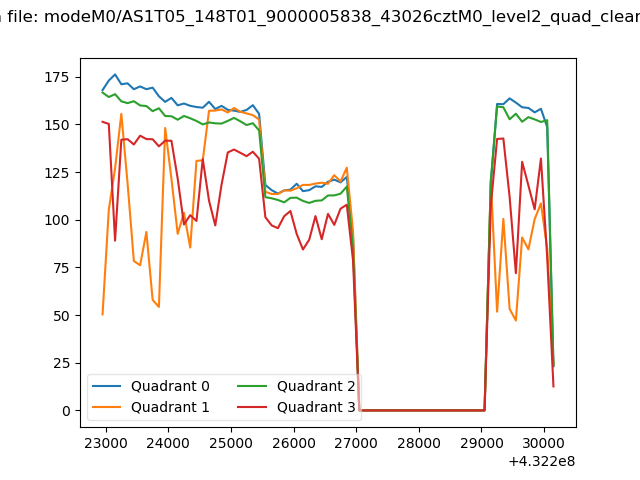 |
|
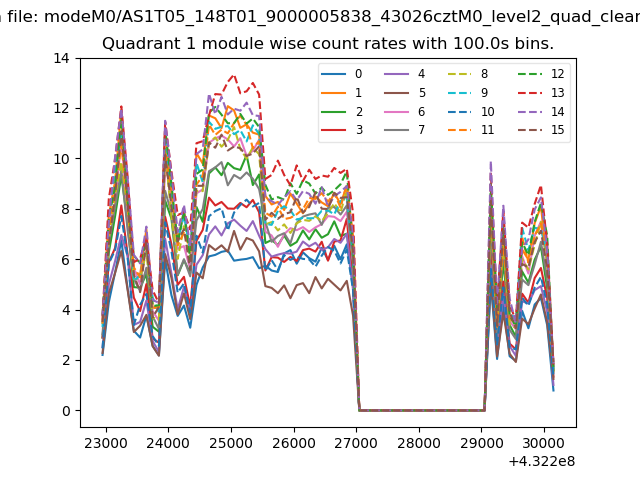
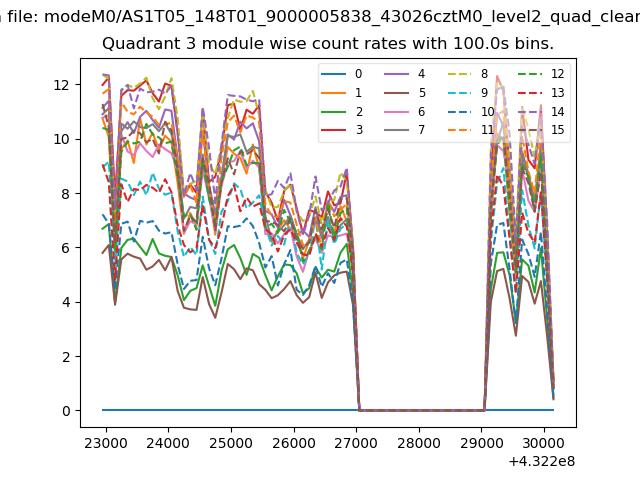
| Module-wise count rates for Quadrant A Data is divided into 100 sec bins |
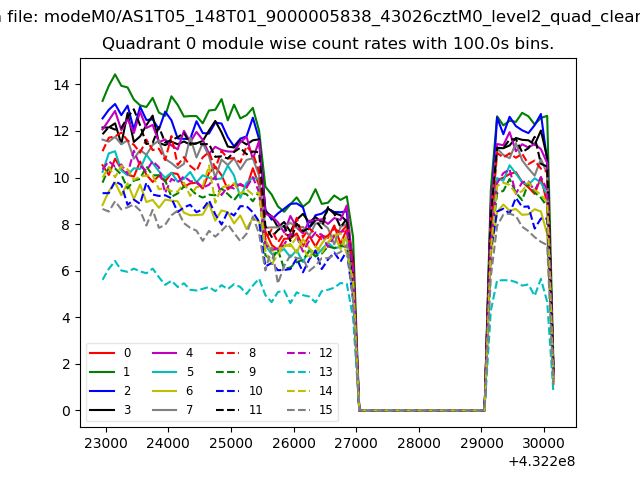 |
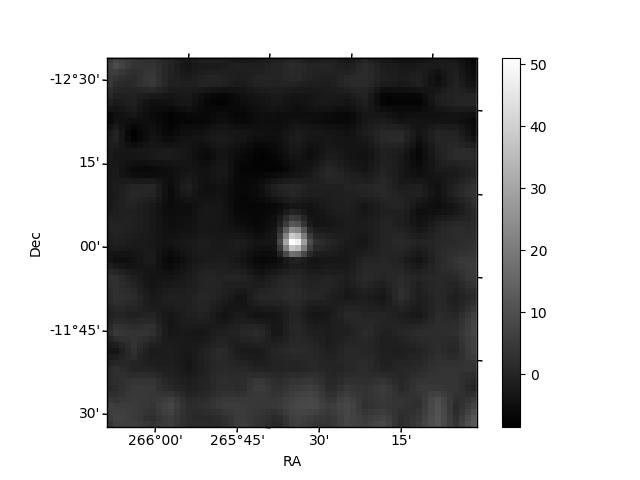 |
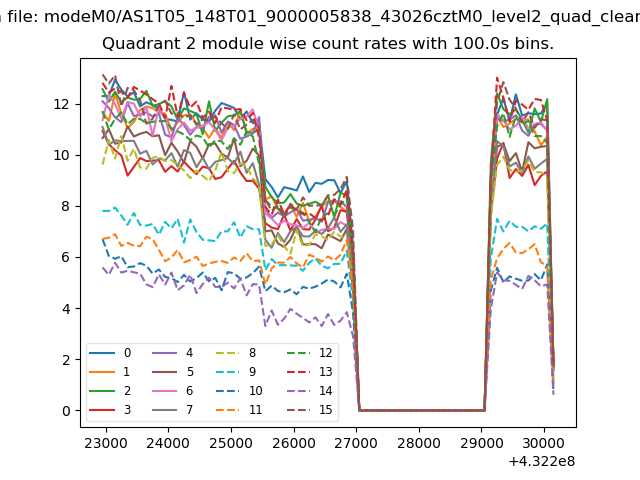
| Module-wise count rates for Quadrant B Data is divided into 100 sec bins |
 |
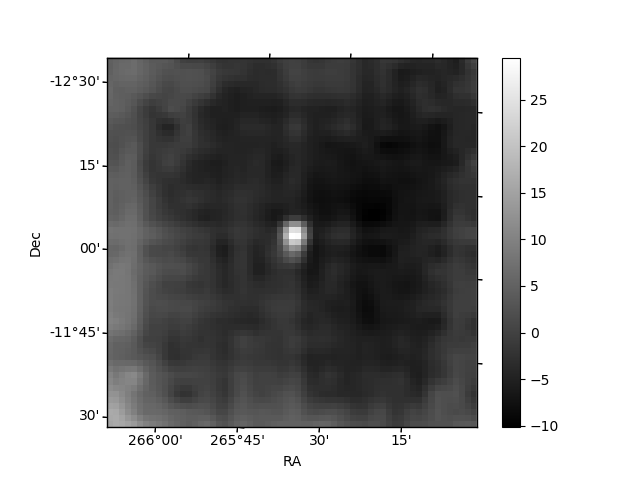 |
| Module-wise count rates for Quadrant C Data is divided into 100 sec bins |
 |
 |
| Module-wise count rates for Quadrant D Data is divided into 100 sec bins |
 |
 |
| Parameter | Plot |
|---|---|
| CZT HV Monitor | 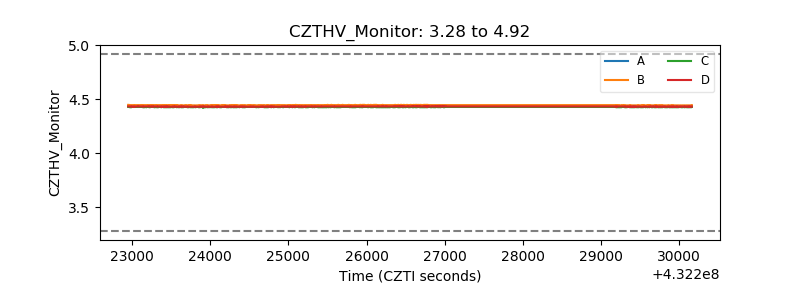 |
| D_VDD | 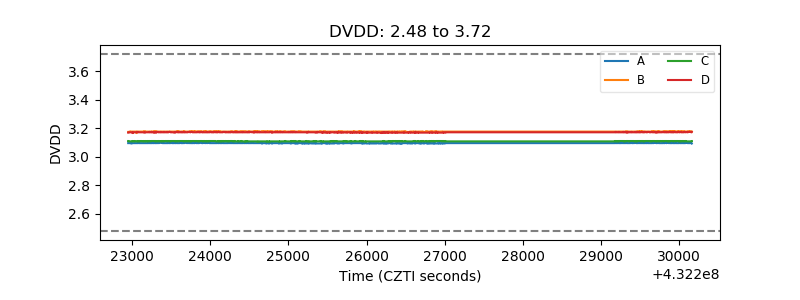 |
| Temperature 1 | 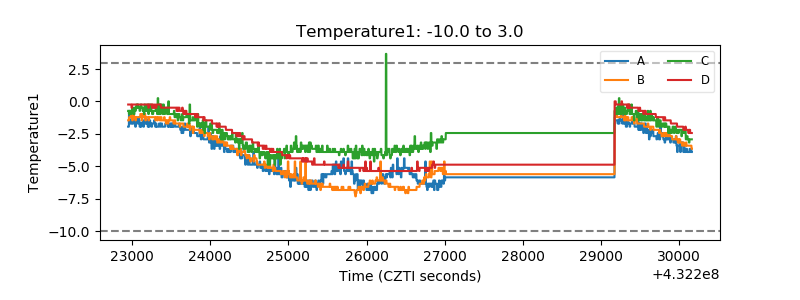 |
| Veto HV Monitor |  |
| Veto LLD | 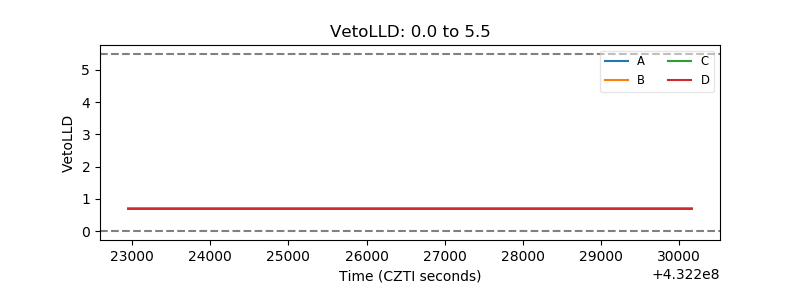 |
| Alpha Counter | 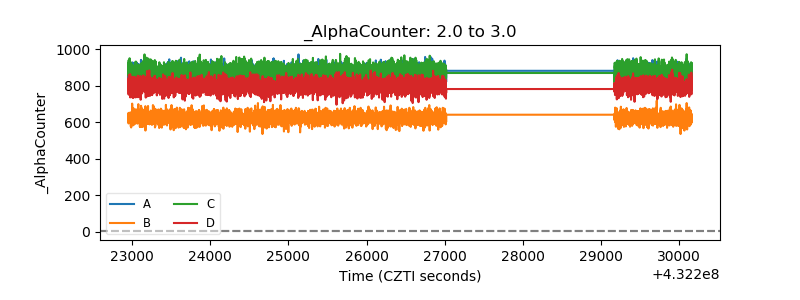 |
| _CPM_Rate | 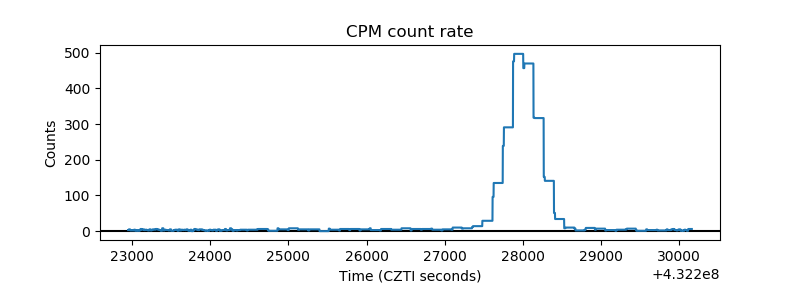 |
| CZT Counter | 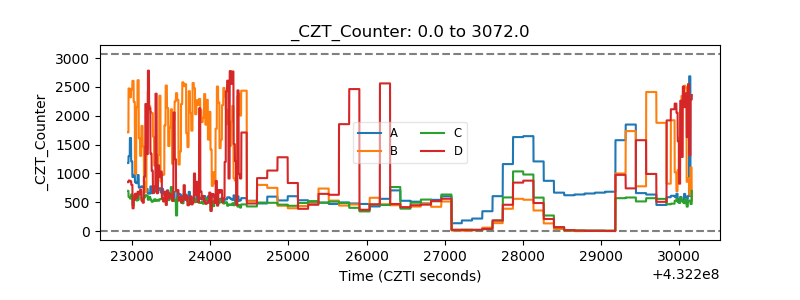 |
| +2.5 Volts monitor | 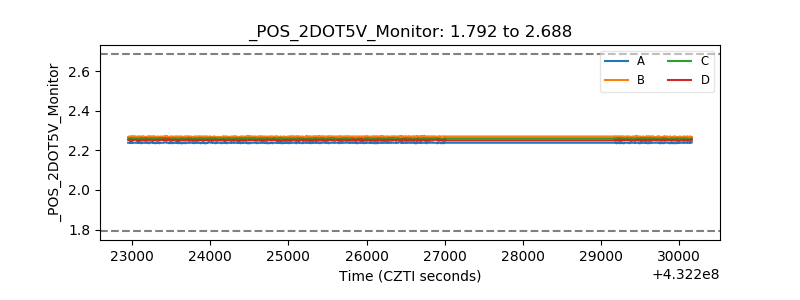 |
| +5 Volts monitor | 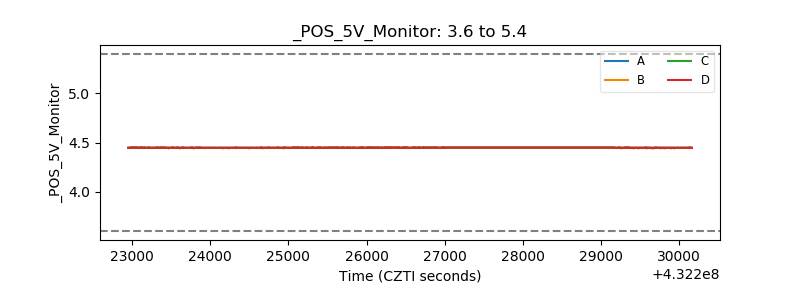 |
| _ROLL_ROT | 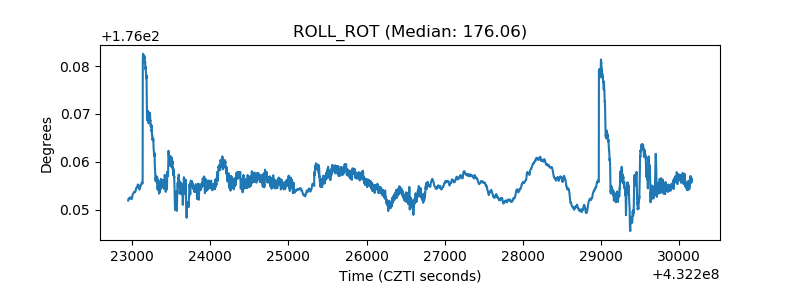 |
| _Roll_DEC | 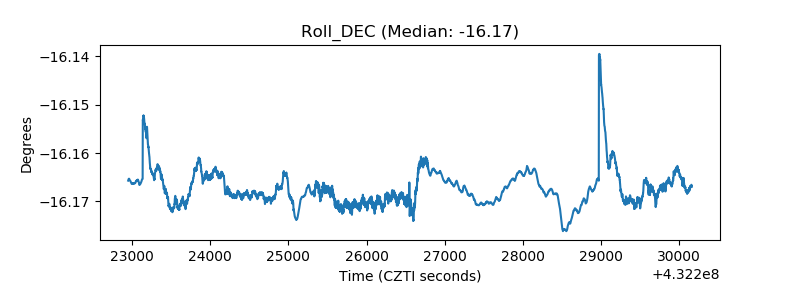 |
| _Roll_RA | 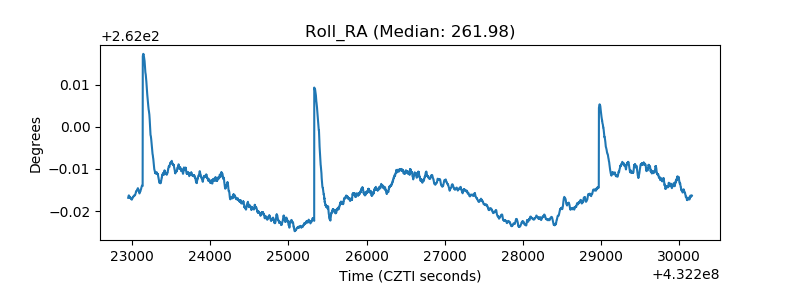 |
| Veto Counter | 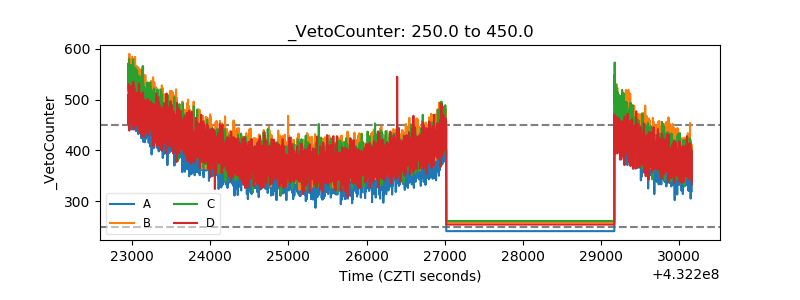 |