| Param | Original file | Final file |
|---|---|---|
| Filename | modeM0/AS1T05_148T01_9000005838_43028cztM0_level2.fits | modeM0/AS1T05_148T01_9000005838_43028cztM0_level2_quad_clean.evt |
| Size (bytes) | 391,979,520 | 98,130,240 |
| Size | 373.8 MB | 93.6 MB |
| Events in quadrant A | 3,073,762 | 703,432 |
| Events in quadrant B | 4,325,747 | 654,948 |
| Events in quadrant C | 2,569,626 | 679,525 |
| Events in quadrant D | 4,132,406 | 566,321 |
| Mode M9 | |||
|---|---|---|---|
| Quadrant | BADHDUFLAG | Total packets | Discarded packets |
| A | 0 | 20 | 0 |
| B | 0 | 21 | 0 |
| C | 0 | 21 | 0 |
| D | 0 | 21 | 0 |
| Mode SS | |||
|---|---|---|---|
| Quadrant | BADHDUFLAG | Total packets | Discarded packets |
| A | 0 | 106 | 0 |
| B | 0 | 106 | 0 |
| C | 0 | 106 | 0 |
| D | 0 | 106 | 0 |
| Mode M0 | |||
|---|---|---|---|
| Quadrant | BADHDUFLAG | Total packets | Discarded packets |
| A | 0 | 12484 | 2 |
| B | 0 | 16305 | 2 |
| C | 0 | 10789 | 2 |
| D | 0 | 15901 | 3 |
| Quadrant | Total seconds | Saturated seconds | Saturation percentage |
|---|---|---|---|
| A | 5246 | 23 | 0.438429% |
| B | 5246 | 485 | 9.245139% |
| C | 5246 | 2 | 0.038124% |
| D | 5245 | 498 | 9.494757% |
Noise dominated data is calculated using 1-second bins in cleaned event files. If a bin has >2000 counts, and if more than 50% of those come from <1% of pixels, then it is considered to be noise-dominated and hence unusable.
| Quadrant | # 1 sec bins | Bins with >0 counts | Bins with >2000 counts | High rate bins dominated by noise | Noise dominated (total time) | Noise dominated (detector-on time) | Marked lightcurve |
|---|---|---|---|---|---|---|---|
| A | 7038 | 5247 | 17 | 17 | 0.24% | 0.32% | 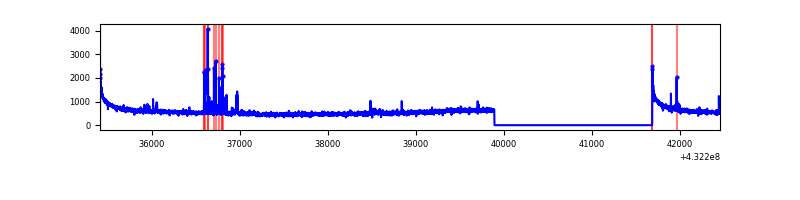 |
| B | 7038 | 5247 | 433 | 433 | 6.15% | 8.25% | 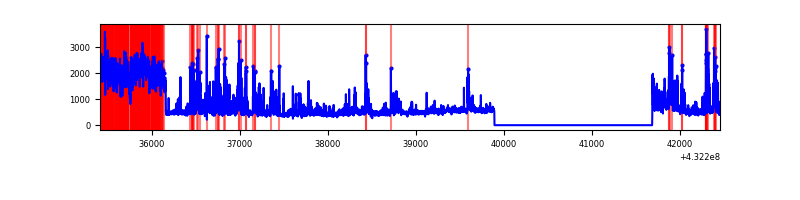 |
| C | 7038 | 5247 | 0 | 0 | 0.00% | 0.00% | 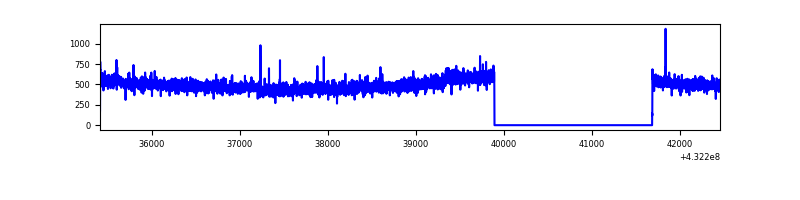 |
| D | 7037 | 5245 | 425 | 425 | 6.04% | 8.10% | 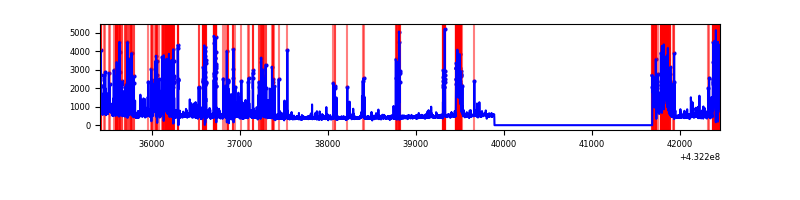 |
Top three noisy pixels from each quadrant. If the there are fewer than three noisy pixels in the level2.evt file, extra rows are filled as -1
| Pixel properties | Quadrant properties | ||||||
|---|---|---|---|---|---|---|---|
| Quadrant | DetID | PixID | Counts | Sigma | Mean | Median | Sigma |
| A | 10 | 83 | 596160 | 4474.08 | 613 | 603 | 133.1 |
| A | 15 | 237 | 96389 | 719.59 | 613 | 603 | 133.1 |
| A | 15 | 254 | 7943 | 55.14 | 613 | 603 | 133.1 |
| B | 0 | 186 | 1173304 | 9563.67 | 599 | 586 | 122.6 |
| B | 5 | 255 | 659792 | 5375.91 | 599 | 586 | 122.6 |
| B | 4 | 171 | 57127 | 461.1 | 599 | 586 | 122.6 |
| C | 15 | 214 | 231396 | 1573.41 | 597 | 605 | 146.7 |
| C | 15 | 159 | 4550 | 26.89 | 597 | 605 | 146.7 |
| C | 13 | 61 | 3959 | 22.87 | 597 | 605 | 146.7 |
| D | 1 | 52 | 887617 | 6201.49 | 557 | 542 | 143.0 |
| D | 13 | 249 | 642005 | 4484.43 | 557 | 542 | 143.0 |
| D | 10 | 118 | 242225 | 1689.59 | 557 | 542 | 143.0 |
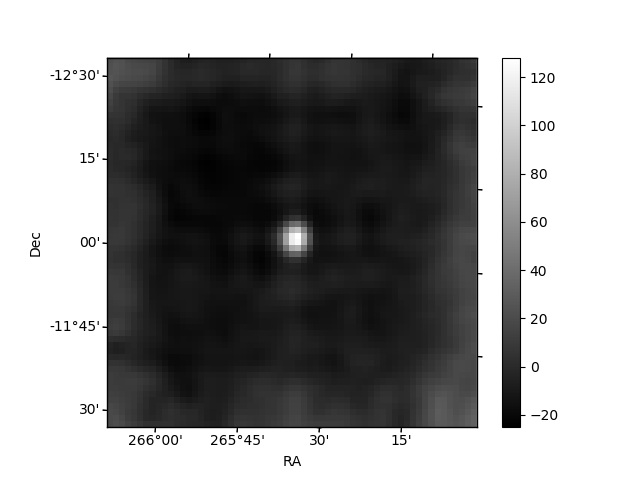
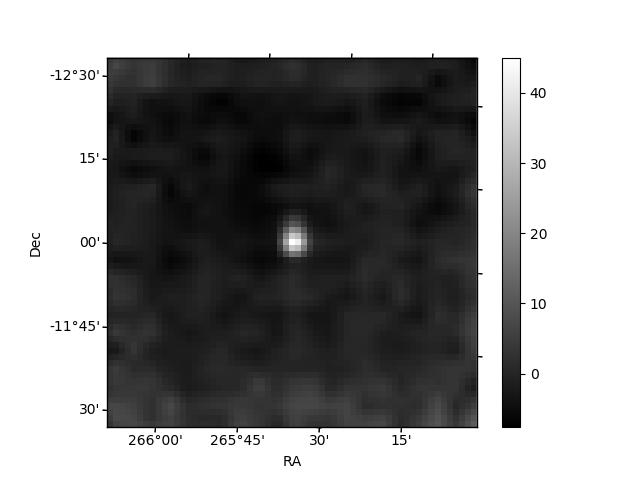
Histogram calculated using DETX and DETY for each event in the final _common_clean file
| Quadrant A | 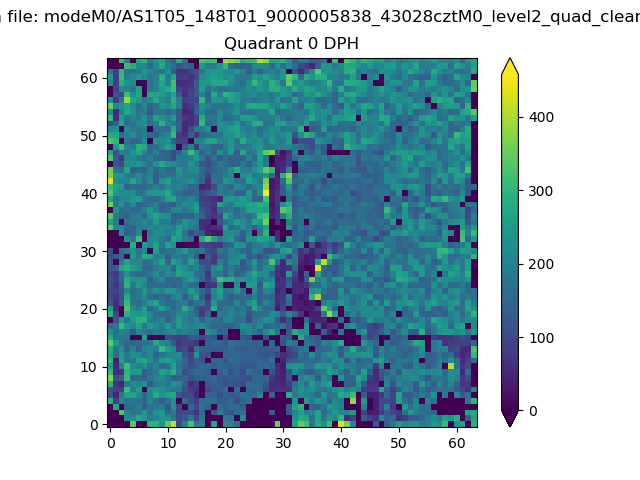 |
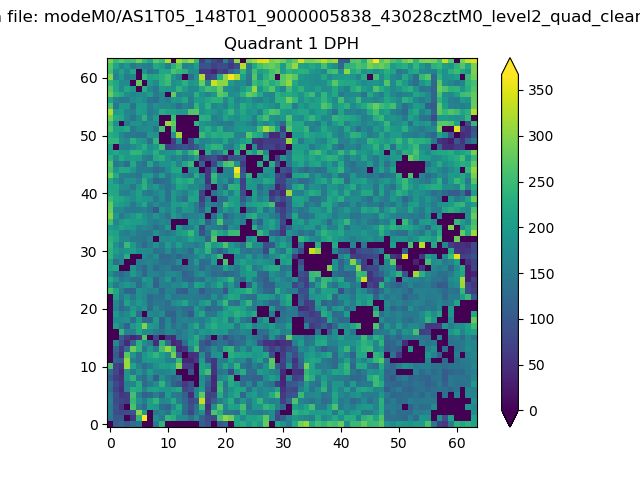 |
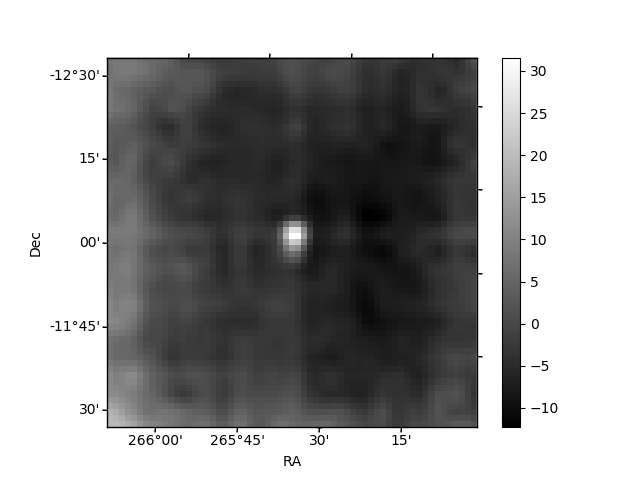
Quadrant B |
|---|---|---|---|
| Quadrant D | 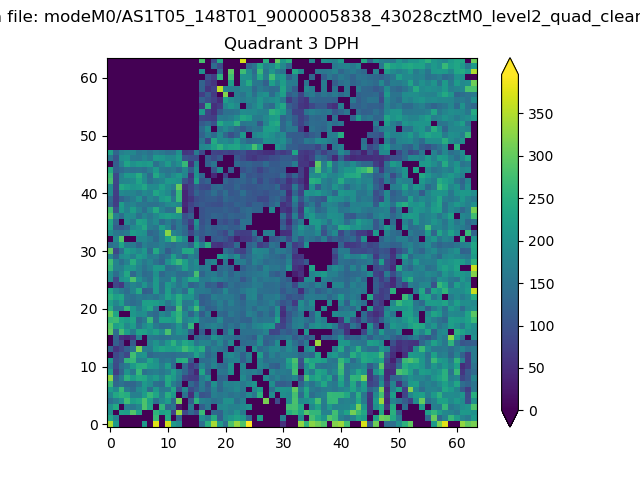 |
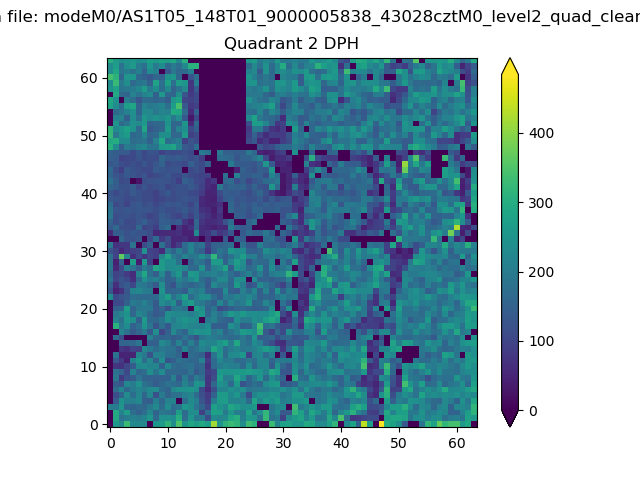 |
Quadrant C |
| Plot type | Count rate plots | Images |
|---|---|---|
| Comparison with Poisson distribution Blue bars denote a histogram of data divided into 1 sec bins. Red curve is a Poisson curve with rate = median count rate of data. |
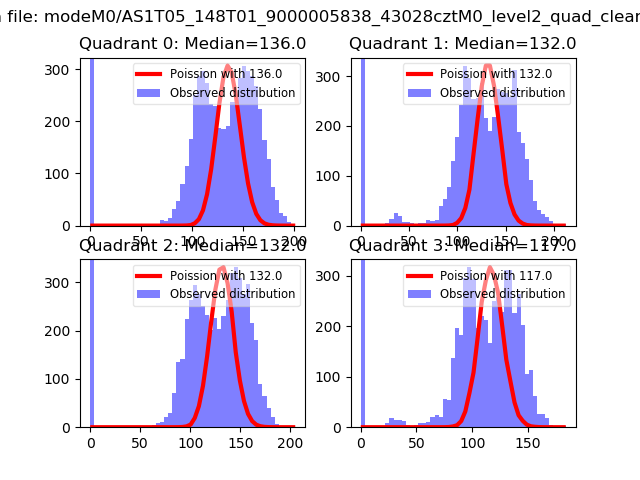 |
 |
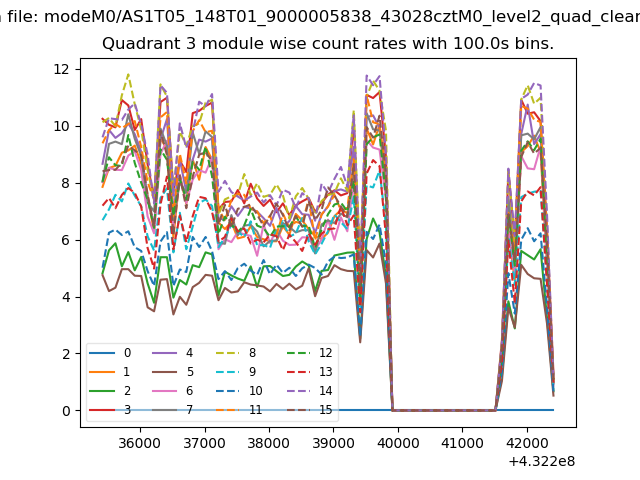
| Quadrant-wise count rates Data is divided into 100 sec bins |
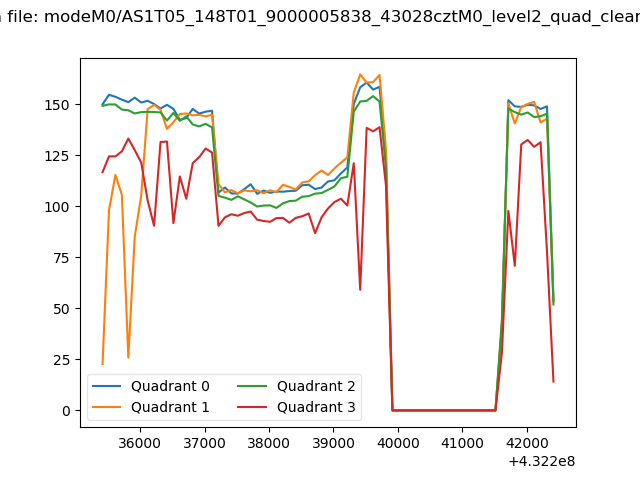 |
|
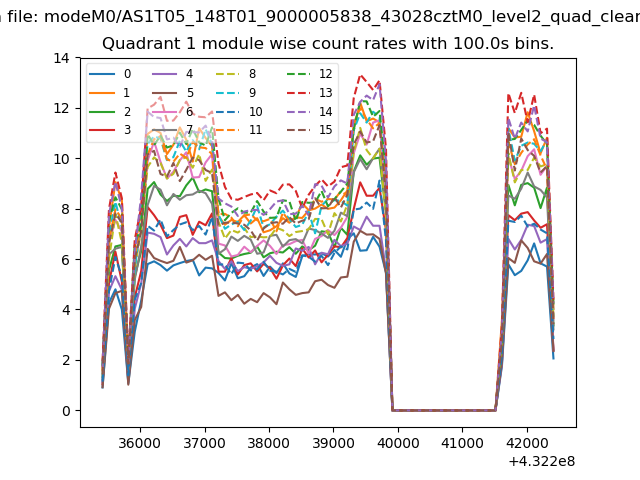
| Module-wise count rates for Quadrant A Data is divided into 100 sec bins |
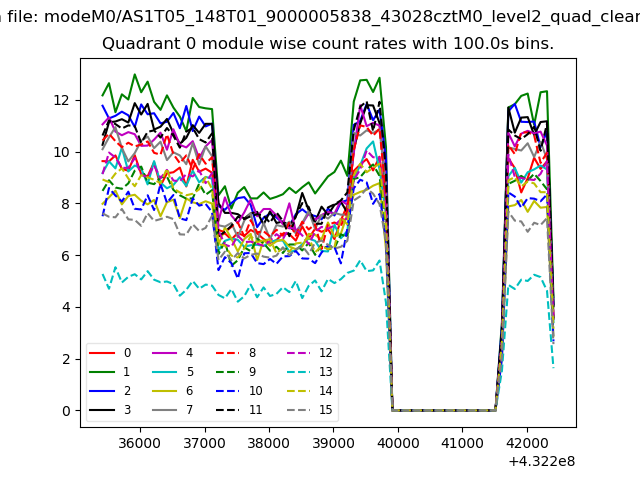 |
 |
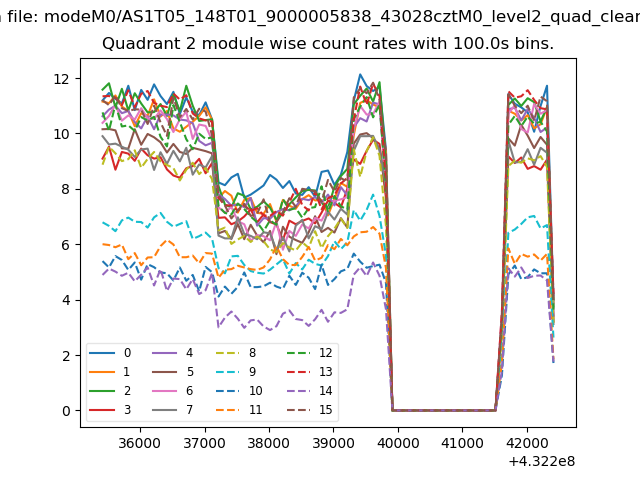
| Module-wise count rates for Quadrant B Data is divided into 100 sec bins |
 |
 |
| Module-wise count rates for Quadrant C Data is divided into 100 sec bins |
 |
 |
| Module-wise count rates for Quadrant D Data is divided into 100 sec bins |
 |
 |
| Parameter | Plot |
|---|---|
| CZT HV Monitor | 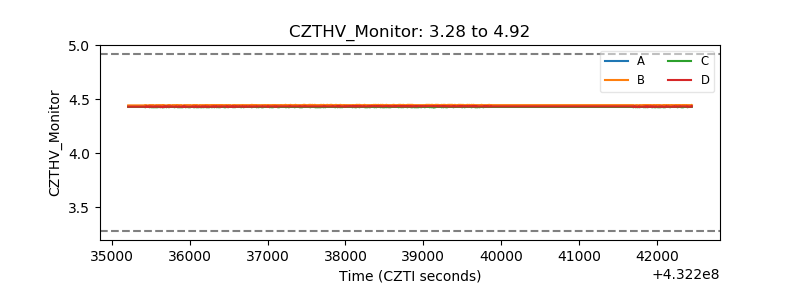 |
| D_VDD | 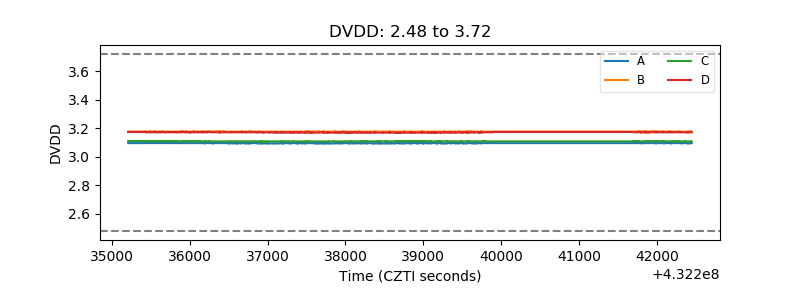 |
| Temperature 1 | 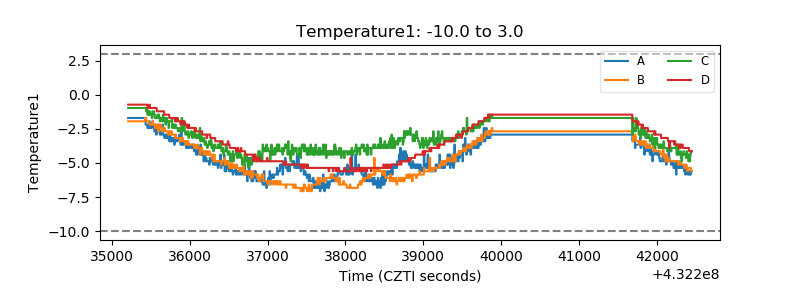 |
| Veto HV Monitor | 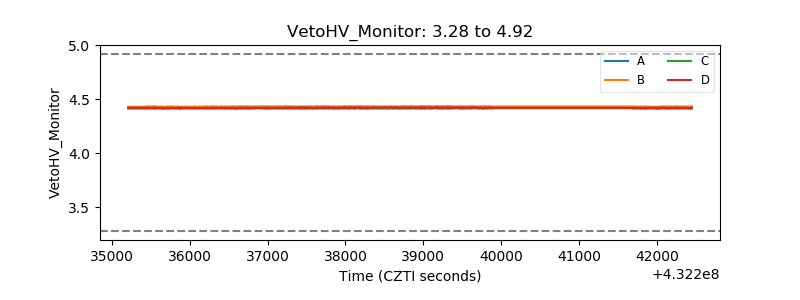 |
| Veto LLD | 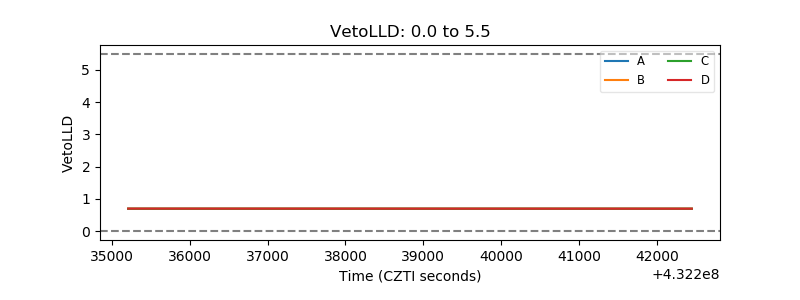 |
| Alpha Counter | 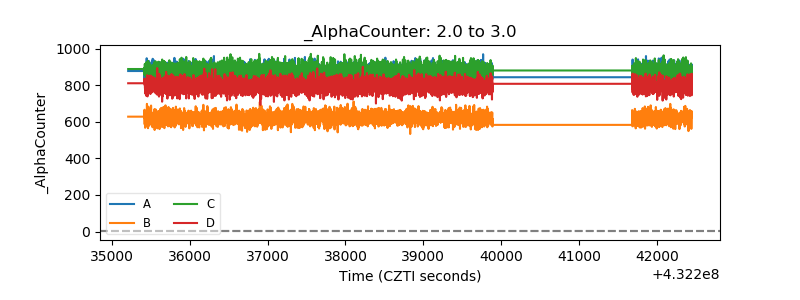 |
| _CPM_Rate | 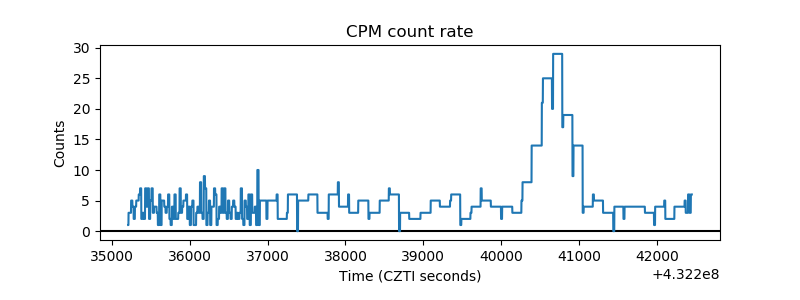 |
| CZT Counter | 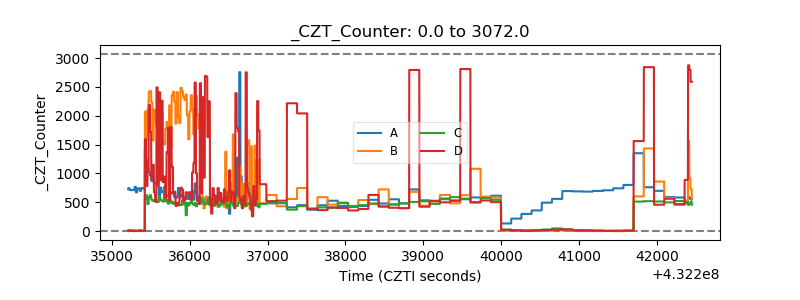 |
| +2.5 Volts monitor | 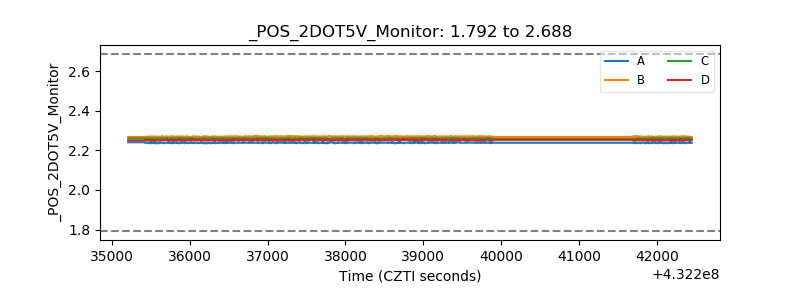 |
| +5 Volts monitor | 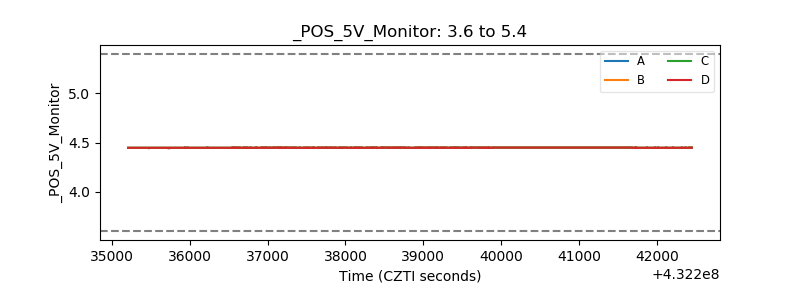 |
| _ROLL_ROT | 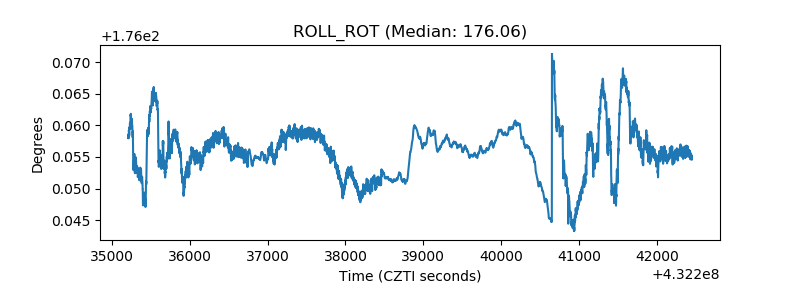 |
| _Roll_DEC | 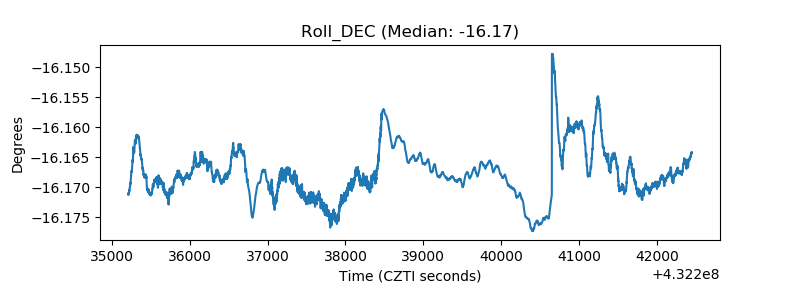 |
| _Roll_RA | 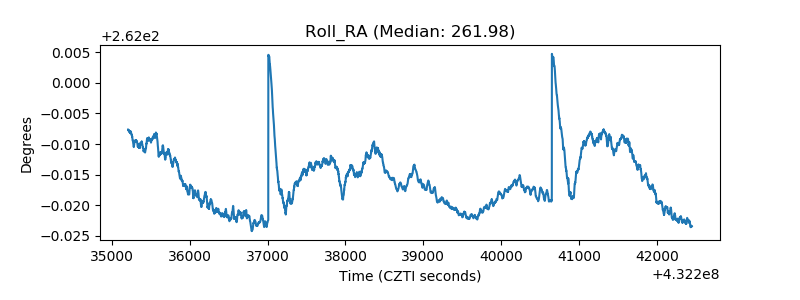 |
| Veto Counter | 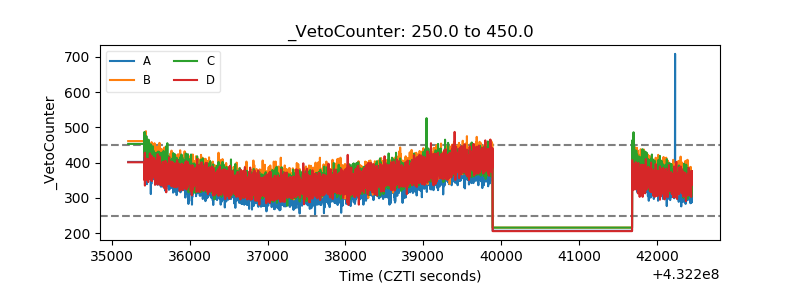 |