| Param | Original file | Final file |
|---|---|---|
| Filename | modeM0/AS1T05_148T01_9000005838_43029cztM0_level2.fits | modeM0/AS1T05_148T01_9000005838_43029cztM0_level2_quad_clean.evt |
| Size (bytes) | 384,217,920 | 105,405,120 |
| Size | 366.4 MB | 100.5 MB |
| Events in quadrant A | 3,277,929 | 747,188 |
| Events in quadrant B | 4,073,045 | 701,198 |
| Events in quadrant C | 2,754,730 | 721,266 |
| Events in quadrant D | 3,681,926 | 631,287 |
| Mode M9 | |||
|---|---|---|---|
| Quadrant | BADHDUFLAG | Total packets | Discarded packets |
| A | 0 | 24 | 0 |
| B | 0 | 25 | 0 |
| C | 0 | 25 | 0 |
| D | 0 | 25 | 0 |
| Mode SS | |||
|---|---|---|---|
| Quadrant | BADHDUFLAG | Total packets | Discarded packets |
| A | 0 | 114 | 0 |
| B | 0 | 114 | 0 |
| C | 0 | 114 | 0 |
| D | 0 | 114 | 0 |
| Mode M0 | |||
|---|---|---|---|
| Quadrant | BADHDUFLAG | Total packets | Discarded packets |
| A | 0 | 13424 | 2 |
| B | 0 | 15863 | 2 |
| C | 0 | 11603 | 2 |
| D | 0 | 14880 | 2 |
| Quadrant | Total seconds | Saturated seconds | Saturation percentage |
|---|---|---|---|
| A | 5589 | 36 | 0.644122% |
| B | 5589 | 400 | 7.156915% |
| C | 5589 | 5 | 0.089461% |
| D | 5589 | 271 | 4.848810% |
Noise dominated data is calculated using 1-second bins in cleaned event files. If a bin has >2000 counts, and if more than 50% of those come from <1% of pixels, then it is considered to be noise-dominated and hence unusable.
| Quadrant | # 1 sec bins | Bins with >0 counts | Bins with >2000 counts | High rate bins dominated by noise | Noise dominated (total time) | Noise dominated (detector-on time) | Marked lightcurve |
|---|---|---|---|---|---|---|---|
| A | 7053 | 5590 | 20 | 20 | 0.28% | 0.36% | 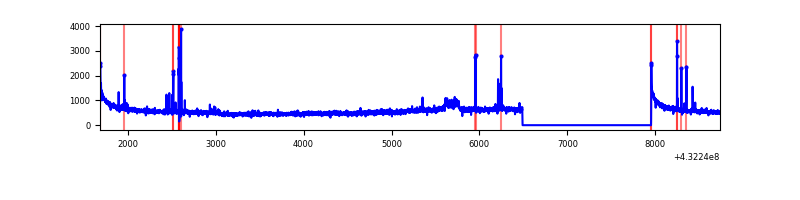 |
| B | 7053 | 5590 | 292 | 292 | 4.14% | 5.22% | 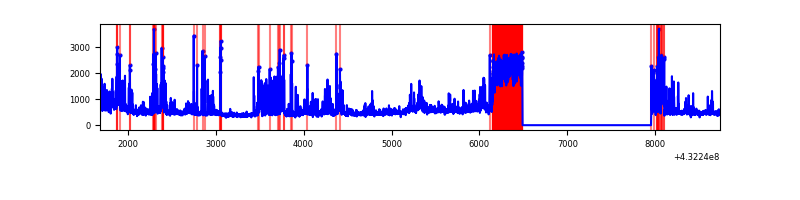 |
| C | 7053 | 5590 | 0 | 0 | 0.00% | 0.00% | 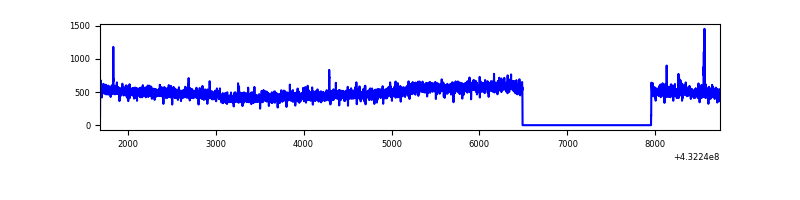 |
| D | 7053 | 5590 | 239 | 239 | 3.39% | 4.28% | 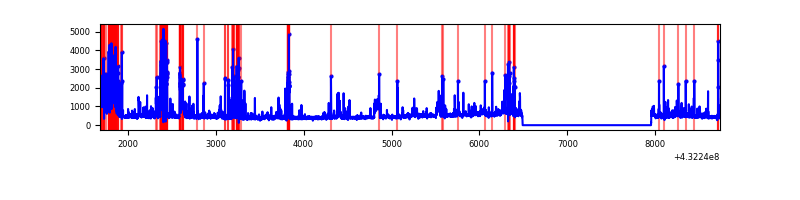 |
Top three noisy pixels from each quadrant. If the there are fewer than three noisy pixels in the level2.evt file, extra rows are filled as -1
| Pixel properties | Quadrant properties | ||||||
|---|---|---|---|---|---|---|---|
| Quadrant | DetID | PixID | Counts | Sigma | Mean | Median | Sigma |
| A | 10 | 83 | 600310 | 4208.58 | 656 | 647 | 142.5 |
| A | 15 | 237 | 137748 | 962.21 | 656 | 647 | 142.5 |
| A | 13 | 6 | 7882 | 50.78 | 656 | 647 | 142.5 |
| B | 5 | 255 | 689804 | 5316.61 | 639 | 625 | 129.6 |
| B | 0 | 186 | 687154 | 5296.16 | 639 | 625 | 129.6 |
| B | 4 | 171 | 69363 | 530.27 | 639 | 625 | 129.6 |
| C | 15 | 214 | 246274 | 1562.86 | 639 | 647 | 157.2 |
| C | 15 | 159 | 12617 | 76.16 | 639 | 647 | 157.2 |
| C | 13 | 61 | 4153 | 22.31 | 639 | 647 | 157.2 |
| D | 13 | 249 | 582007 | 3666.34 | 618 | 601 | 158.6 |
| D | 1 | 52 | 399296 | 2514.17 | 618 | 601 | 158.6 |
| D | 10 | 118 | 130722 | 820.54 | 618 | 601 | 158.6 |
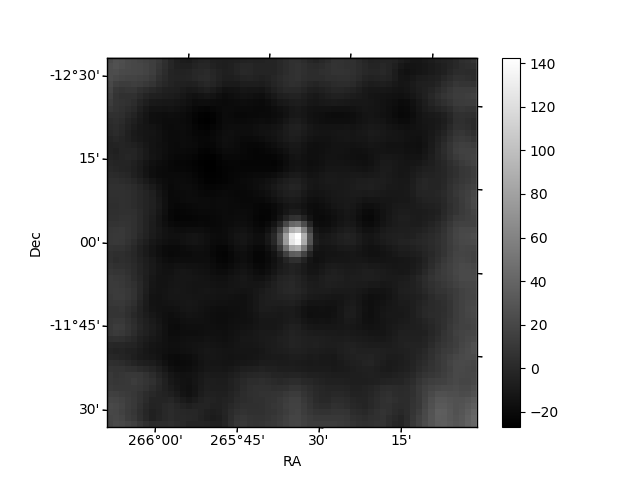
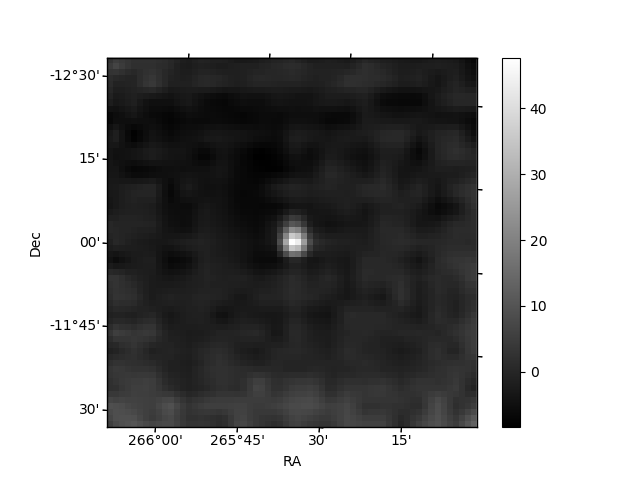
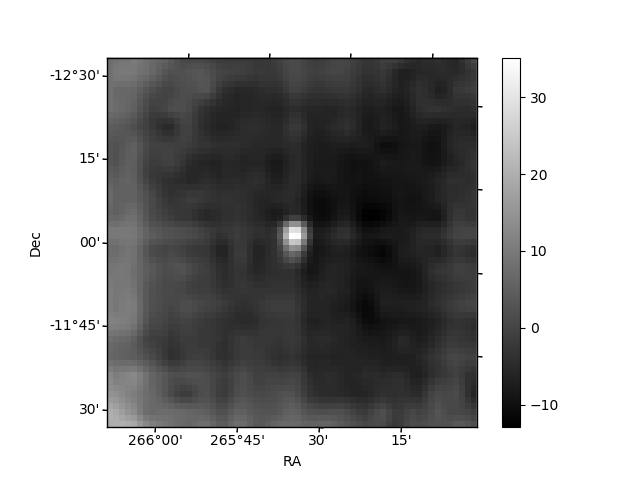
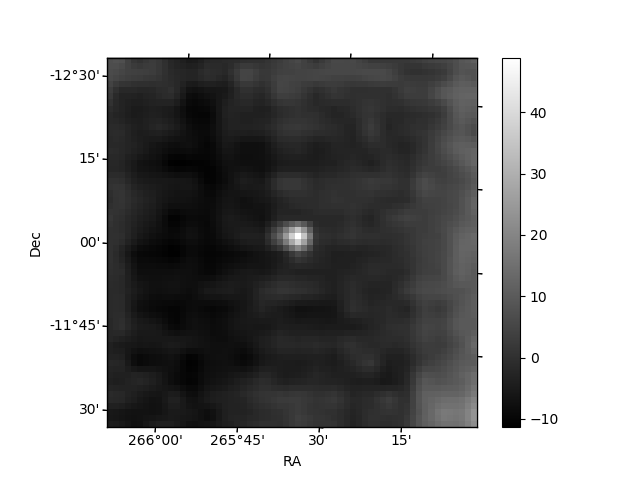
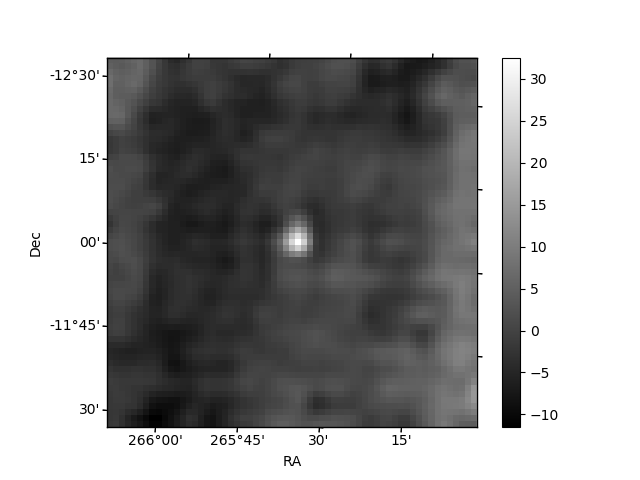
Histogram calculated using DETX and DETY for each event in the final _common_clean file
| Quadrant A | 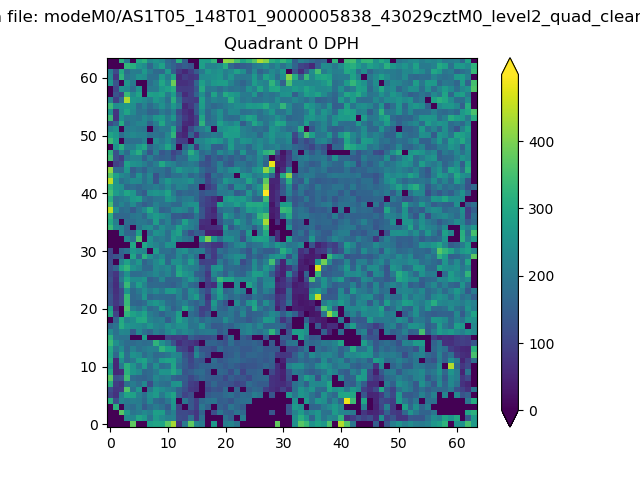 |
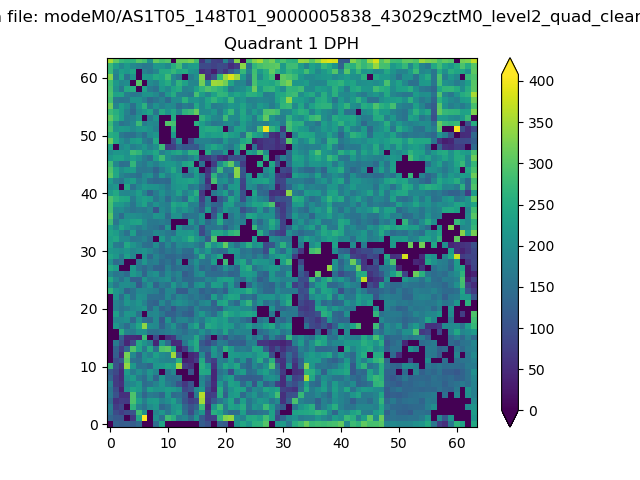 |
Quadrant B |
|---|---|---|---|
| Quadrant D | 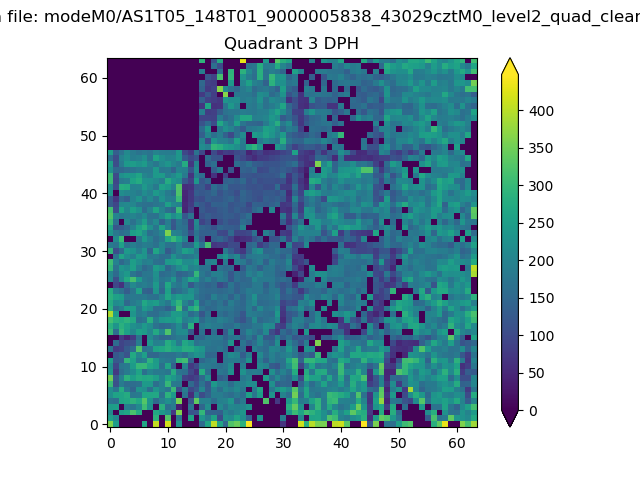 |
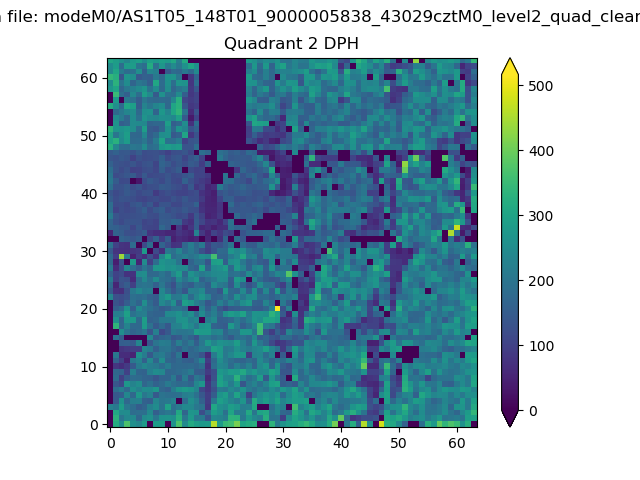 |
Quadrant C |
| Plot type | Count rate plots | Images |
|---|---|---|
| Comparison with Poisson distribution Blue bars denote a histogram of data divided into 1 sec bins. Red curve is a Poisson curve with rate = median count rate of data. |
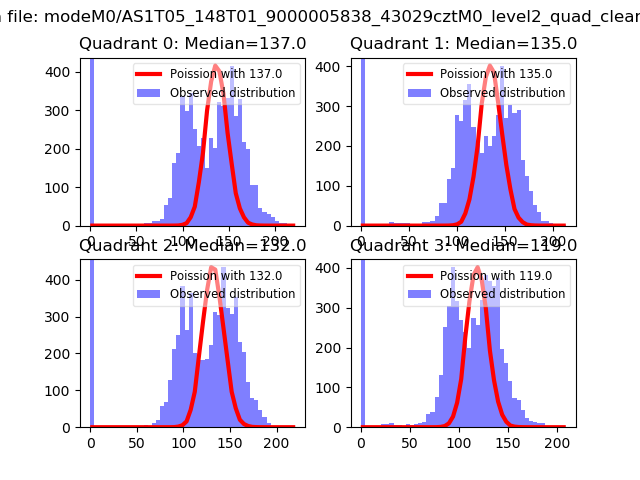 |
 |
| Quadrant-wise count rates Data is divided into 100 sec bins |
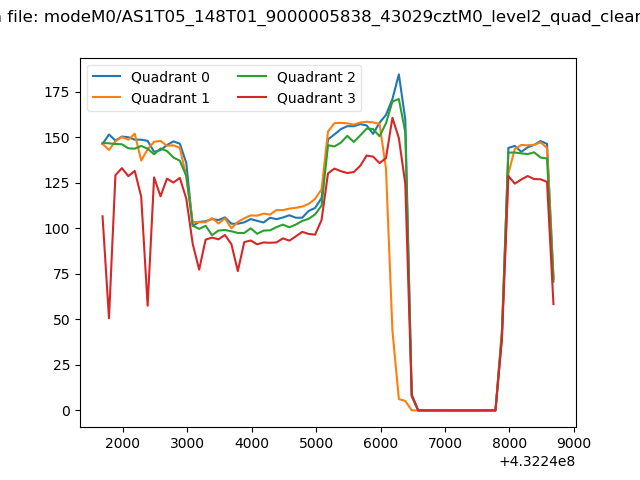 |
|
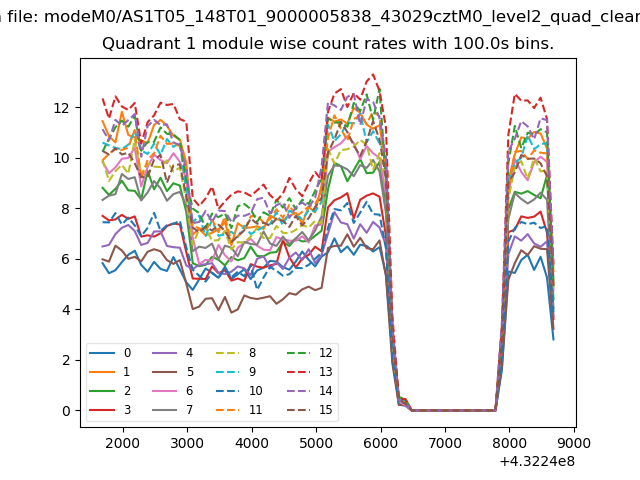
| Module-wise count rates for Quadrant A Data is divided into 100 sec bins |
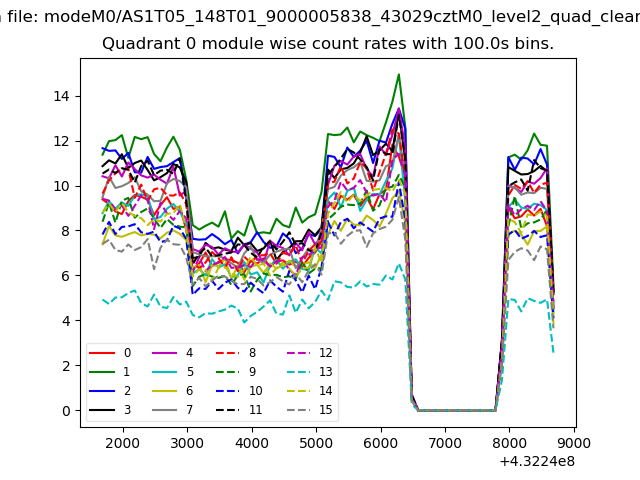 |
 |
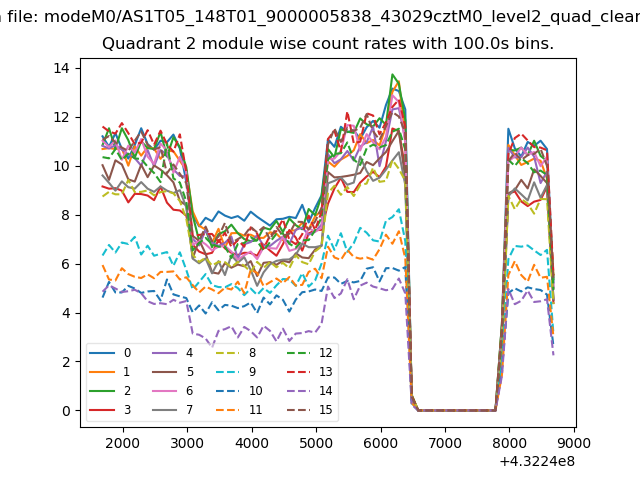
| Module-wise count rates for Quadrant B Data is divided into 100 sec bins |
 |
 |
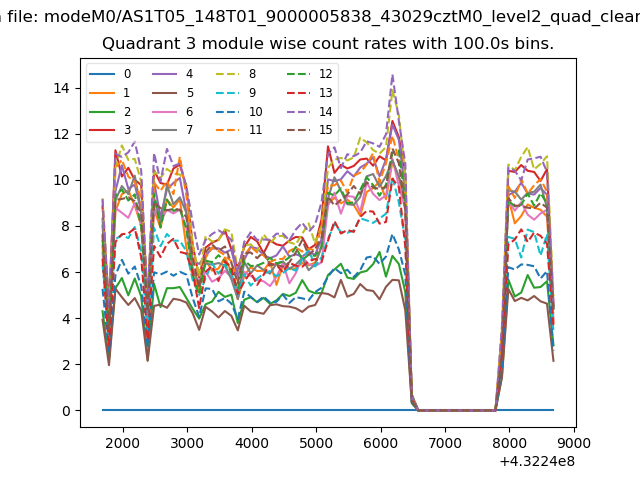
| Module-wise count rates for Quadrant C Data is divided into 100 sec bins |
 |
 |
| Module-wise count rates for Quadrant D Data is divided into 100 sec bins |
 |
 |
| Parameter | Plot |
|---|---|
| CZT HV Monitor | 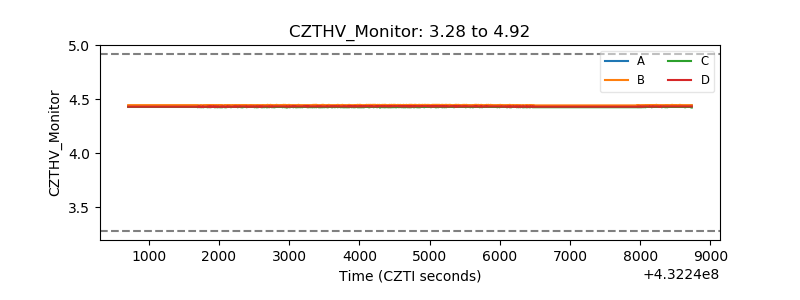 |
| D_VDD | 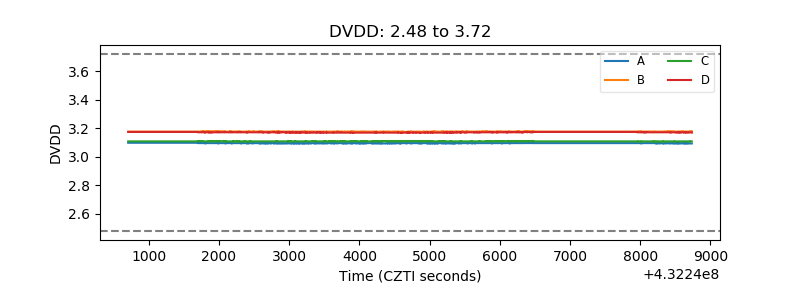 |
| Temperature 1 | 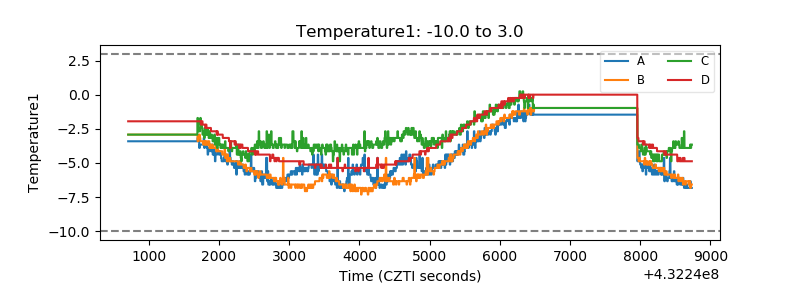 |
| Veto HV Monitor |  |
| Veto LLD | 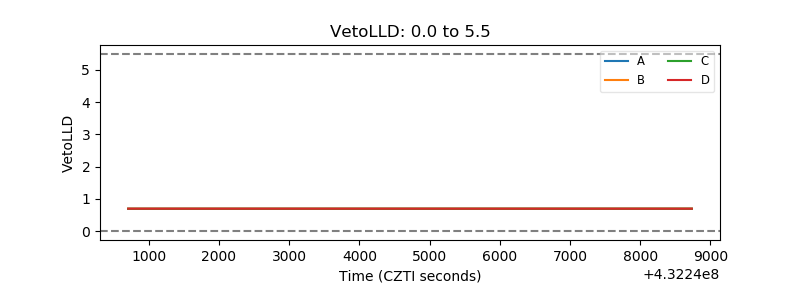 |
| Alpha Counter | 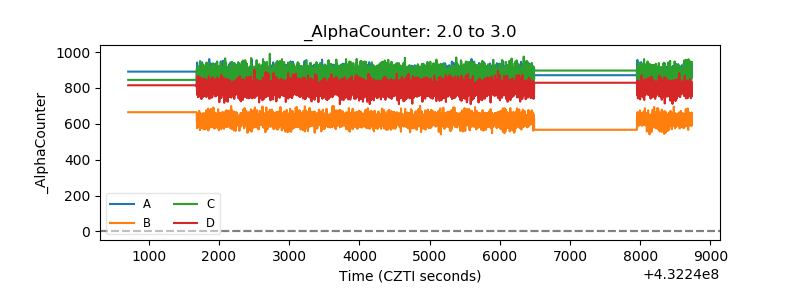 |
| _CPM_Rate | 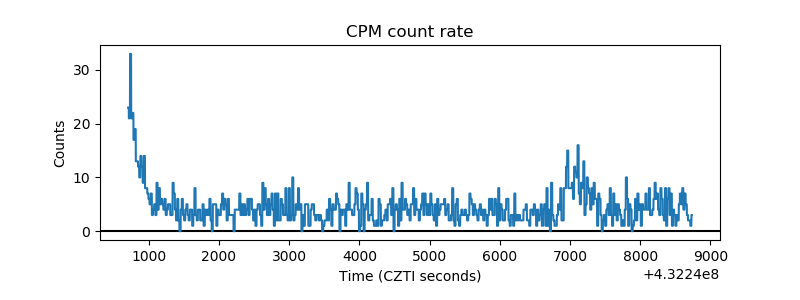 |
| CZT Counter | 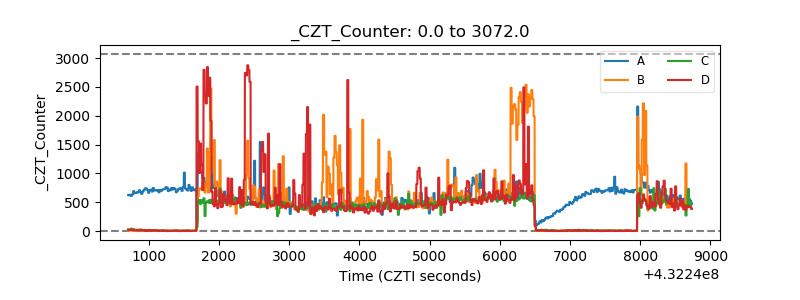 |
| +2.5 Volts monitor | 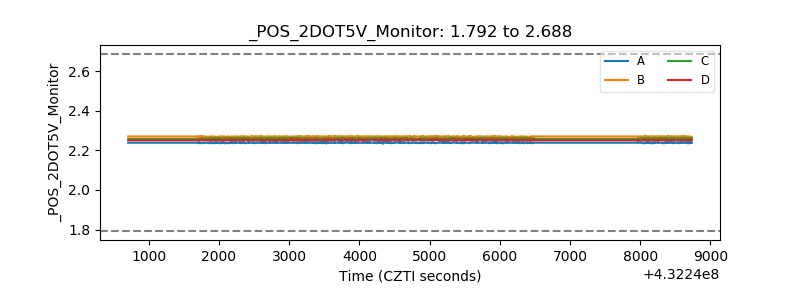 |
| +5 Volts monitor | 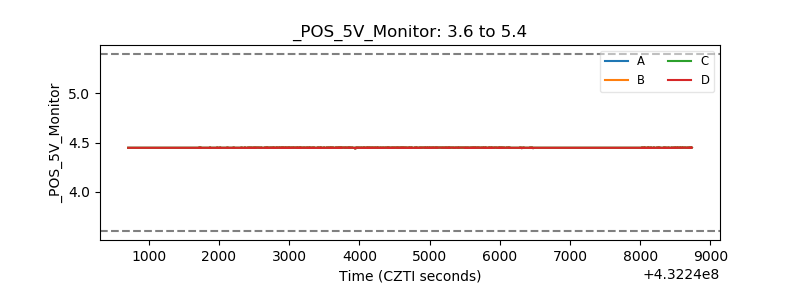 |
| _ROLL_ROT | 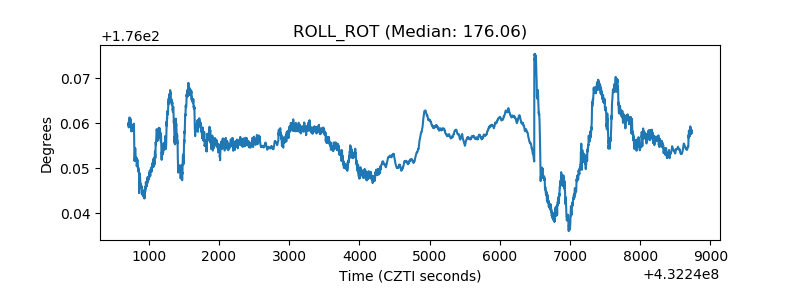 |
| _Roll_DEC | 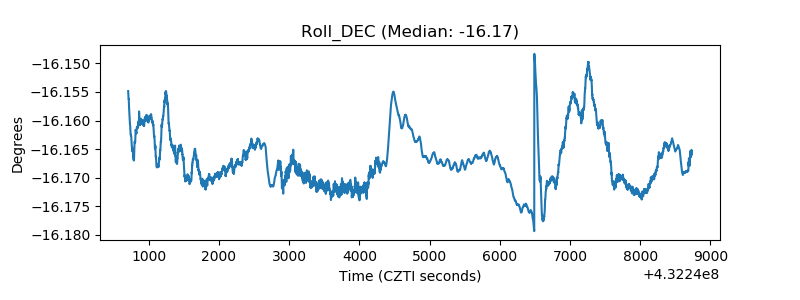 |
| _Roll_RA | 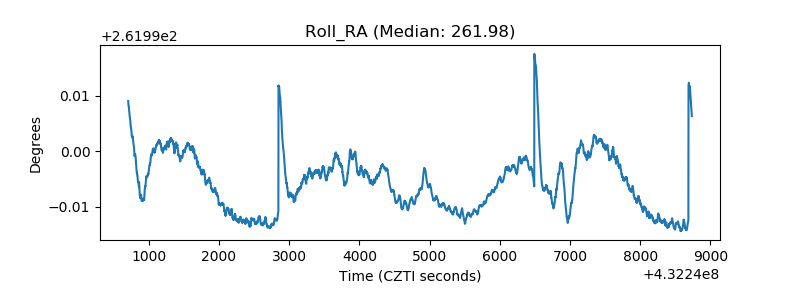 |
| Veto Counter | 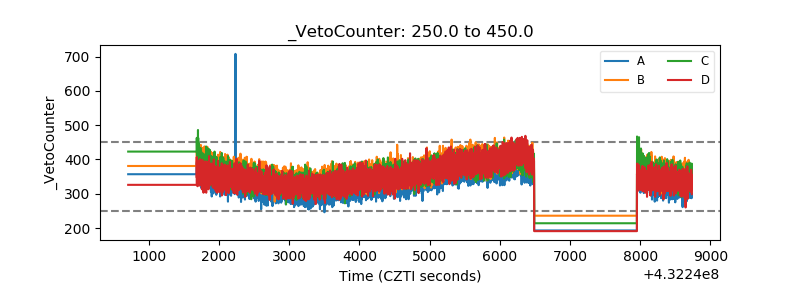 |