| Param | Original file | Final file |
|---|---|---|
| Filename | modeM0/AS1T05_148T01_9000005838_43030cztM0_level2.fits | modeM0/AS1T05_148T01_9000005838_43030cztM0_level2_quad_clean.evt |
| Size (bytes) | 407,036,160 | 112,337,280 |
| Size | 388.2 MB | 107.1 MB |
| Events in quadrant A | 3,489,486 | 791,634 |
| Events in quadrant B | 4,279,158 | 739,210 |
| Events in quadrant C | 3,003,232 | 767,909 |
| Events in quadrant D | 3,821,817 | 677,651 |
| Mode M9 | |||
|---|---|---|---|
| Quadrant | BADHDUFLAG | Total packets | Discarded packets |
| A | 0 | 27 | 0 |
| B | 0 | 27 | 0 |
| C | 0 | 27 | 0 |
| D | 0 | 27 | 0 |
| Mode SS | |||
|---|---|---|---|
| Quadrant | BADHDUFLAG | Total packets | Discarded packets |
| A | 0 | 128 | 0 |
| B | 0 | 128 | 0 |
| C | 0 | 128 | 0 |
| D | 0 | 128 | 0 |
| Mode M0 | |||
|---|---|---|---|
| Quadrant | BADHDUFLAG | Total packets | Discarded packets |
| A | 0 | 14377 | 2 |
| B | 0 | 16808 | 2 |
| C | 0 | 12576 | 2 |
| D | 0 | 15626 | 2 |
| Quadrant | Total seconds | Saturated seconds | Saturation percentage |
|---|---|---|---|
| A | 6084 | 46 | 0.756082% |
| B | 6085 | 493 | 8.101890% |
| C | 6085 | 3 | 0.049302% |
| D | 6085 | 221 | 3.631882% |
Noise dominated data is calculated using 1-second bins in cleaned event files. If a bin has >2000 counts, and if more than 50% of those come from <1% of pixels, then it is considered to be noise-dominated and hence unusable.
| Quadrant | # 1 sec bins | Bins with >0 counts | Bins with >2000 counts | High rate bins dominated by noise | Noise dominated (total time) | Noise dominated (detector-on time) | Marked lightcurve |
|---|---|---|---|---|---|---|---|
| A | 8829 | 6086 | 28 | 28 | 0.32% | 0.46% | 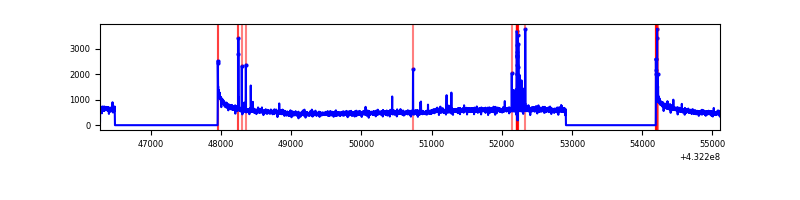 |
| B | 8830 | 6087 | 350 | 350 | 3.96% | 5.75% | 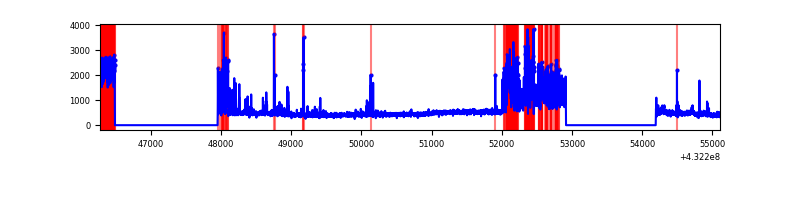 |
| C | 8830 | 6087 | 0 | 0 | 0.00% | 0.00% | 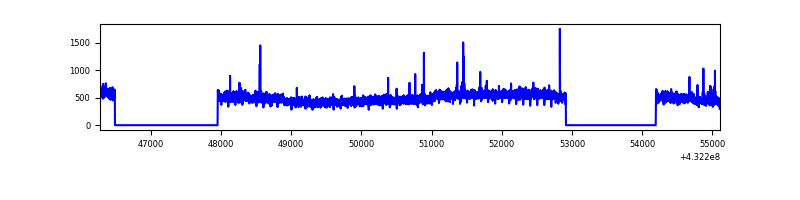 |
| D | 8830 | 6087 | 169 | 169 | 1.91% | 2.78% | 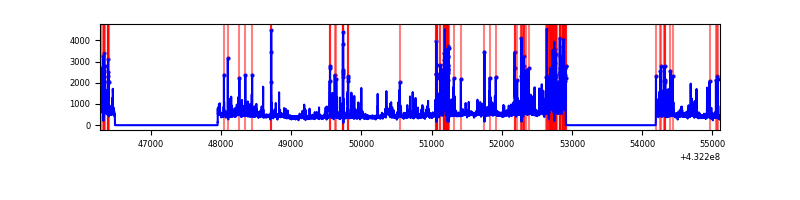 |
Top three noisy pixels from each quadrant. If the there are fewer than three noisy pixels in the level2.evt file, extra rows are filled as -1
| Pixel properties | Quadrant properties | ||||||
|---|---|---|---|---|---|---|---|
| Quadrant | DetID | PixID | Counts | Sigma | Mean | Median | Sigma |
| A | 10 | 83 | 616874 | 4045.55 | 711 | 701 | 152.3 |
| A | 15 | 237 | 105687 | 689.3 | 711 | 701 | 152.3 |
| A | 13 | 6 | 12963 | 80.51 | 711 | 701 | 152.3 |
| B | 0 | 186 | 1049118 | 7610.54 | 688 | 672 | 137.8 |
| B | 5 | 255 | 417206 | 3023.57 | 688 | 672 | 137.8 |
| B | 0 | 189 | 67917 | 488.12 | 688 | 672 | 137.8 |
| C | 15 | 214 | 268183 | 1575.93 | 693 | 700 | 169.7 |
| C | 15 | 159 | 16879 | 95.32 | 693 | 700 | 169.7 |
| C | 0 | 207 | 7584 | 40.56 | 693 | 700 | 169.7 |
| D | 1 | 52 | 513673 | 2951.79 | 679 | 659 | 173.8 |
| D | 13 | 249 | 370193 | 2126.23 | 679 | 659 | 173.8 |
| D | 2 | 249 | 169113 | 969.25 | 679 | 659 | 173.8 |
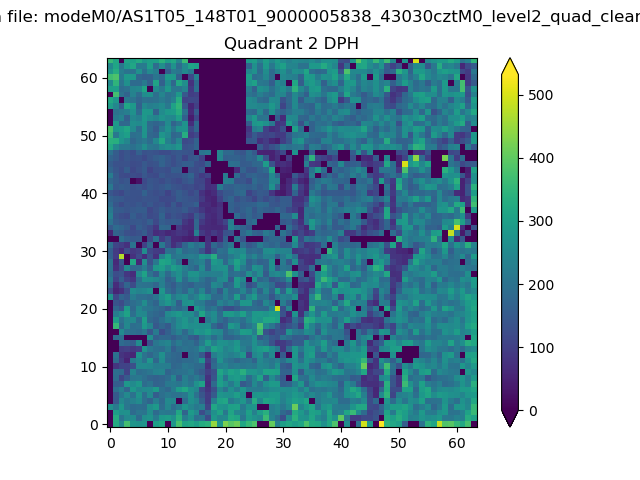
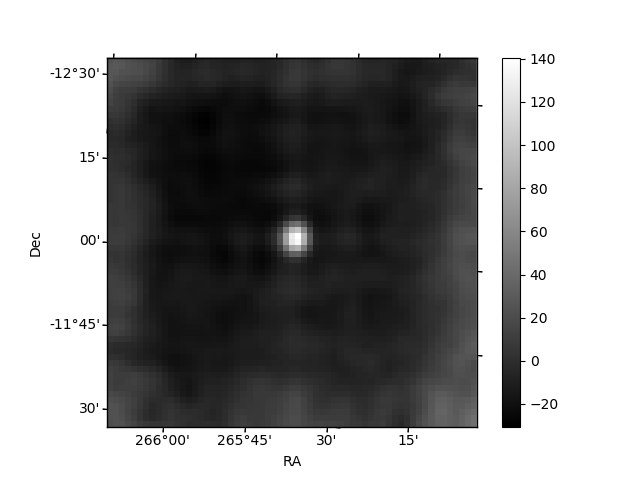
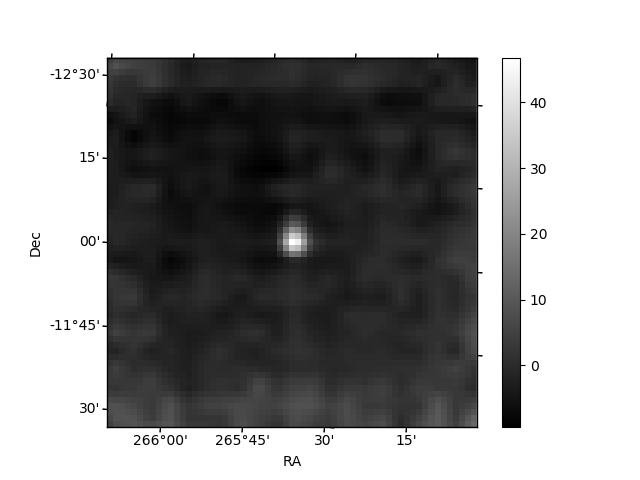
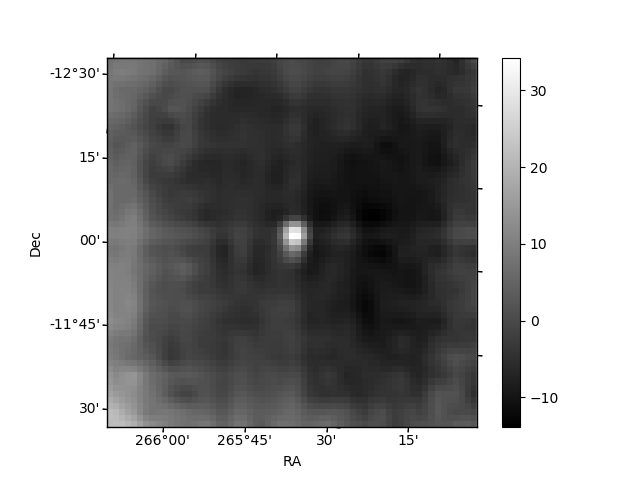
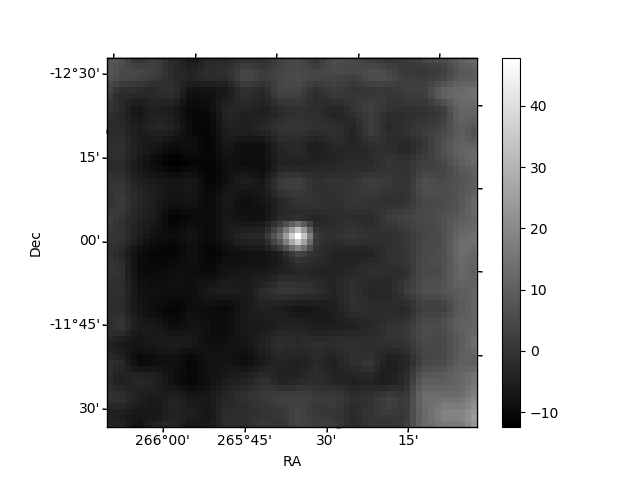
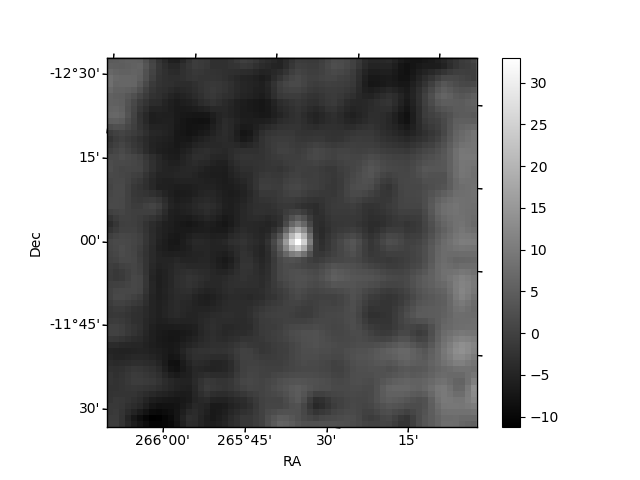
Histogram calculated using DETX and DETY for each event in the final _common_clean file
| Quadrant A | 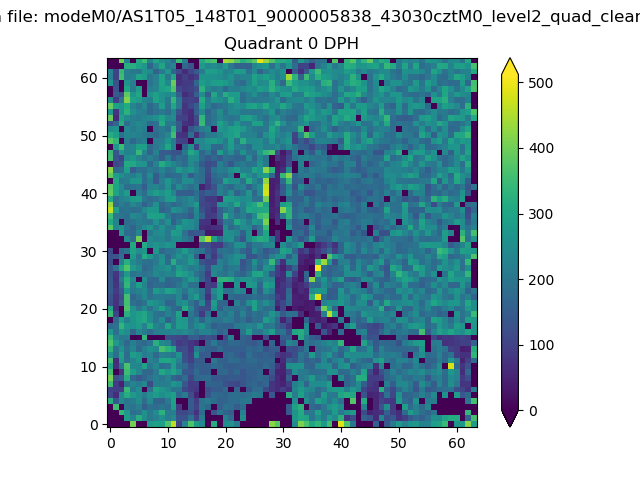 |
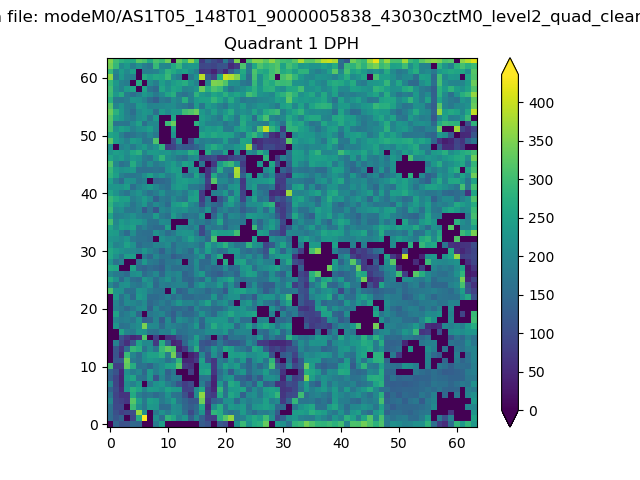 |
Quadrant B |
|---|---|---|---|
| Quadrant D | 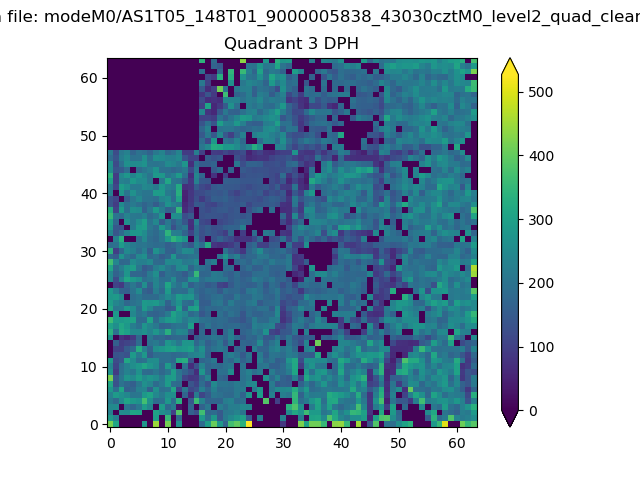 |
 |
Quadrant C |
| Plot type | Count rate plots | Images |
|---|---|---|
| Comparison with Poisson distribution Blue bars denote a histogram of data divided into 1 sec bins. Red curve is a Poisson curve with rate = median count rate of data. |
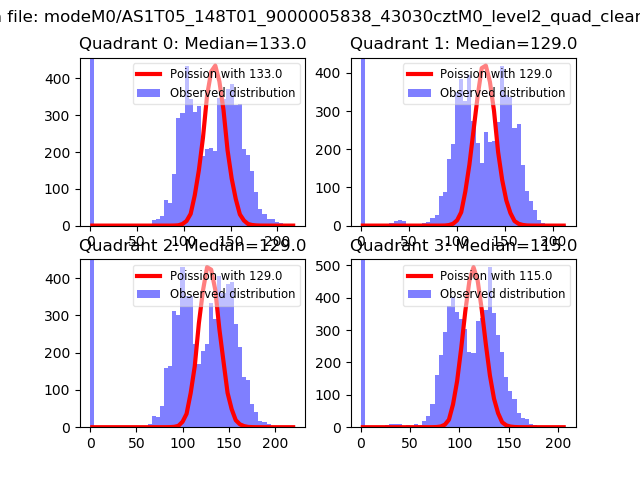 |
 |
| Quadrant-wise count rates Data is divided into 100 sec bins |
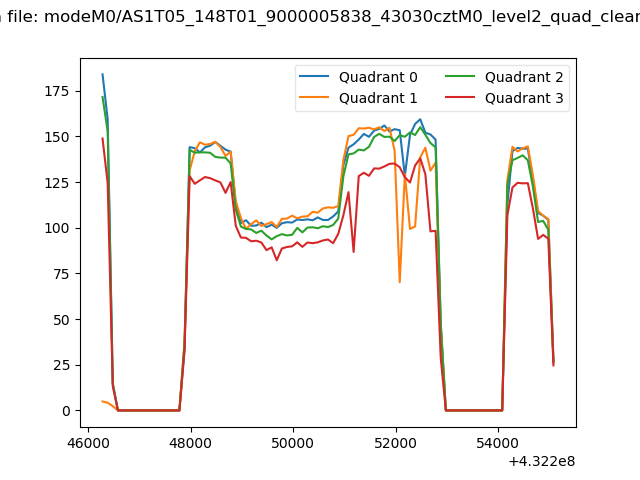 |
|
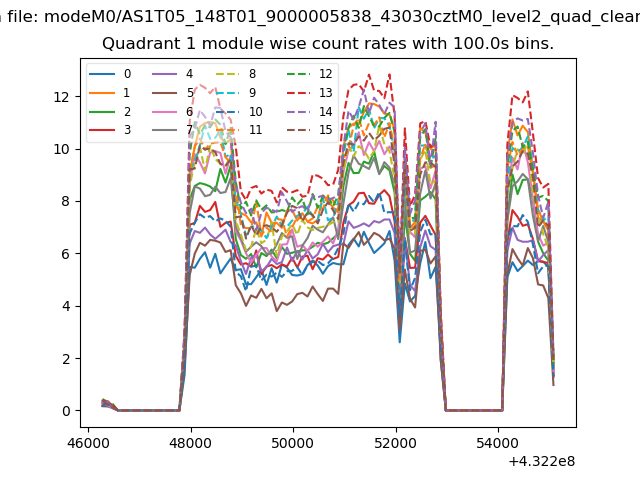
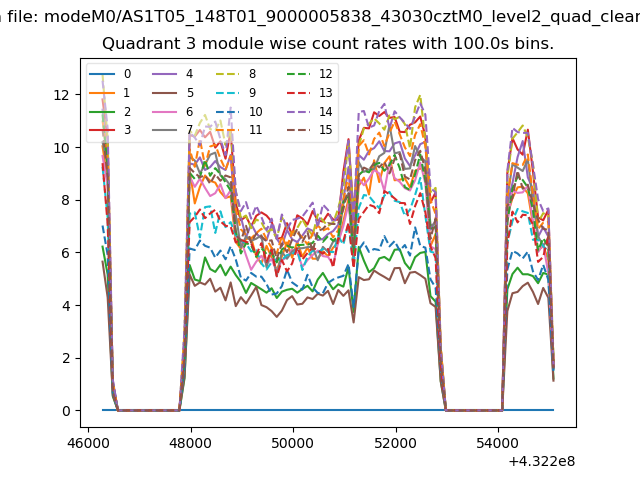
| Module-wise count rates for Quadrant A Data is divided into 100 sec bins |
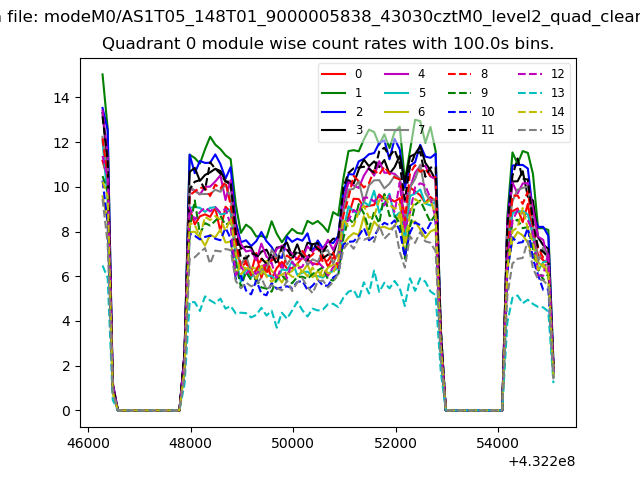 |
 |
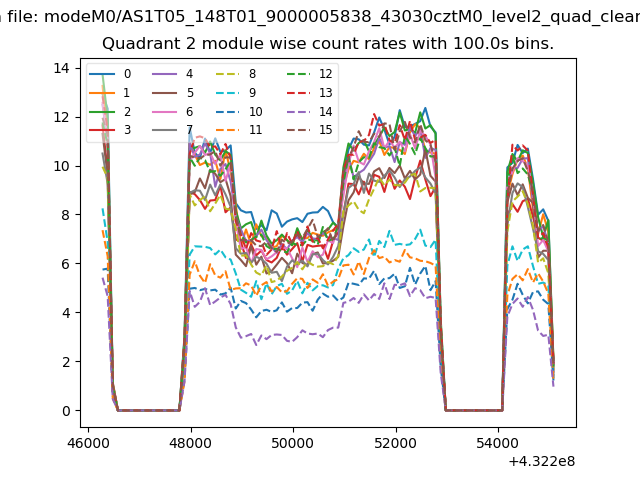
| Module-wise count rates for Quadrant B Data is divided into 100 sec bins |
 |
 |
| Module-wise count rates for Quadrant C Data is divided into 100 sec bins |
 |
 |
| Module-wise count rates for Quadrant D Data is divided into 100 sec bins |
 |
 |
| Parameter | Plot |
|---|---|
| CZT HV Monitor | 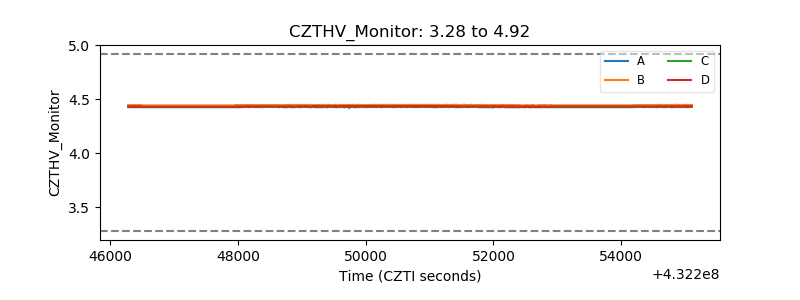 |
| D_VDD | 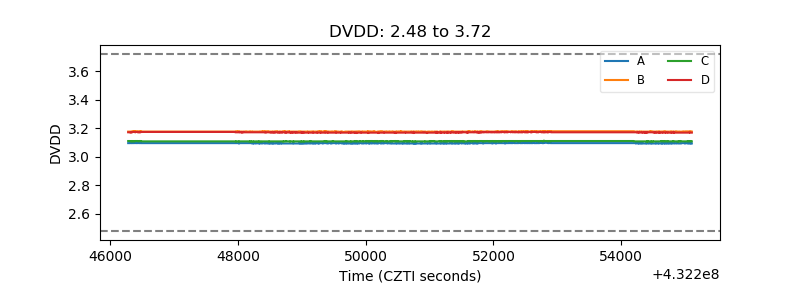 |
| Temperature 1 | 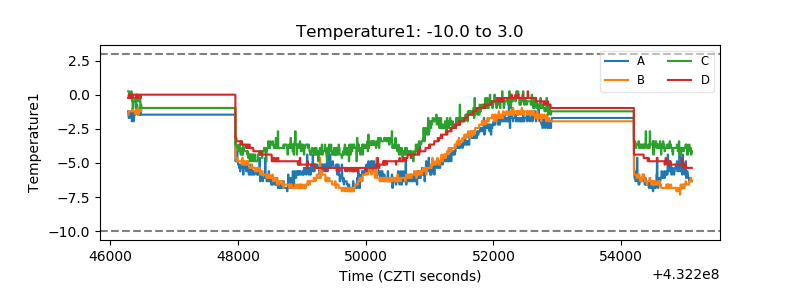 |
| Veto HV Monitor | 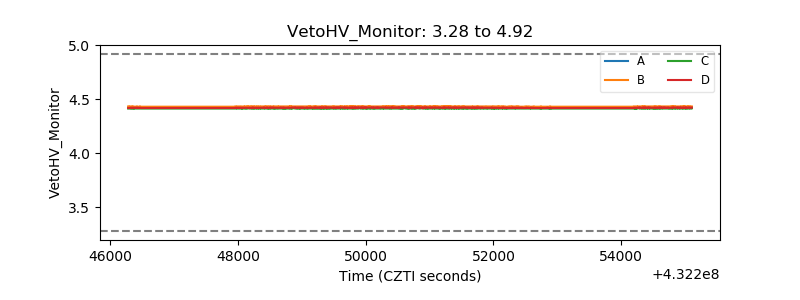 |
| Veto LLD | 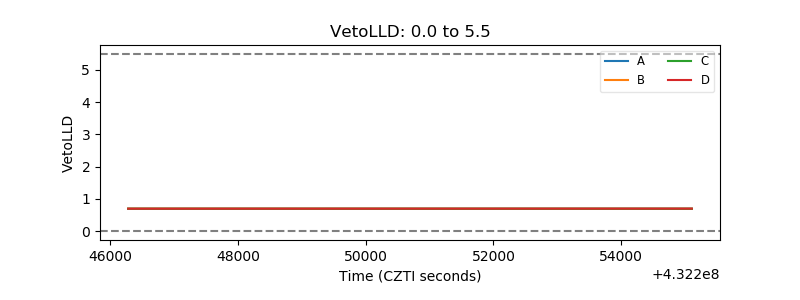 |
| Alpha Counter | 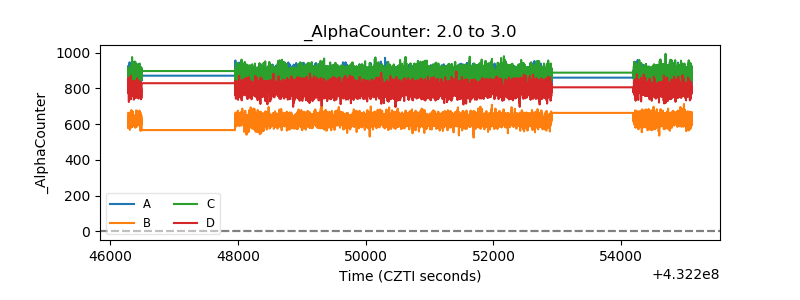 |
| _CPM_Rate | 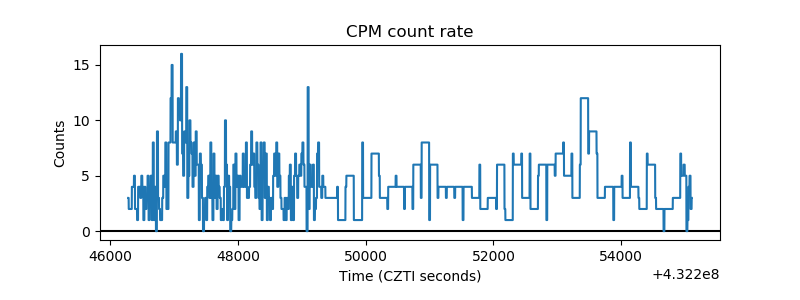 |
| CZT Counter | 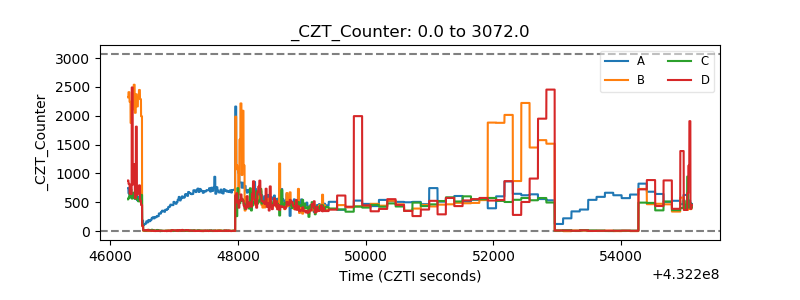 |
| +2.5 Volts monitor | 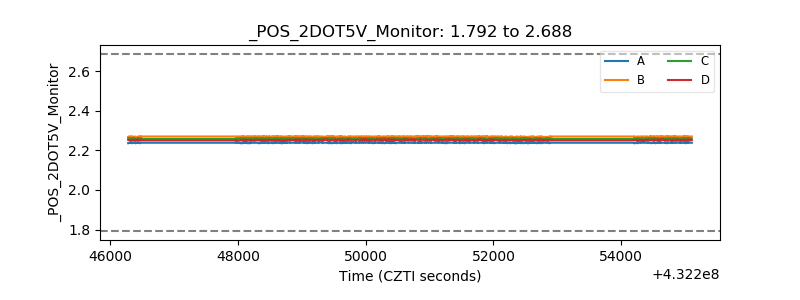 |
| +5 Volts monitor | 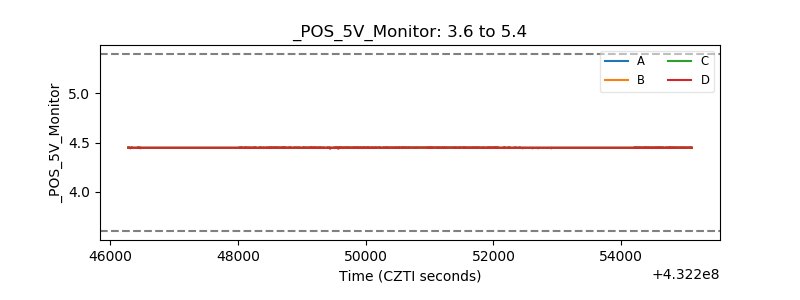 |
| _ROLL_ROT | 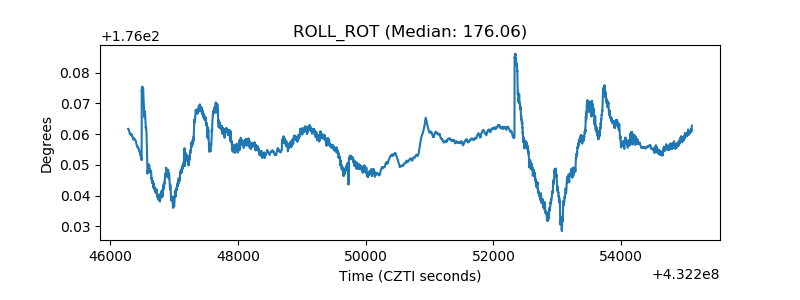 |
| _Roll_DEC | 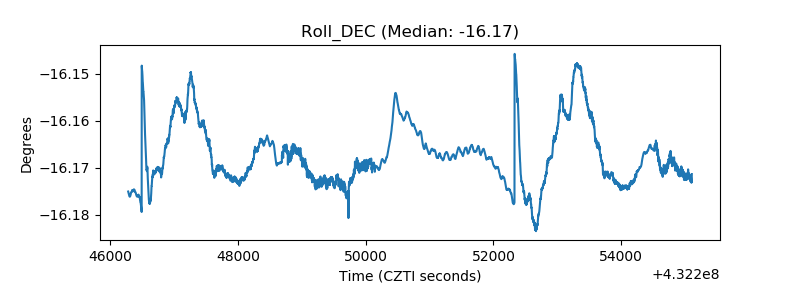 |
| _Roll_RA | 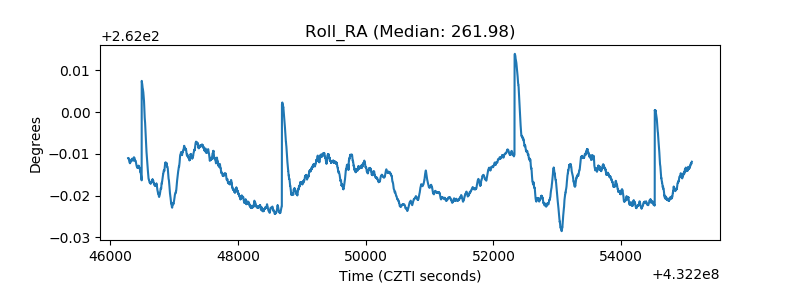 |
| Veto Counter | 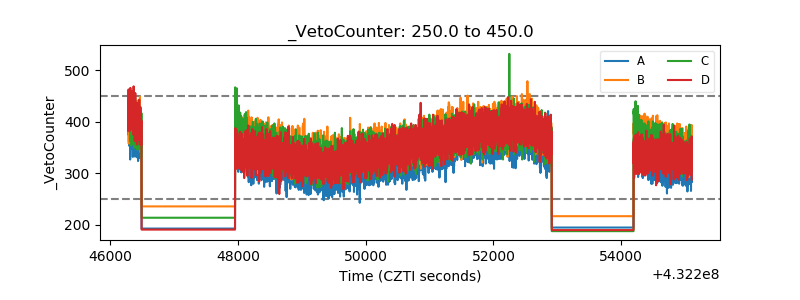 |