| Param | Original file | Final file |
|---|---|---|
| Filename | modeM0/AS1T05_148T01_9000005838_43033cztM0_level2.fits | modeM0/AS1T05_148T01_9000005838_43033cztM0_level2_quad_clean.evt |
| Size (bytes) | 1,176,128,640 | 281,600,640 |
| Size | 1.1 GB | 268.6 MB |
| Events in quadrant A | 10,882,913 | 1,940,486 |
| Events in quadrant B | 10,552,407 | 1,954,903 |
| Events in quadrant C | 7,810,549 | 1,916,224 |
| Events in quadrant D | 13,074,274 | 1,628,958 |
| Mode M9 | |||
|---|---|---|---|
| Quadrant | BADHDUFLAG | Total packets | Discarded packets |
| A | 0 | 53 | 0 |
| B | 0 | 53 | 0 |
| C | 0 | 53 | 0 |
| D | 0 | 53 | 0 |
| Mode SS | |||
|---|---|---|---|
| Quadrant | BADHDUFLAG | Total packets | Discarded packets |
| A | 0 | 324 | 0 |
| B | 0 | 324 | 0 |
| C | 0 | 324 | 0 |
| D | 0 | 324 | 0 |
| Mode M0 | |||
|---|---|---|---|
| Quadrant | BADHDUFLAG | Total packets | Discarded packets |
| A | 0 | 42734 | 4 |
| B | 0 | 42051 | 4 |
| C | 0 | 32293 | 4 |
| D | 0 | 49878 | 4 |
| Quadrant | Total seconds | Saturated seconds | Saturation percentage |
|---|---|---|---|
| A | 15736 | 490 | 3.113879% |
| B | 15737 | 557 | 3.539429% |
| C | 15737 | 12 | 0.076253% |
| D | 15737 | 1369 | 8.699244% |
Noise dominated data is calculated using 1-second bins in cleaned event files. If a bin has >2000 counts, and if more than 50% of those come from <1% of pixels, then it is considered to be noise-dominated and hence unusable.
| Quadrant | # 1 sec bins | Bins with >0 counts | Bins with >2000 counts | High rate bins dominated by noise | Noise dominated (total time) | Noise dominated (detector-on time) | Marked lightcurve |
|---|---|---|---|---|---|---|---|
| A | 21136 | 15740 | 364 | 364 | 1.72% | 2.31% | 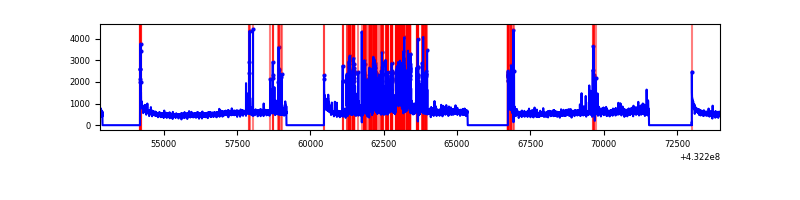 |
| B | 21137 | 15740 | 300 | 300 | 1.42% | 1.91% | 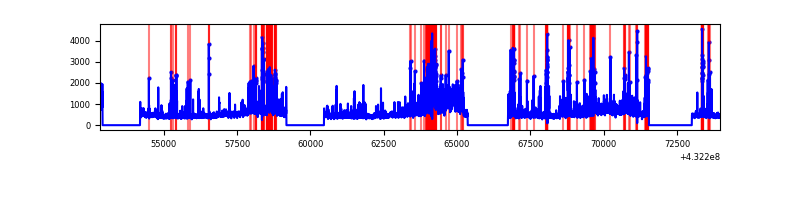 |
| C | 21137 | 15740 | 4 | 4 | 0.02% | 0.03% | 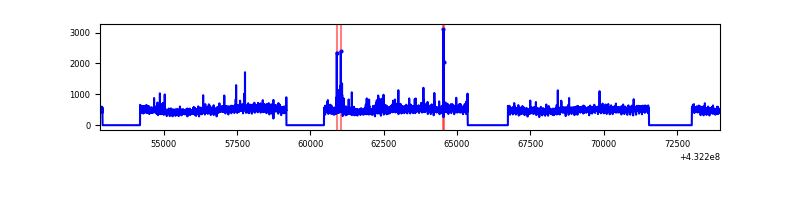 |
| D | 21137 | 15739 | 960 | 960 | 4.54% | 6.10% | 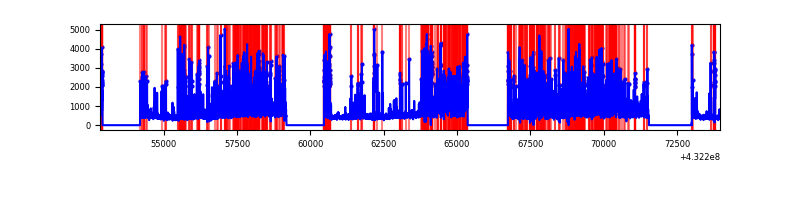 |
Top three noisy pixels from each quadrant. If the there are fewer than three noisy pixels in the level2.evt file, extra rows are filled as -1
| Pixel properties | Quadrant properties | ||||||
|---|---|---|---|---|---|---|---|
| Quadrant | DetID | PixID | Counts | Sigma | Mean | Median | Sigma |
| A | 15 | 237 | 2073702 | 5399.98 | 1826 | 1797 | 383.7 |
| A | 10 | 83 | 1518474 | 3952.9 | 1826 | 1797 | 383.7 |
| A | 12 | 189 | 217720 | 562.76 | 1826 | 1797 | 383.7 |
| B | 0 | 186 | 1630655 | 4551.83 | 1803 | 1760 | 357.9 |
| B | 5 | 255 | 1329087 | 3709.12 | 1803 | 1760 | 357.9 |
| B | 4 | 171 | 261542 | 725.94 | 1803 | 1760 | 357.9 |
| C | 15 | 214 | 688692 | 1599.55 | 1784 | 1808 | 429.4 |
| C | 14 | 254 | 83679 | 190.65 | 1784 | 1808 | 429.4 |
| C | 0 | 207 | 65033 | 147.23 | 1784 | 1808 | 429.4 |
| D | 1 | 52 | 4383988 | 9926.02 | 1718 | 1665 | 441.5 |
| D | 13 | 249 | 1185992 | 2682.52 | 1718 | 1665 | 441.5 |
| D | 1 | 47 | 488413 | 1102.49 | 1718 | 1665 | 441.5 |
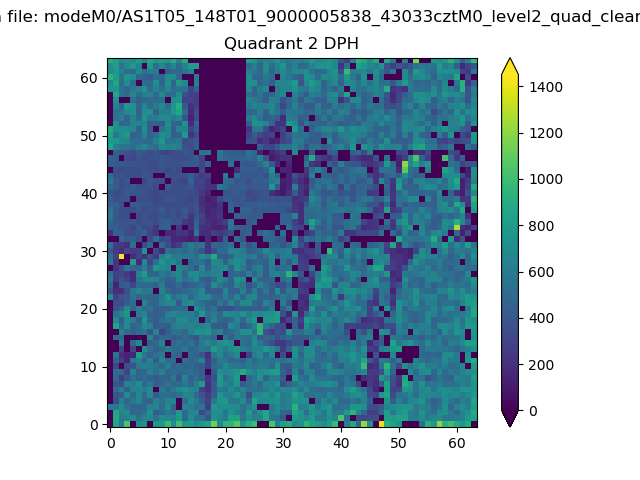
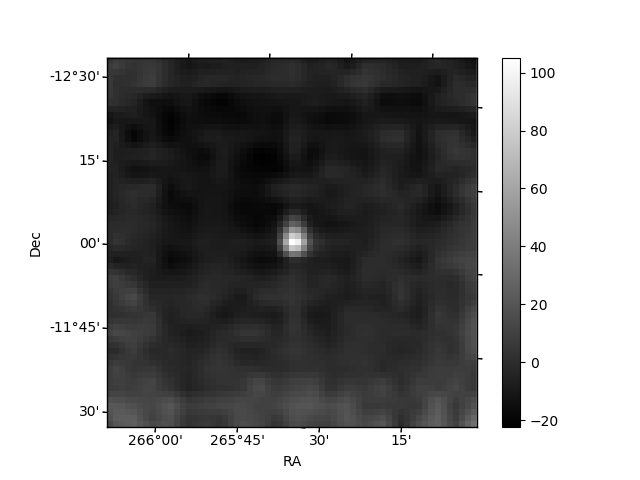
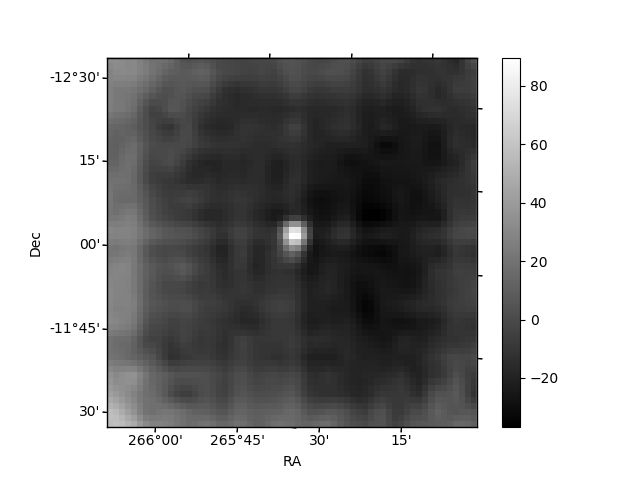
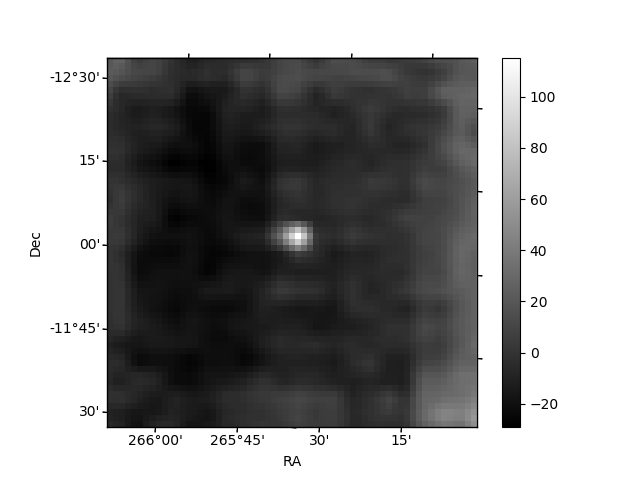
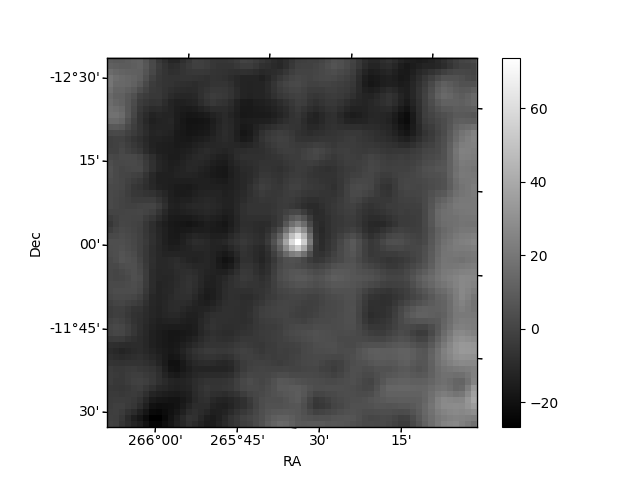
Histogram calculated using DETX and DETY for each event in the final _common_clean file
| Quadrant A | 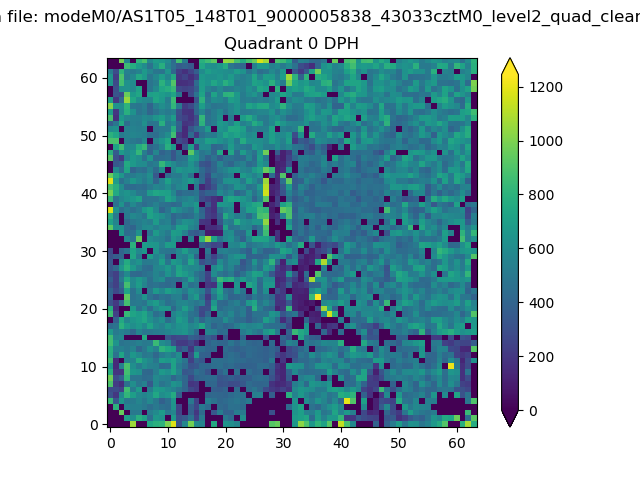 |
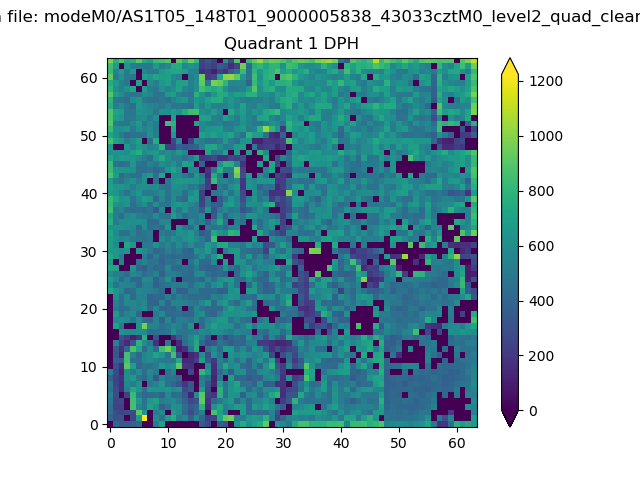 |
Quadrant B |
|---|---|---|---|
| Quadrant D | 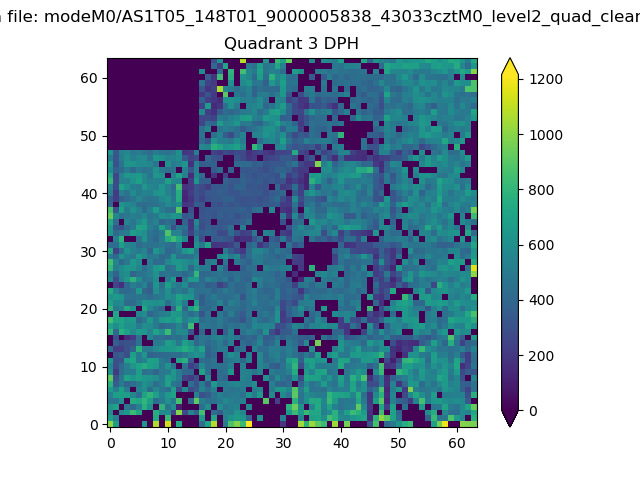 |
 |
Quadrant C |
| Plot type | Count rate plots | Images |
|---|---|---|
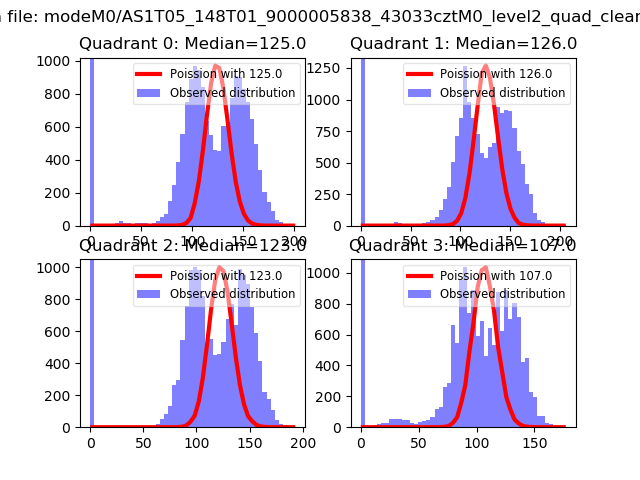
| Comparison with Poisson distribution Blue bars denote a histogram of data divided into 1 sec bins. Red curve is a Poisson curve with rate = median count rate of data. |
 |
 |
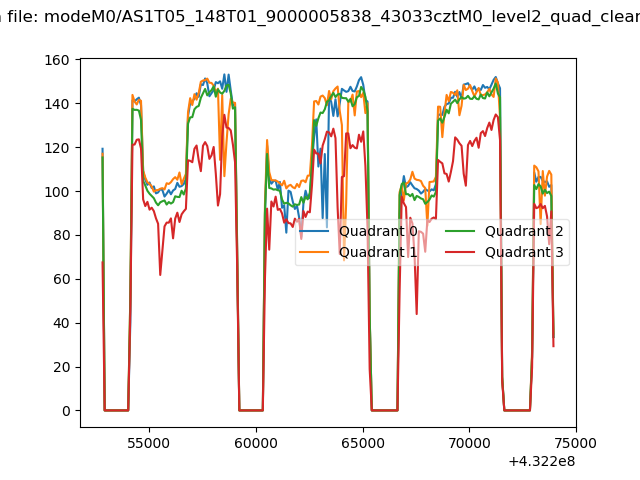
| Quadrant-wise count rates Data is divided into 100 sec bins |
 |
|
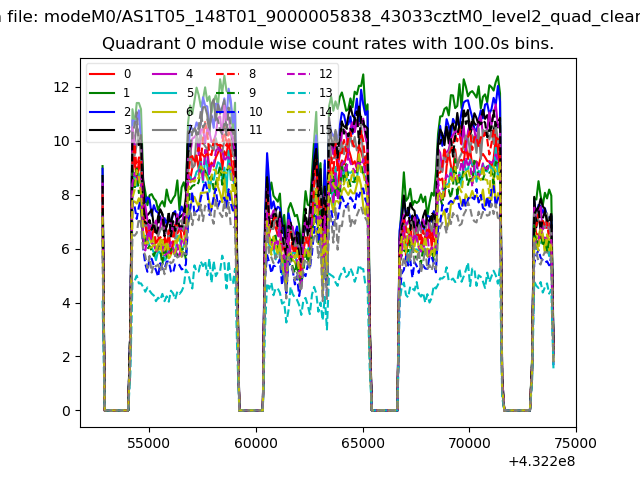
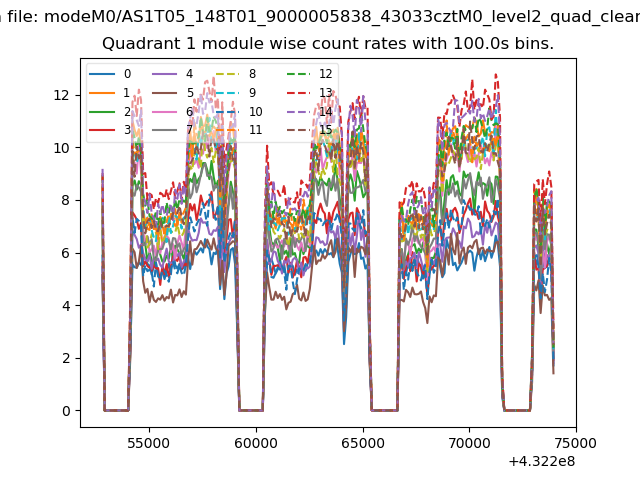
| Module-wise count rates for Quadrant A Data is divided into 100 sec bins |
 |
 |
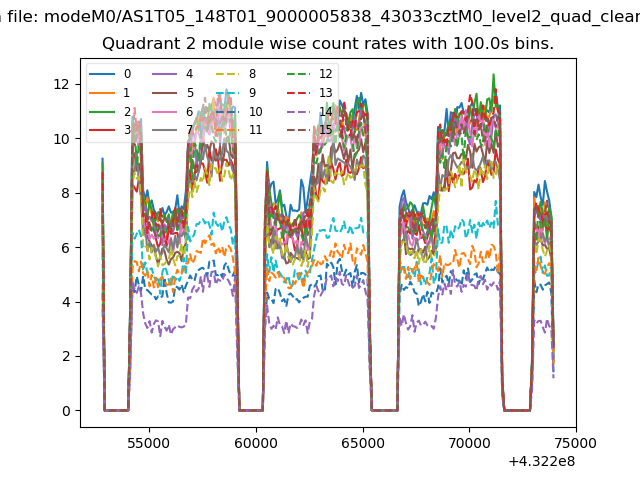
| Module-wise count rates for Quadrant B Data is divided into 100 sec bins |
 |
 |
| Module-wise count rates for Quadrant C Data is divided into 100 sec bins |
 |
 |
| Module-wise count rates for Quadrant D Data is divided into 100 sec bins |
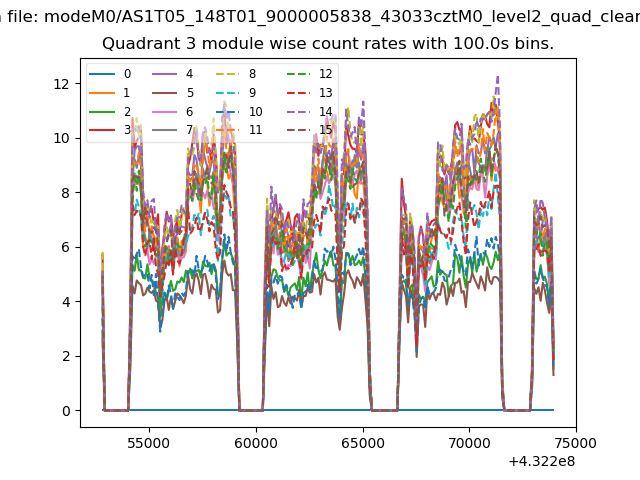 |
 |
| Parameter | Plot |
|---|---|
| CZT HV Monitor | 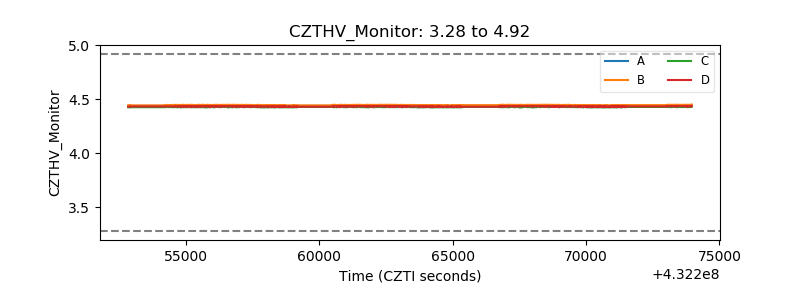 |
| D_VDD | 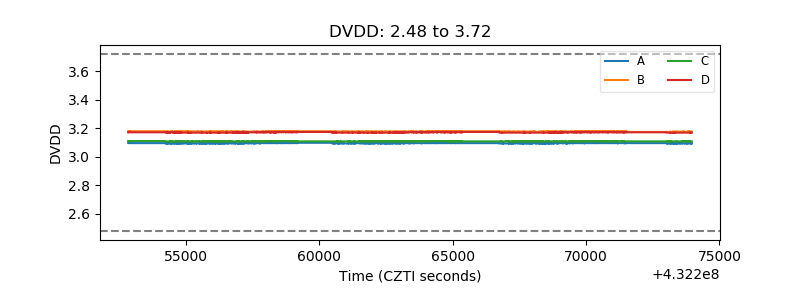 |
| Temperature 1 | 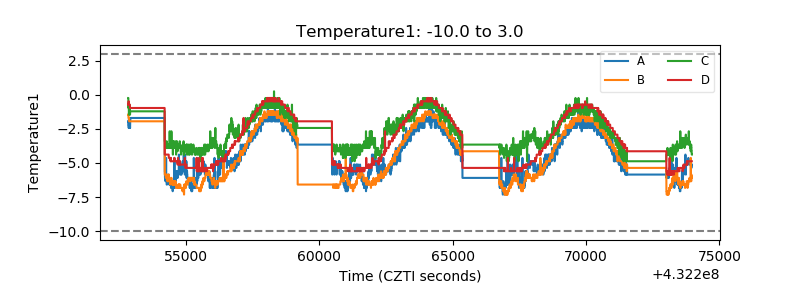 |
| Veto HV Monitor | 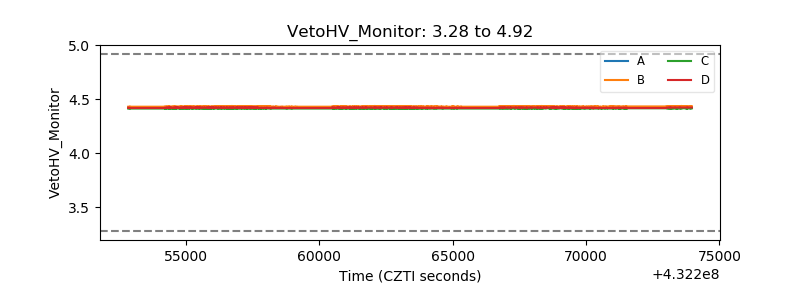 |
| Veto LLD | 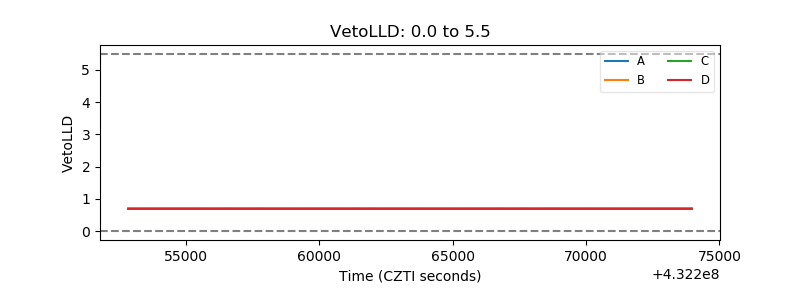 |
| Alpha Counter | 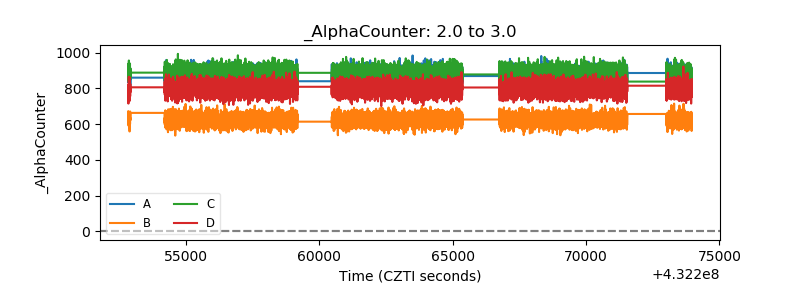 |
| _CPM_Rate | 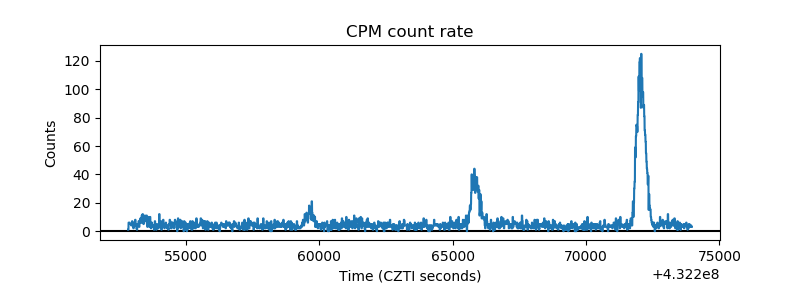 |
| CZT Counter | 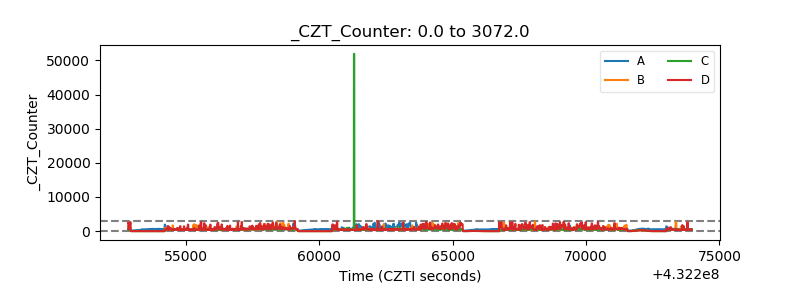 |
| +2.5 Volts monitor | 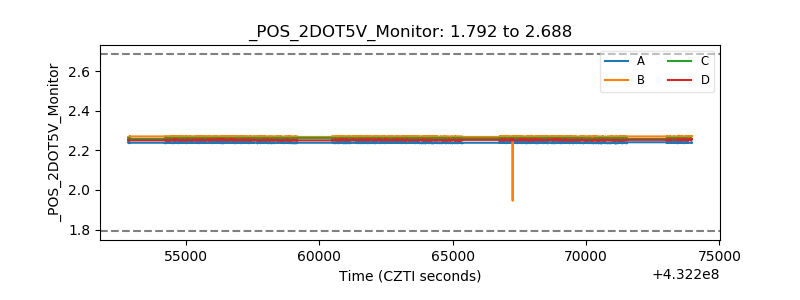 |
| +5 Volts monitor | 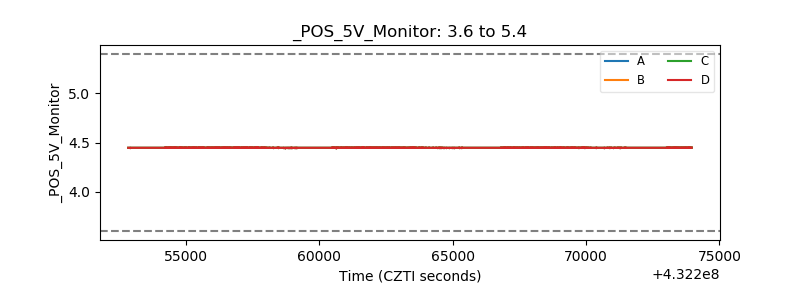 |
| _ROLL_ROT | 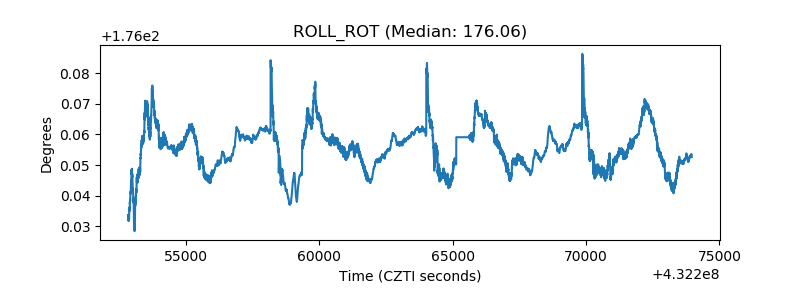 |
| _Roll_DEC | 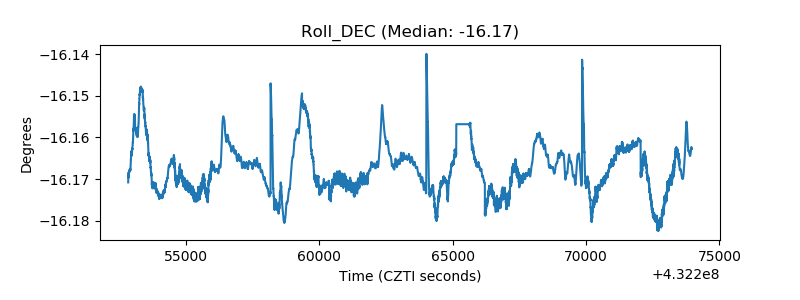 |
| _Roll_RA | 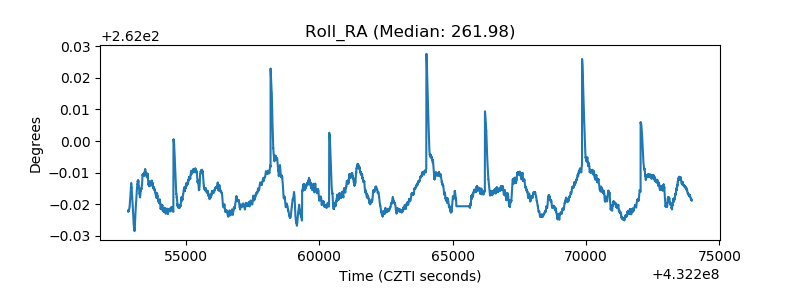 |
| Veto Counter | 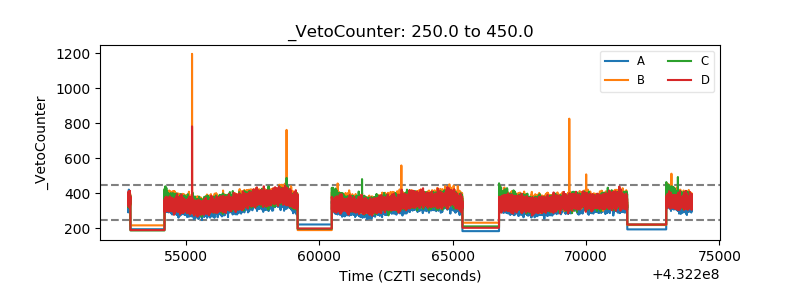 |