| Param | Original file | Final file |
|---|---|---|
| Filename | modeM0/AS1T05_148T01_9000005838_43035cztM0_level2.fits | modeM0/AS1T05_148T01_9000005838_43035cztM0_level2_quad_clean.evt |
| Size (bytes) | 424,846,080 | 106,156,800 |
| Size | 405.2 MB | 101.2 MB |
| Events in quadrant A | 3,332,272 | 761,645 |
| Events in quadrant B | 4,326,899 | 735,620 |
| Events in quadrant C | 2,985,703 | 731,976 |
| Events in quadrant D | 4,657,273 | 603,179 |
| Mode M9 | |||
|---|---|---|---|
| Quadrant | BADHDUFLAG | Total packets | Discarded packets |
| A | 0 | 25 | 0 |
| B | 0 | 26 | 0 |
| C | 0 | 26 | 0 |
| D | 0 | 26 | 0 |
| Mode SS | |||
|---|---|---|---|
| Quadrant | BADHDUFLAG | Total packets | Discarded packets |
| A | 0 | 112 | 0 |
| B | 0 | 112 | 0 |
| C | 0 | 112 | 0 |
| D | 0 | 112 | 0 |
| Mode M0 | |||
|---|---|---|---|
| Quadrant | BADHDUFLAG | Total packets | Discarded packets |
| A | 0 | 13154 | 3 |
| B | 0 | 16387 | 2 |
| C | 0 | 11832 | 2 |
| D | 0 | 17459 | 2 |
| Quadrant | Total seconds | Saturated seconds | Saturation percentage |
|---|---|---|---|
| A | 5460 | 32 | 0.586081% |
| B | 5460 | 375 | 6.868132% |
| C | 5460 | 30 | 0.549451% |
| D | 5460 | 602 | 11.025641% |
Noise dominated data is calculated using 1-second bins in cleaned event files. If a bin has >2000 counts, and if more than 50% of those come from <1% of pixels, then it is considered to be noise-dominated and hence unusable.
| Quadrant | # 1 sec bins | Bins with >0 counts | Bins with >2000 counts | High rate bins dominated by noise | Noise dominated (total time) | Noise dominated (detector-on time) | Marked lightcurve |
|---|---|---|---|---|---|---|---|
| A | 7162 | 5461 | 20 | 20 | 0.28% | 0.37% | 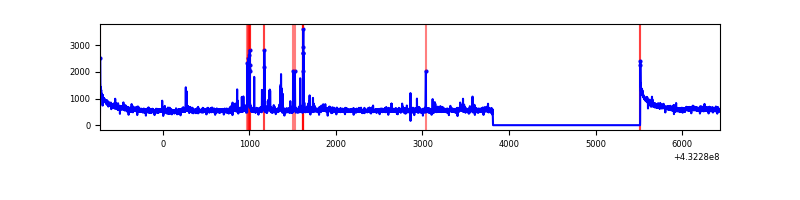 |
| B | 7162 | 5461 | 290 | 290 | 4.05% | 5.31% | 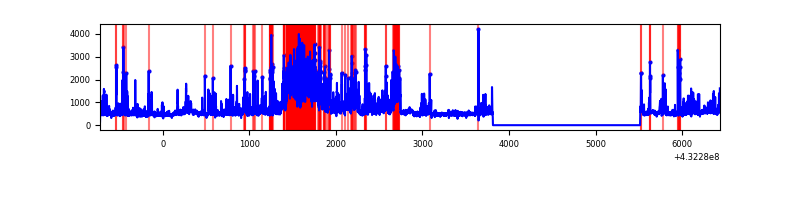 |
| C | 7162 | 5461 | 38 | 38 | 0.53% | 0.70% | 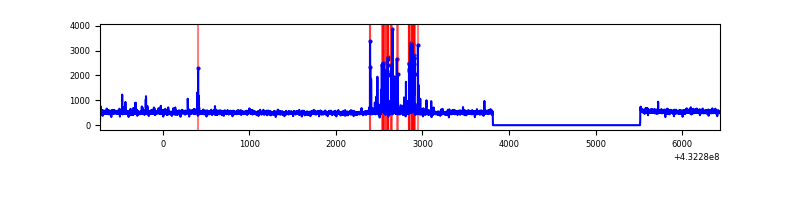 |
| D | 7162 | 5460 | 402 | 402 | 5.61% | 7.36% | 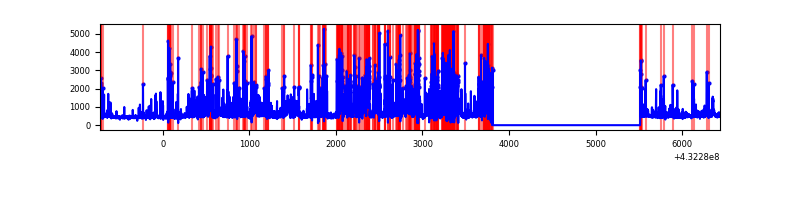 |
Top three noisy pixels from each quadrant. If the there are fewer than three noisy pixels in the level2.evt file, extra rows are filled as -1
| Pixel properties | Quadrant properties | ||||||
|---|---|---|---|---|---|---|---|
| Quadrant | DetID | PixID | Counts | Sigma | Mean | Median | Sigma |
| A | 10 | 83 | 587544 | 4070.84 | 664 | 656 | 144.2 |
| A | 15 | 237 | 122027 | 841.87 | 664 | 656 | 144.2 |
| A | 12 | 189 | 60704 | 416.51 | 664 | 656 | 144.2 |
| B | 5 | 255 | 862919 | 6484.79 | 645 | 631 | 133.0 |
| B | 0 | 186 | 384181 | 2884.47 | 645 | 631 | 133.0 |
| B | 0 | 229 | 262916 | 1972.5 | 645 | 631 | 133.0 |
| C | 15 | 214 | 243948 | 1538.52 | 642 | 648 | 158.1 |
| C | 0 | 207 | 230898 | 1455.99 | 642 | 648 | 158.1 |
| C | 14 | 254 | 6755 | 38.61 | 642 | 648 | 158.1 |
| D | 1 | 52 | 1689547 | 10703.16 | 607 | 588 | 157.8 |
| D | 13 | 249 | 332640 | 2104.26 | 607 | 588 | 157.8 |
| D | 1 | 47 | 170308 | 1075.54 | 607 | 588 | 157.8 |
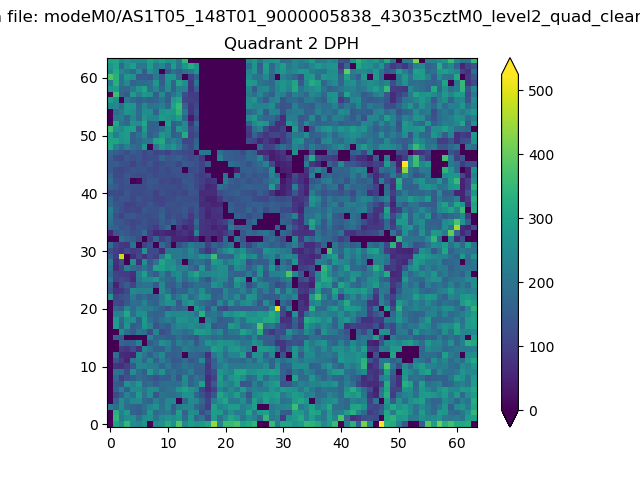
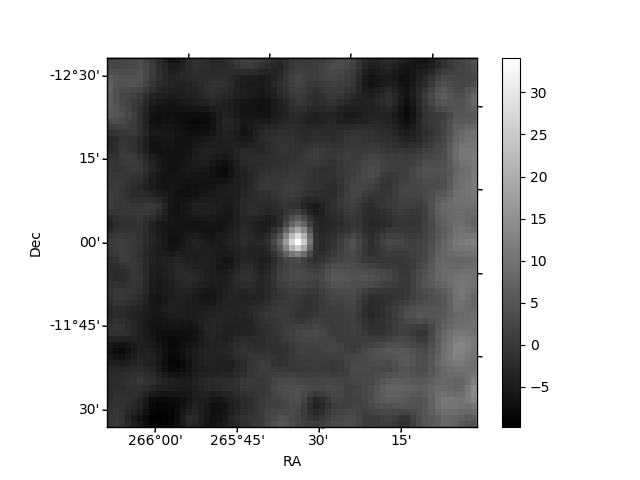
Histogram calculated using DETX and DETY for each event in the final _common_clean file
| Quadrant A |  |
 |
Quadrant B |
|---|---|---|---|
| Quadrant D | 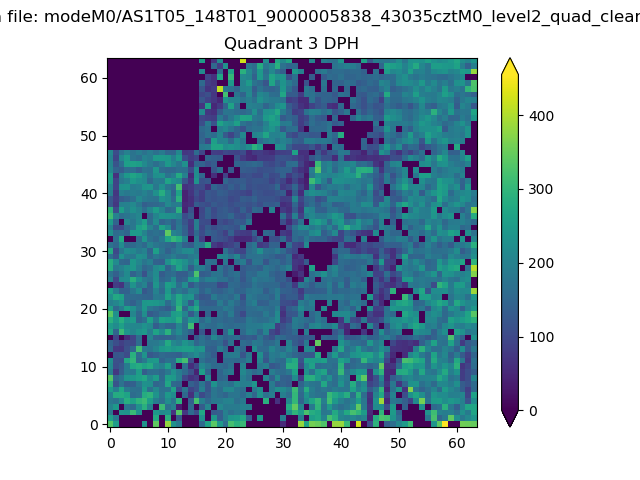 |
 |
Quadrant C |
| Plot type | Count rate plots | Images |
|---|---|---|
| Comparison with Poisson distribution Blue bars denote a histogram of data divided into 1 sec bins. Red curve is a Poisson curve with rate = median count rate of data. |
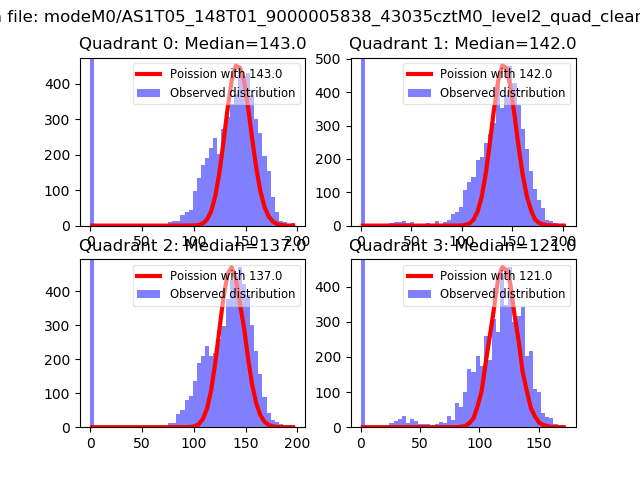 |
 |
| Quadrant-wise count rates Data is divided into 100 sec bins |
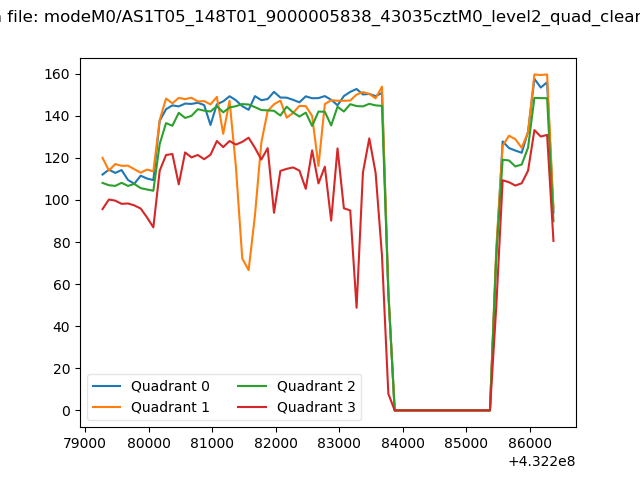 |
|
| Module-wise count rates for Quadrant A Data is divided into 100 sec bins |
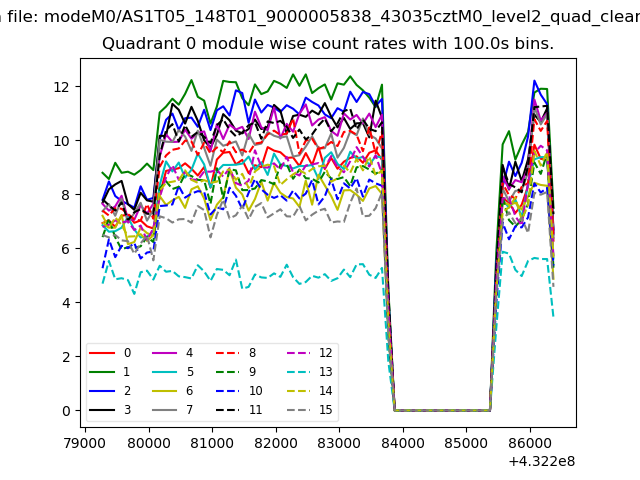 |
 |
| Module-wise count rates for Quadrant B Data is divided into 100 sec bins |
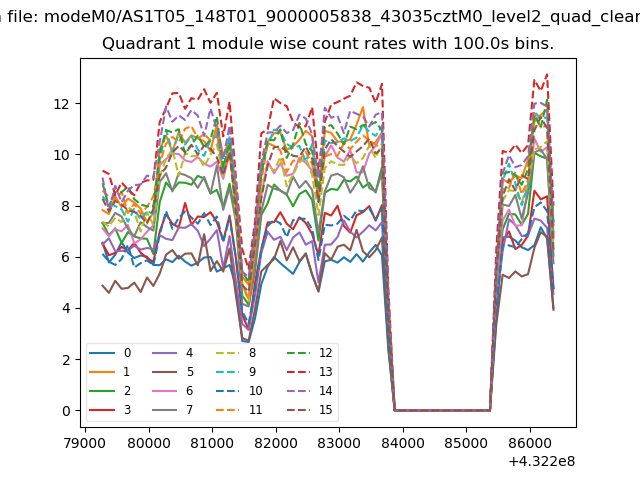 |
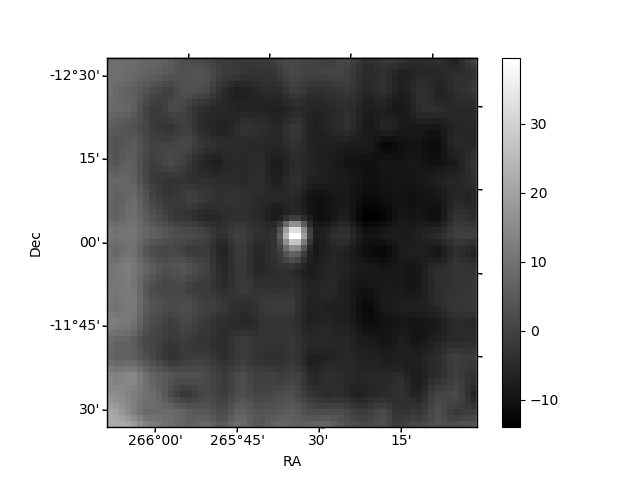 |
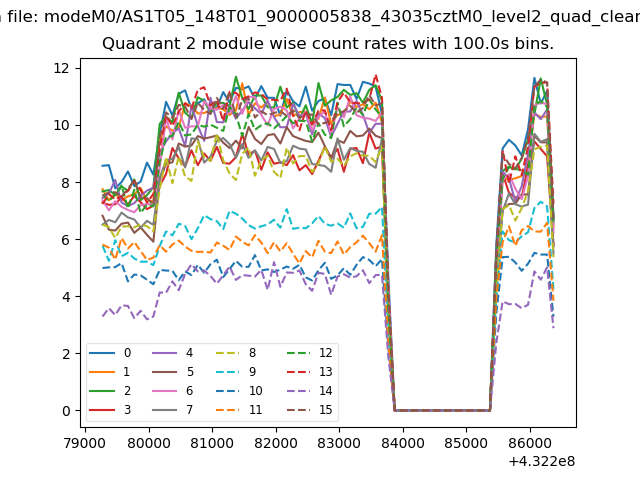
| Module-wise count rates for Quadrant C Data is divided into 100 sec bins |
 |
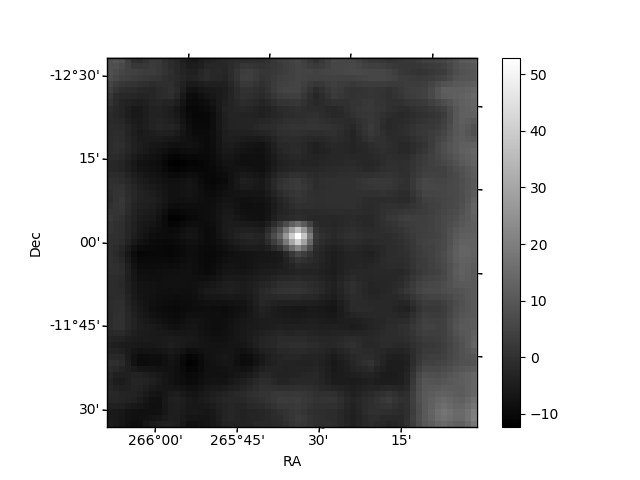 |
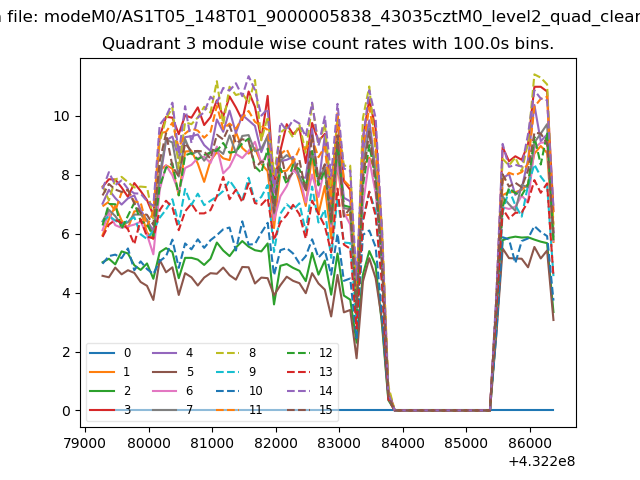
| Module-wise count rates for Quadrant D Data is divided into 100 sec bins |
 |
 |
| Parameter | Plot |
|---|---|
| CZT HV Monitor | 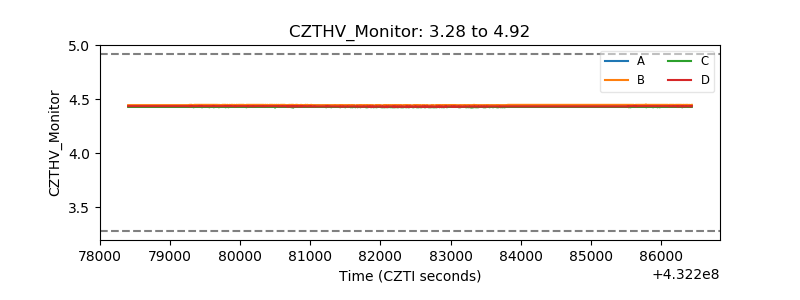 |
| D_VDD | 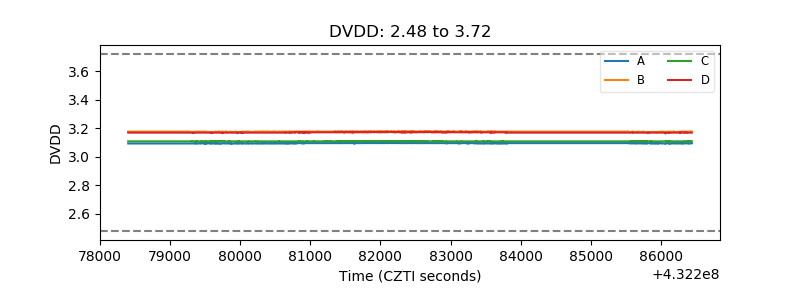 |
| Temperature 1 | 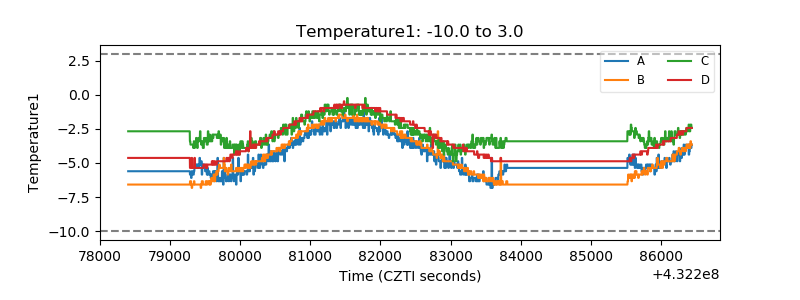 |
| Veto HV Monitor | 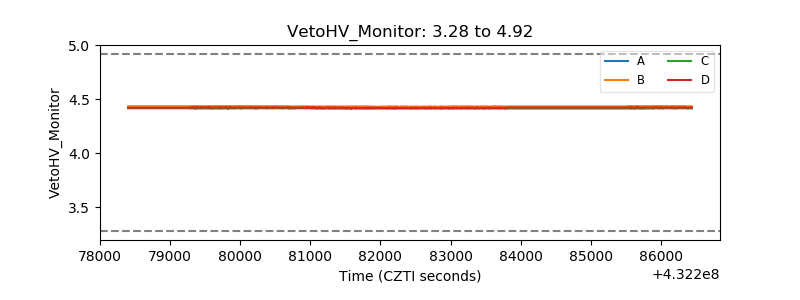 |
| Veto LLD | 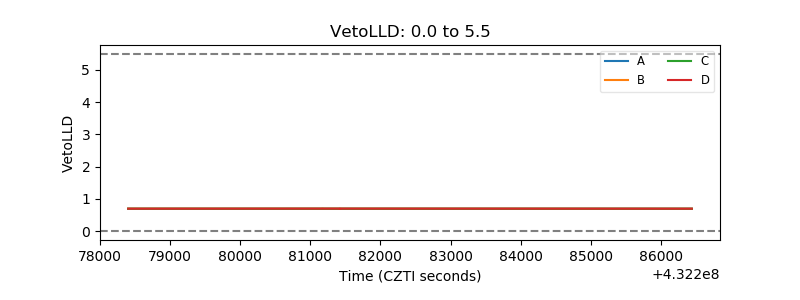 |
| Alpha Counter |  |
| _CPM_Rate |  |
| CZT Counter | 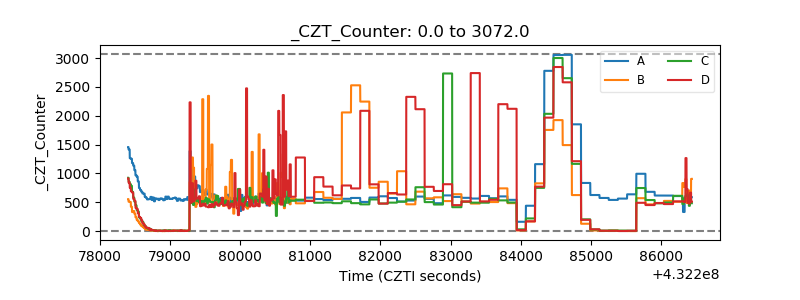 |
| +2.5 Volts monitor |  |
| +5 Volts monitor | 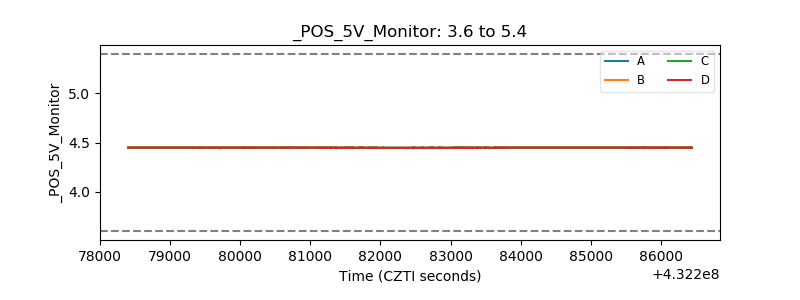 |
| _ROLL_ROT | 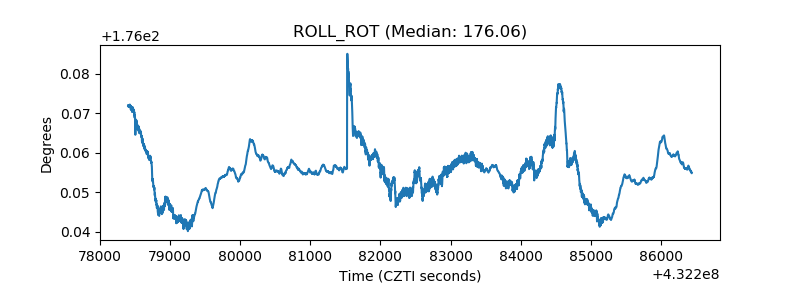 |
| _Roll_DEC | 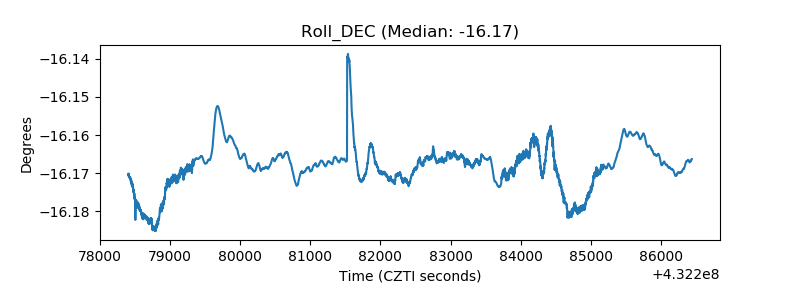 |
| _Roll_RA | 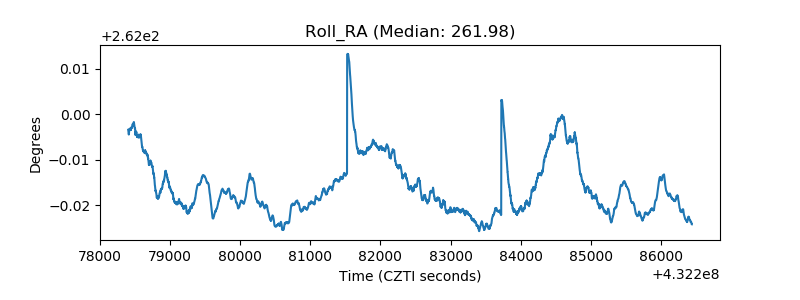 |
| Veto Counter | 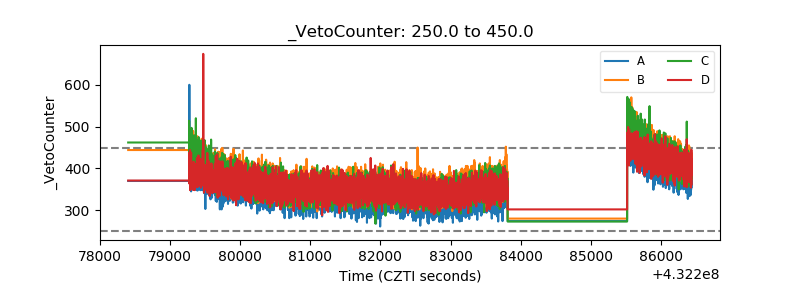 |