| Param | Original file | Final file |
|---|---|---|
| Filename | modeM0/AS1T05_148T01_9000005838_43037cztM0_level2.fits | modeM0/AS1T05_148T01_9000005838_43037cztM0_level2_quad_clean.evt |
| Size (bytes) | 458,075,520 | 107,435,520 |
| Size | 436.9 MB | 102.5 MB |
| Events in quadrant A | 3,397,153 | 796,949 |
| Events in quadrant B | 5,277,202 | 699,591 |
| Events in quadrant C | 2,874,988 | 768,877 |
| Events in quadrant D | 4,995,048 | 616,828 |
| Mode M9 | |||
|---|---|---|---|
| Quadrant | BADHDUFLAG | Total packets | Discarded packets |
| A | 0 | 25 | 0 |
| B | 0 | 26 | 0 |
| C | 0 | 26 | 0 |
| D | 0 | 26 | 0 |
| Mode SS | |||
|---|---|---|---|
| Quadrant | BADHDUFLAG | Total packets | Discarded packets |
| A | 0 | 108 | 0 |
| B | 0 | 108 | 0 |
| C | 0 | 108 | 0 |
| D | 0 | 108 | 0 |
| Mode M0 | |||
|---|---|---|---|
| Quadrant | BADHDUFLAG | Total packets | Discarded packets |
| A | 0 | 13575 | 2 |
| B | 0 | 19122 | 2 |
| C | 0 | 11527 | 2 |
| D | 0 | 18285 | 2 |
| Quadrant | Total seconds | Saturated seconds | Saturation percentage |
|---|---|---|---|
| A | 5304 | 37 | 0.697587% |
| B | 5304 | 870 | 16.402715% |
| C | 5304 | 9 | 0.169683% |
| D | 5304 | 690 | 13.009050% |
Noise dominated data is calculated using 1-second bins in cleaned event files. If a bin has >2000 counts, and if more than 50% of those come from <1% of pixels, then it is considered to be noise-dominated and hence unusable.
| Quadrant | # 1 sec bins | Bins with >0 counts | Bins with >2000 counts | High rate bins dominated by noise | Noise dominated (total time) | Noise dominated (detector-on time) | Marked lightcurve |
|---|---|---|---|---|---|---|---|
| A | 7156 | 5305 | 19 | 19 | 0.27% | 0.36% | 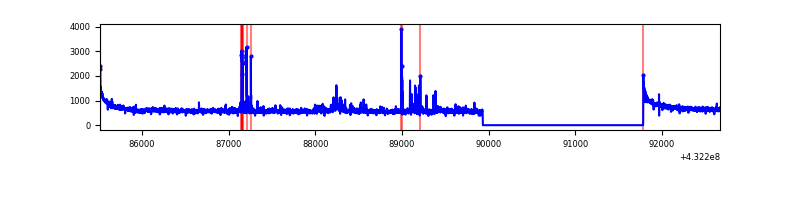 |
| B | 7156 | 5305 | 763 | 763 | 10.66% | 14.38% | 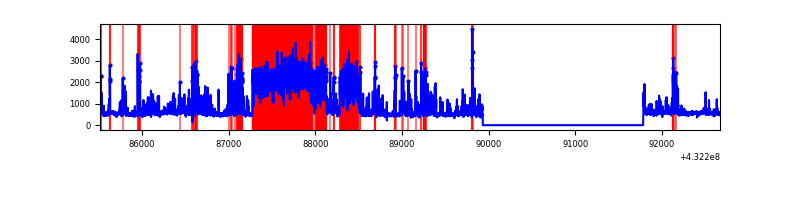 |
| C | 7156 | 5305 | 7 | 7 | 0.10% | 0.13% | 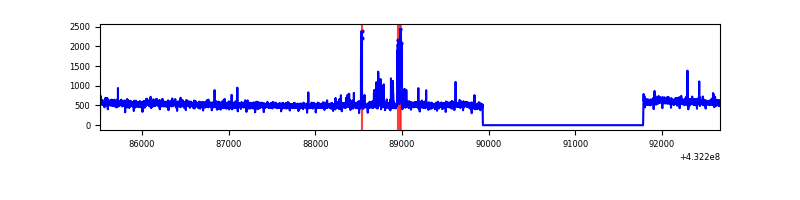 |
| D | 7156 | 5305 | 586 | 586 | 8.19% | 11.05% | 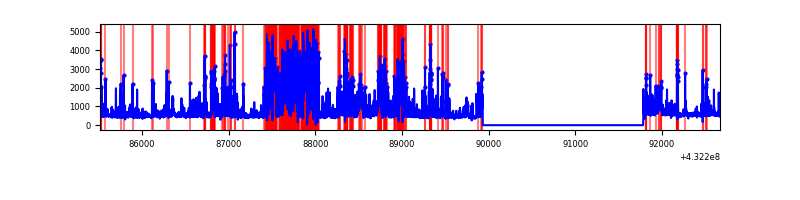 |
Top three noisy pixels from each quadrant. If the there are fewer than three noisy pixels in the level2.evt file, extra rows are filled as -1
| Pixel properties | Quadrant properties | ||||||
|---|---|---|---|---|---|---|---|
| Quadrant | DetID | PixID | Counts | Sigma | Mean | Median | Sigma |
| A | 10 | 83 | 595193 | 4054.37 | 673 | 663 | 146.6 |
| A | 12 | 189 | 119587 | 811.0 | 673 | 663 | 146.6 |
| A | 15 | 237 | 81382 | 550.46 | 673 | 663 | 146.6 |
| B | 0 | 186 | 1561631 | 11760.3 | 635 | 623 | 132.7 |
| B | 5 | 255 | 1065450 | 8022.18 | 635 | 623 | 132.7 |
| B | 0 | 189 | 93544 | 700.05 | 635 | 623 | 132.7 |
| C | 15 | 214 | 238071 | 1459.9 | 649 | 657 | 162.6 |
| C | 0 | 207 | 96890 | 591.75 | 649 | 657 | 162.6 |
| C | 14 | 254 | 6431 | 35.51 | 649 | 657 | 162.6 |
| D | 1 | 52 | 2152275 | 13698.37 | 605 | 588 | 157.1 |
| D | 13 | 249 | 364816 | 2318.8 | 605 | 588 | 157.1 |
| D | 1 | 47 | 68288 | 431.0 | 605 | 588 | 157.1 |
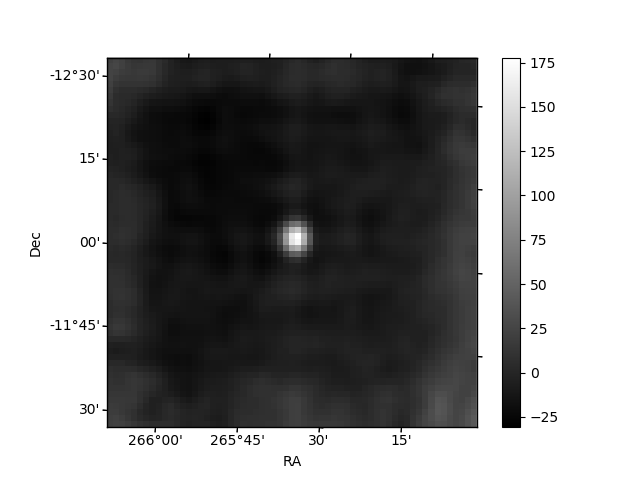
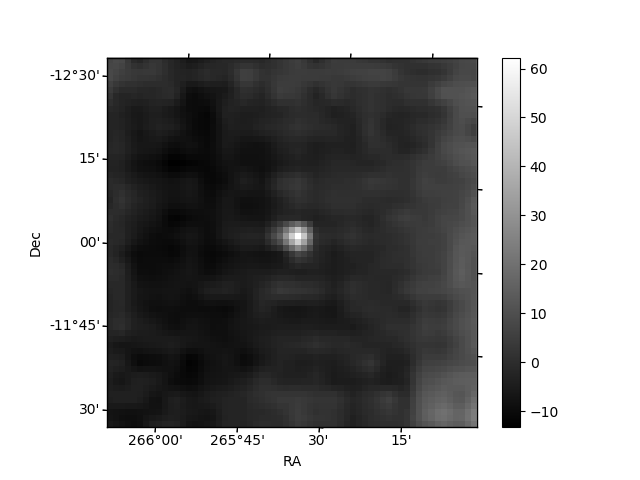
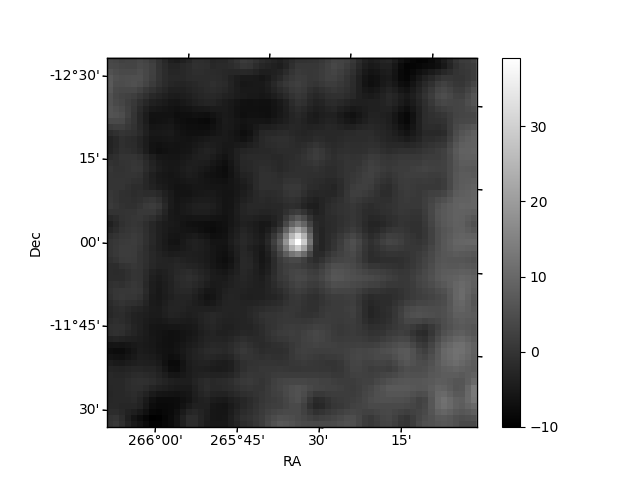
Histogram calculated using DETX and DETY for each event in the final _common_clean file
| Quadrant A | 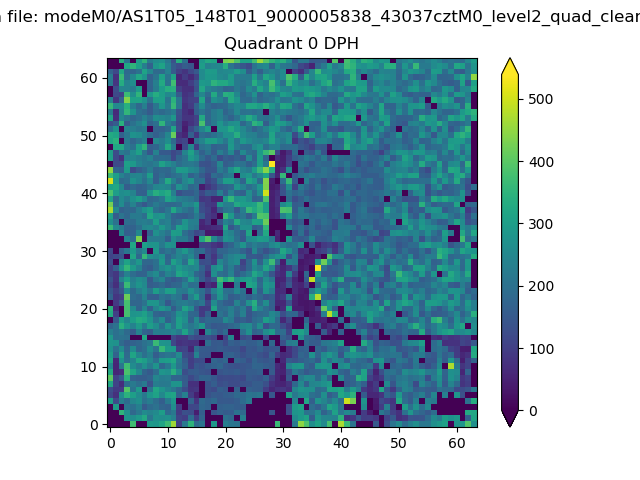 |
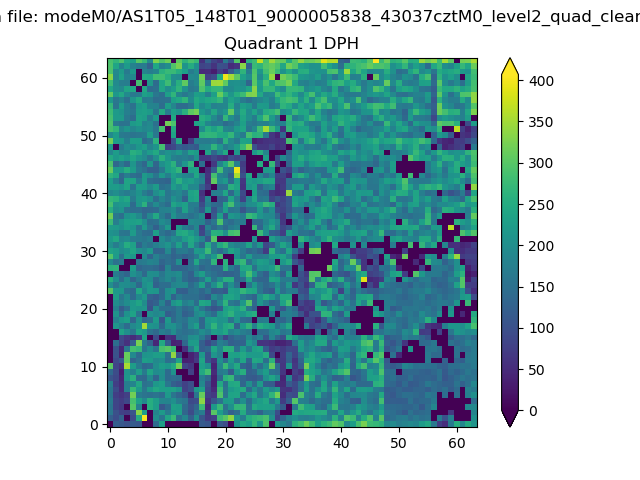 |
Quadrant B |
|---|---|---|---|
| Quadrant D | 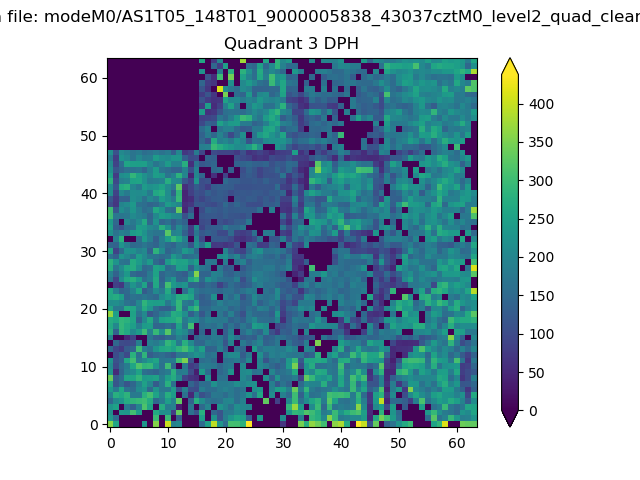 |
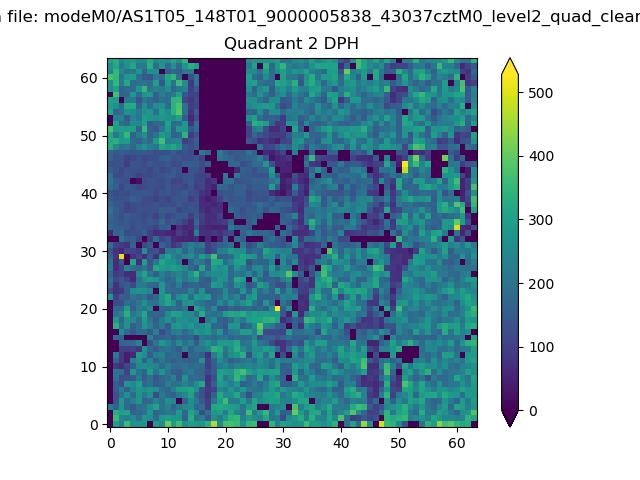 |
Quadrant C |
| Plot type | Count rate plots | Images |
|---|---|---|
| Comparison with Poisson distribution Blue bars denote a histogram of data divided into 1 sec bins. Red curve is a Poisson curve with rate = median count rate of data. |
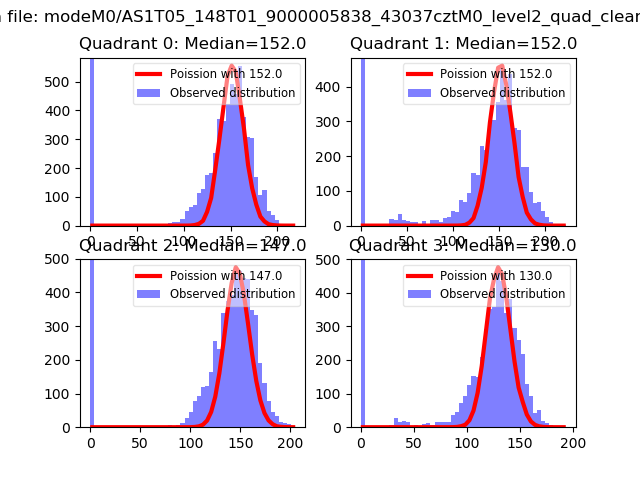 |
 |
| Quadrant-wise count rates Data is divided into 100 sec bins |
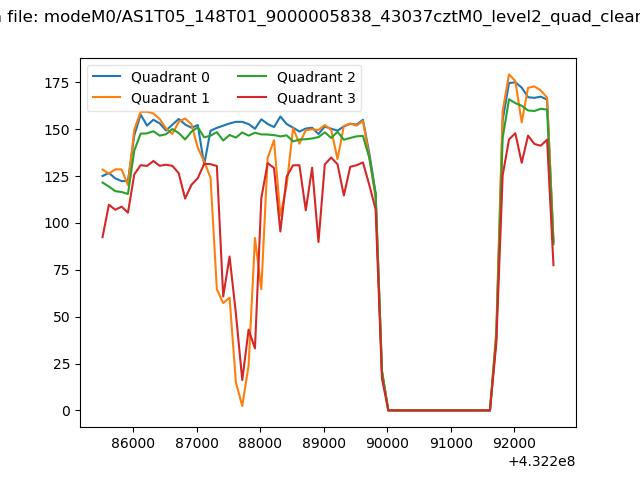 |
|
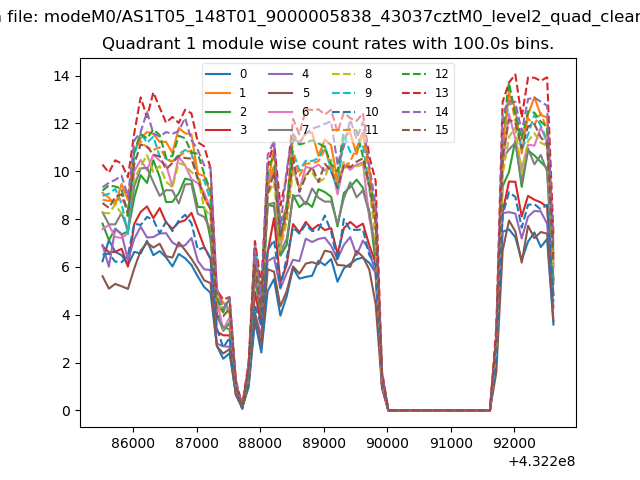
| Module-wise count rates for Quadrant A Data is divided into 100 sec bins |
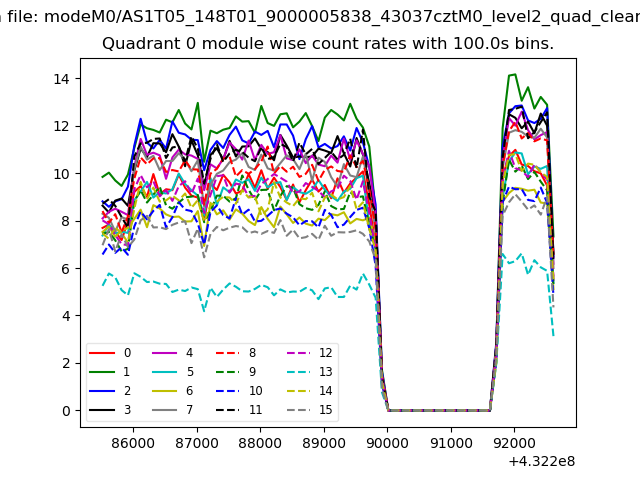 |
 |
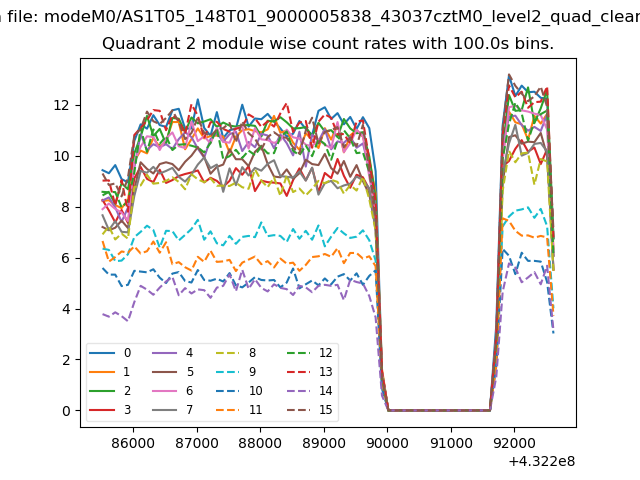
| Module-wise count rates for Quadrant B Data is divided into 100 sec bins |
 |
 |
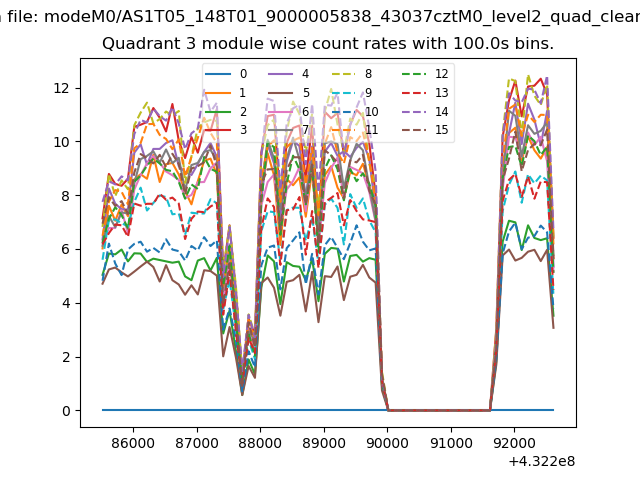
| Module-wise count rates for Quadrant C Data is divided into 100 sec bins |
 |
 |
| Module-wise count rates for Quadrant D Data is divided into 100 sec bins |
 |
 |
| Parameter | Plot |
|---|---|
| CZT HV Monitor | 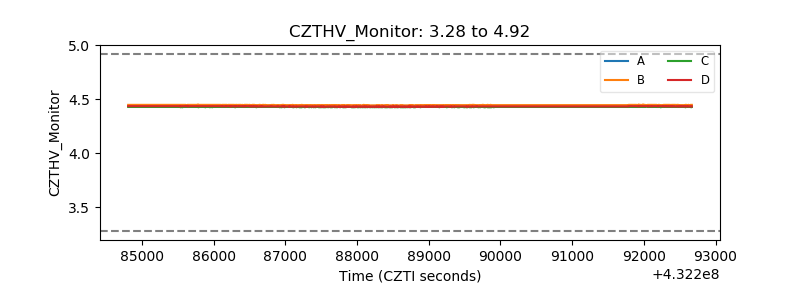 |
| D_VDD | 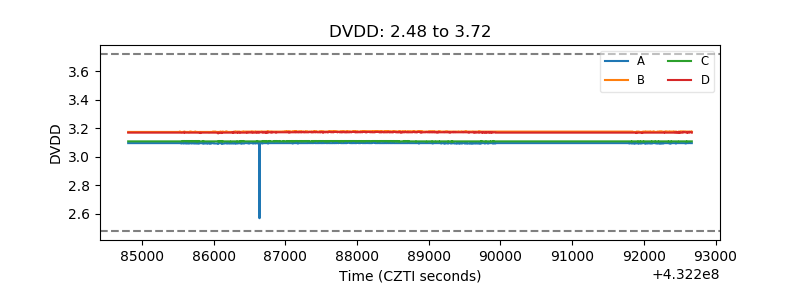 |
| Temperature 1 | 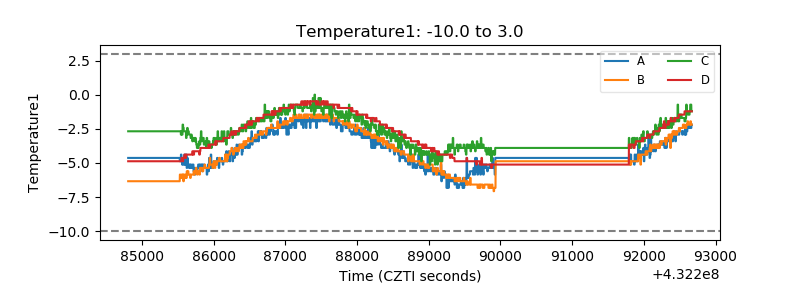 |
| Veto HV Monitor | 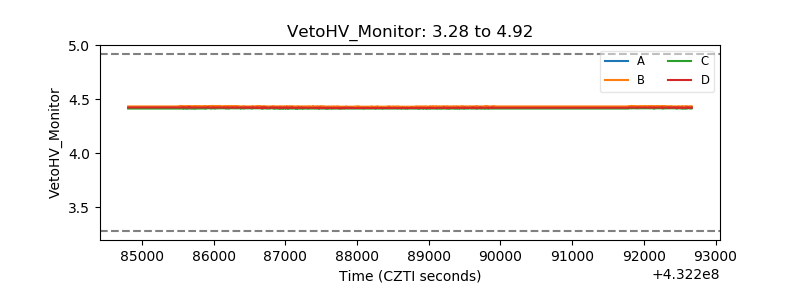 |
| Veto LLD | 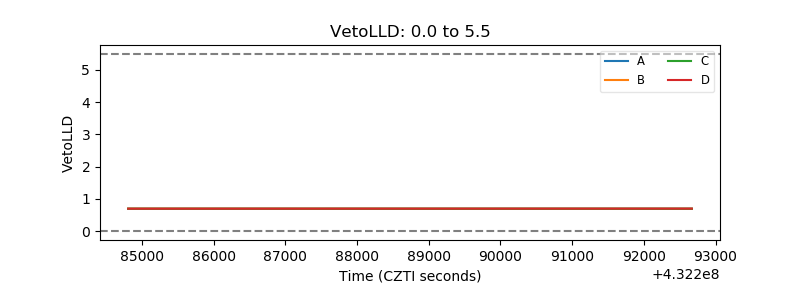 |
| Alpha Counter | 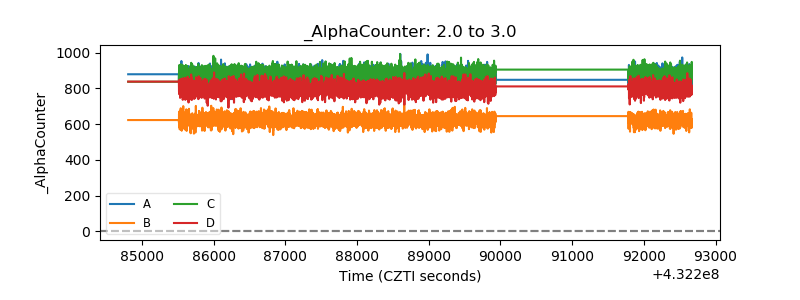 |
| _CPM_Rate | 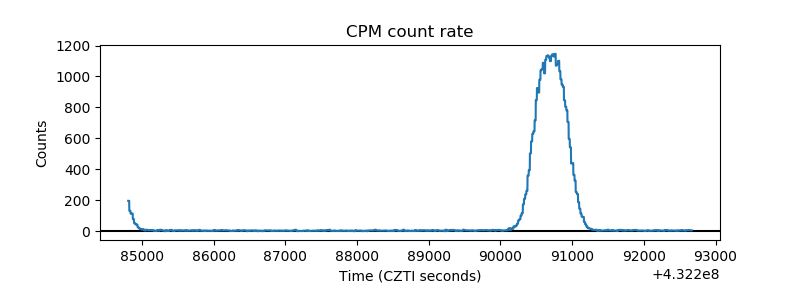 |
| CZT Counter | 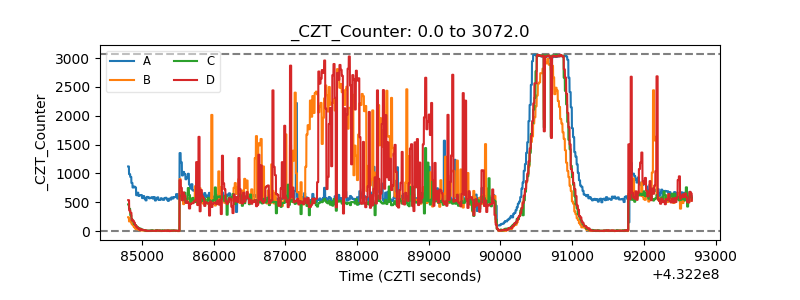 |
| +2.5 Volts monitor |  |
| +5 Volts monitor |  |
| _ROLL_ROT | 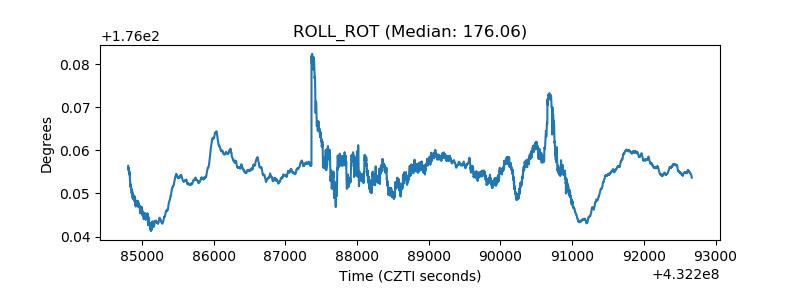 |
| _Roll_DEC | 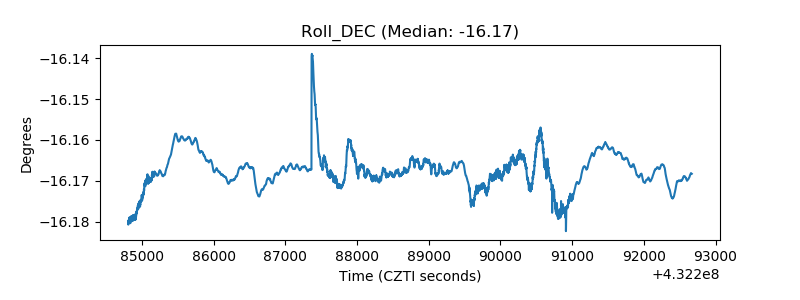 |
| _Roll_RA | 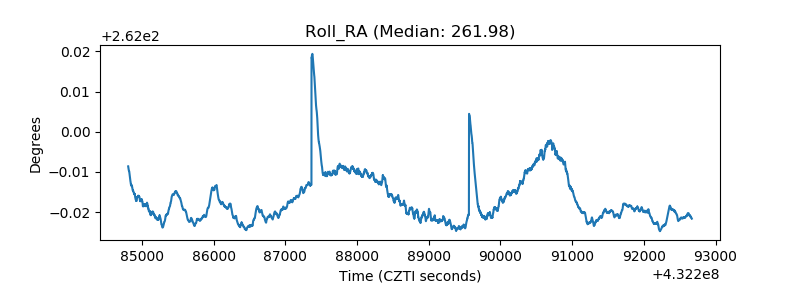 |
| Veto Counter | 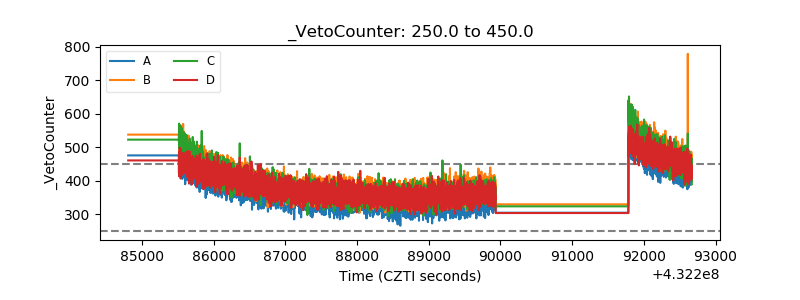 |