| Param | Original file | Final file |
|---|---|---|
| Filename | modeM0/AS1T05_148T01_9000005838_43038cztM0_level2.fits | modeM0/AS1T05_148T01_9000005838_43038cztM0_level2_quad_clean.evt |
| Size (bytes) | 406,958,400 | 111,775,680 |
| Size | 388.1 MB | 106.6 MB |
| Events in quadrant A | 3,475,355 | 807,867 |
| Events in quadrant B | 3,193,846 | 812,725 |
| Events in quadrant C | 2,805,613 | 776,079 |
| Events in quadrant D | 5,193,578 | 631,431 |
| Mode M9 | |||
|---|---|---|---|
| Quadrant | BADHDUFLAG | Total packets | Discarded packets |
| A | 0 | 22 | 0 |
| B | 0 | 23 | 0 |
| C | 0 | 23 | 0 |
| D | 0 | 23 | 0 |
| Mode SS | |||
|---|---|---|---|
| Quadrant | BADHDUFLAG | Total packets | Discarded packets |
| A | 0 | 104 | 0 |
| B | 0 | 104 | 0 |
| C | 0 | 104 | 0 |
| D | 0 | 104 | 0 |
| Mode M0 | |||
|---|---|---|---|
| Quadrant | BADHDUFLAG | Total packets | Discarded packets |
| A | 0 | 13775 | 7 |
| B | 0 | 12735 | 2 |
| C | 0 | 11348 | 2 |
| D | 0 | 18924 | 2 |
| Quadrant | Total seconds | Saturated seconds | Saturation percentage |
|---|---|---|---|
| A | 5094 | 92 | 1.806046% |
| B | 5094 | 76 | 1.491951% |
| C | 5094 | 24 | 0.471143% |
| D | 5094 | 711 | 13.957597% |
Noise dominated data is calculated using 1-second bins in cleaned event files. If a bin has >2000 counts, and if more than 50% of those come from <1% of pixels, then it is considered to be noise-dominated and hence unusable.
| Quadrant | # 1 sec bins | Bins with >0 counts | Bins with >2000 counts | High rate bins dominated by noise | Noise dominated (total time) | Noise dominated (detector-on time) | Marked lightcurve |
|---|---|---|---|---|---|---|---|
| A | 7066 | 5095 | 57 | 57 | 0.81% | 1.12% | 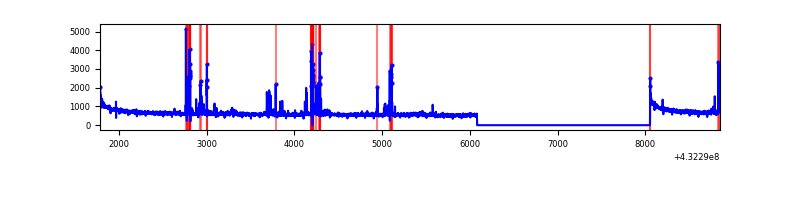 |
| B | 7066 | 5095 | 47 | 47 | 0.67% | 0.92% | 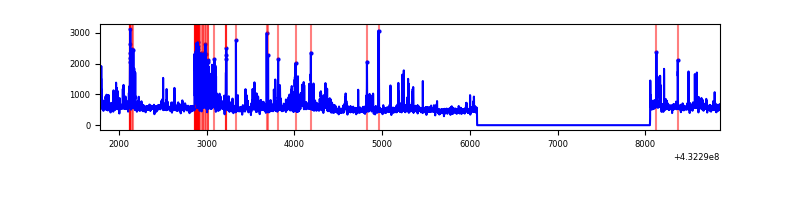 |
| C | 7066 | 5095 | 13 | 13 | 0.18% | 0.26% | 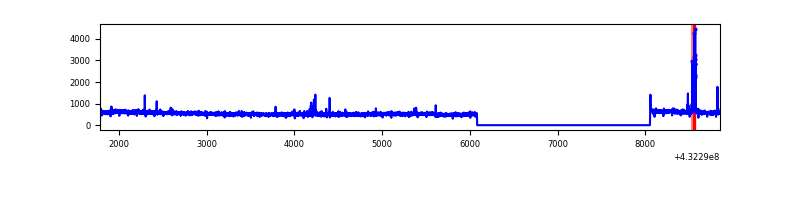 |
| D | 7066 | 5094 | 573 | 573 | 8.11% | 11.25% | 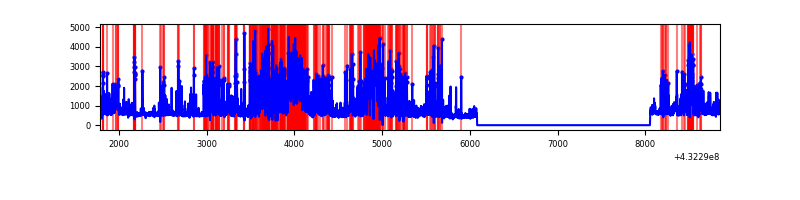 |
Top three noisy pixels from each quadrant. If the there are fewer than three noisy pixels in the level2.evt file, extra rows are filled as -1
| Pixel properties | Quadrant properties | ||||||
|---|---|---|---|---|---|---|---|
| Quadrant | DetID | PixID | Counts | Sigma | Mean | Median | Sigma |
| A | 10 | 83 | 588326 | 4002.51 | 666 | 657 | 146.8 |
| A | 15 | 237 | 256415 | 1741.92 | 666 | 657 | 146.8 |
| A | 12 | 189 | 66108 | 445.78 | 666 | 657 | 146.8 |
| B | 5 | 255 | 342414 | 2505.86 | 655 | 645 | 136.4 |
| B | 0 | 186 | 150424 | 1098.18 | 655 | 645 | 136.4 |
| B | 0 | 189 | 93676 | 682.11 | 655 | 645 | 136.4 |
| C | 15 | 214 | 228825 | 1420.02 | 639 | 646 | 160.7 |
| C | 14 | 254 | 64650 | 398.31 | 639 | 646 | 160.7 |
| C | 0 | 207 | 15278 | 91.06 | 639 | 646 | 160.7 |
| D | 1 | 52 | 1524090 | 9648.02 | 606 | 589 | 157.9 |
| D | 13 | 249 | 693746 | 4389.62 | 606 | 589 | 157.9 |
| D | 12 | 233 | 425068 | 2688.14 | 606 | 589 | 157.9 |
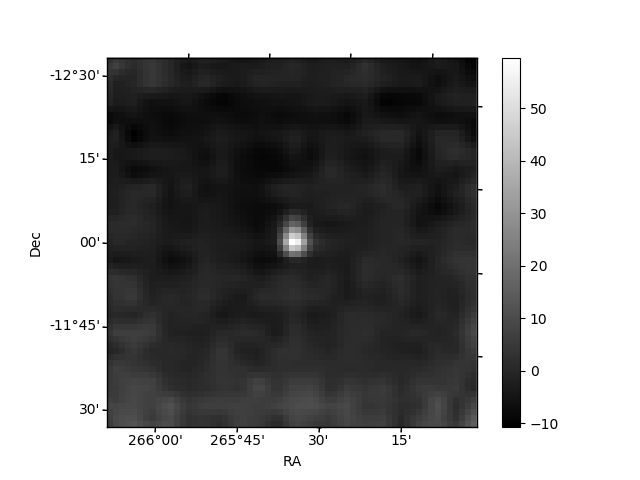
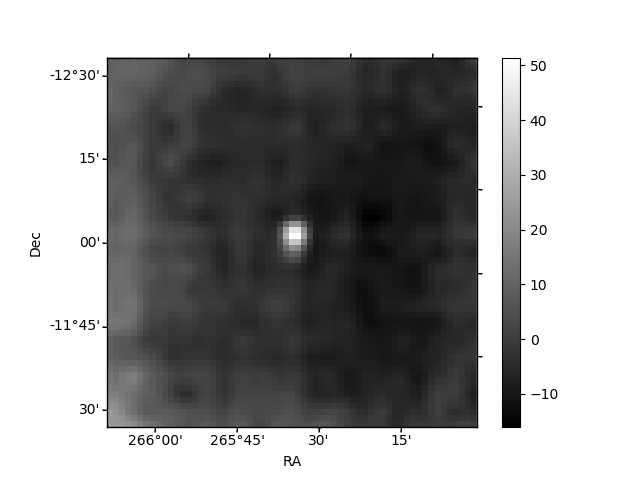
Histogram calculated using DETX and DETY for each event in the final _common_clean file
| Quadrant A |  |
 |
Quadrant B |
|---|---|---|---|
| Quadrant D |  |
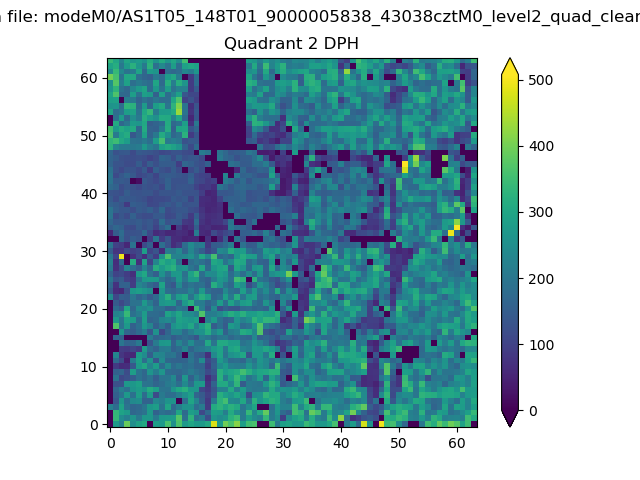 |
Quadrant C |
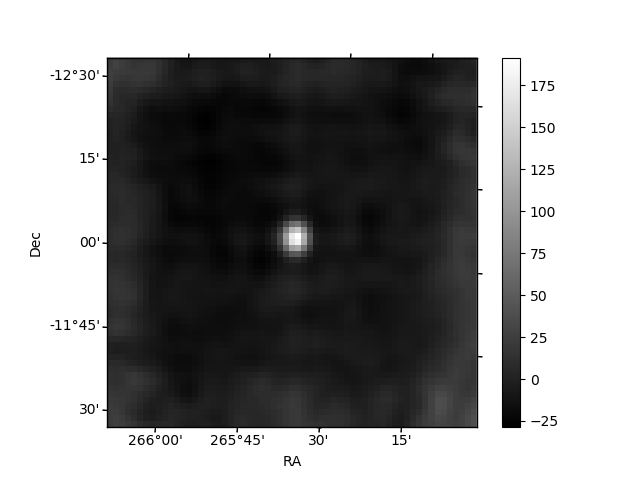
| Plot type | Count rate plots | Images |
|---|---|---|
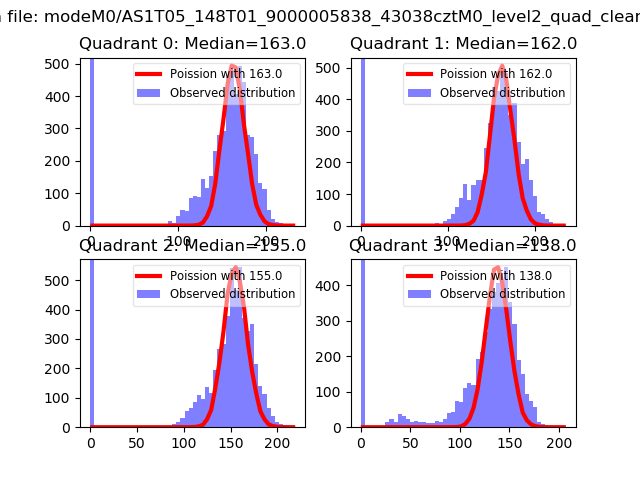
| Comparison with Poisson distribution Blue bars denote a histogram of data divided into 1 sec bins. Red curve is a Poisson curve with rate = median count rate of data. |
 |
 |
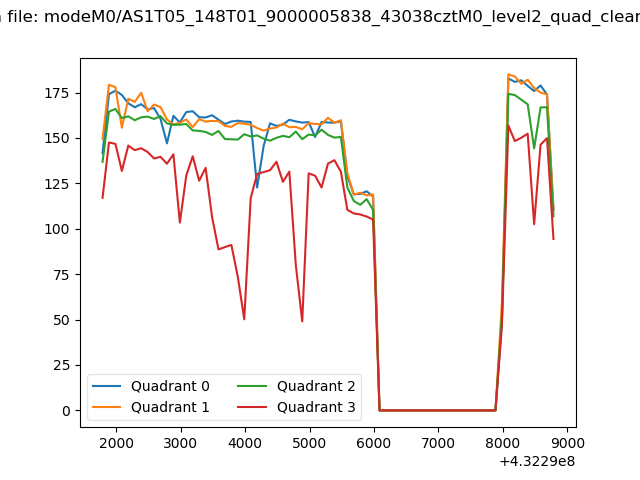
| Quadrant-wise count rates Data is divided into 100 sec bins |
 |
|
| Module-wise count rates for Quadrant A Data is divided into 100 sec bins |
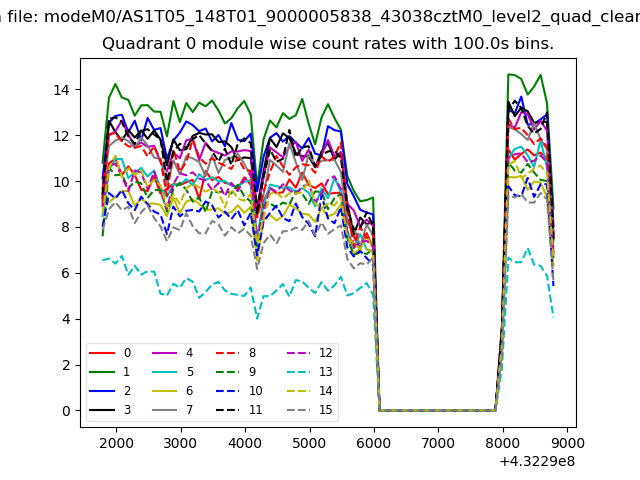 |
 |
| Module-wise count rates for Quadrant B Data is divided into 100 sec bins |
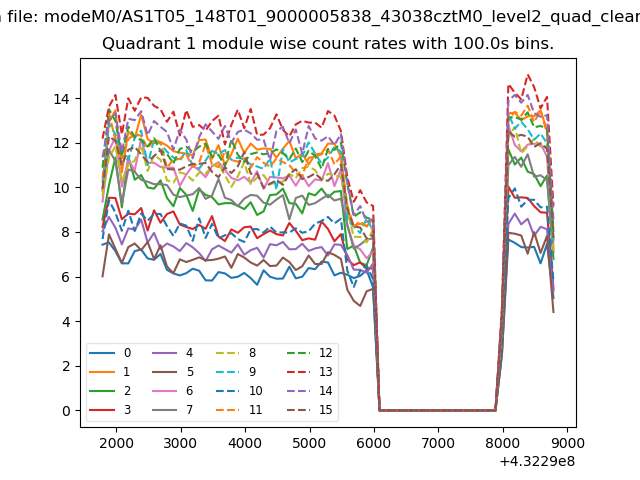 |
 |
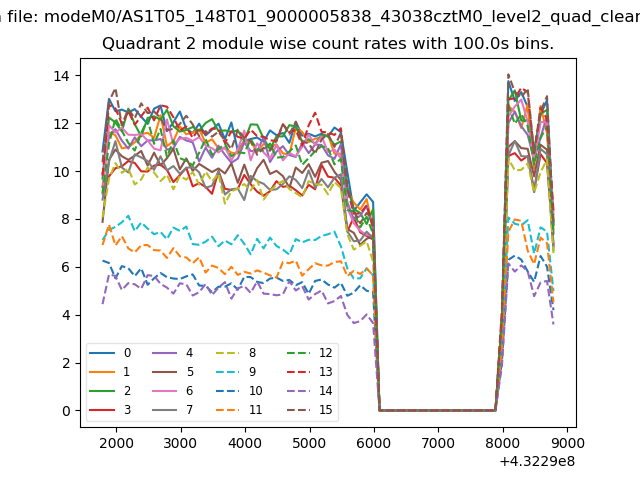
| Module-wise count rates for Quadrant C Data is divided into 100 sec bins |
 |
 |
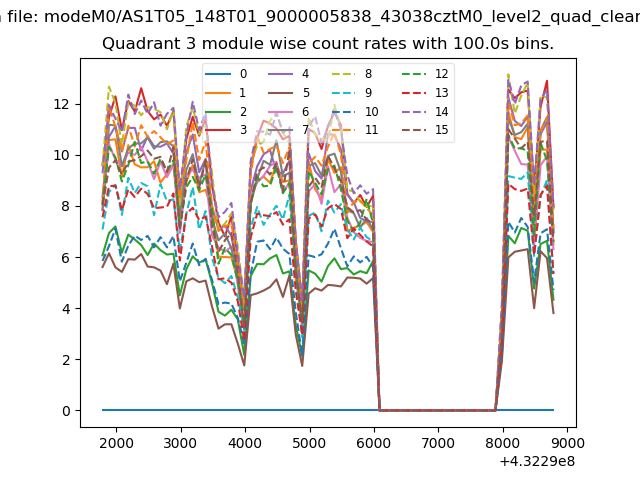
| Module-wise count rates for Quadrant D Data is divided into 100 sec bins |
 |
 |
| Parameter | Plot |
|---|---|
| CZT HV Monitor | 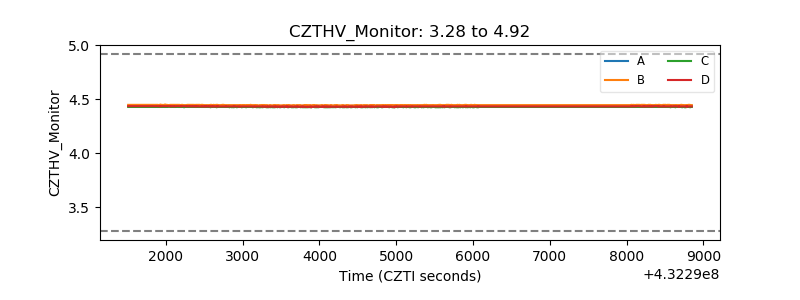 |
| D_VDD | 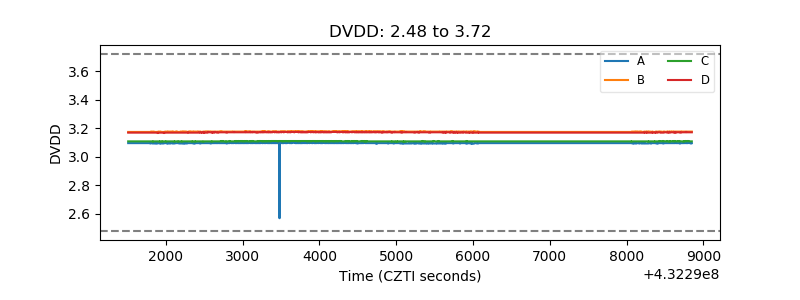 |
| Temperature 1 | 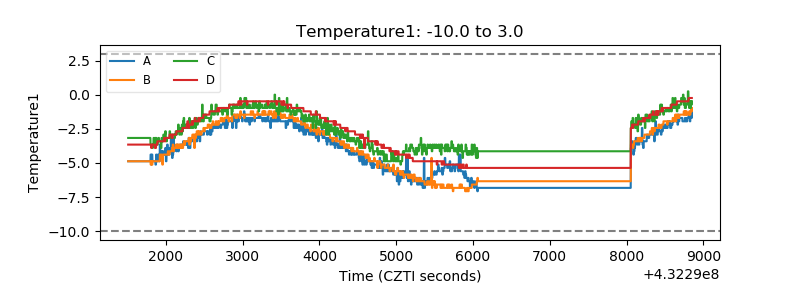 |
| Veto HV Monitor | 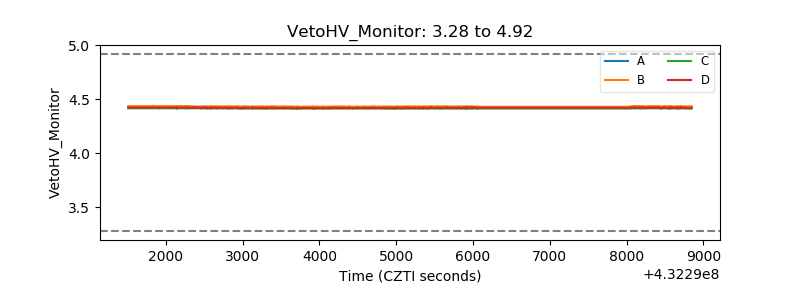 |
| Veto LLD | 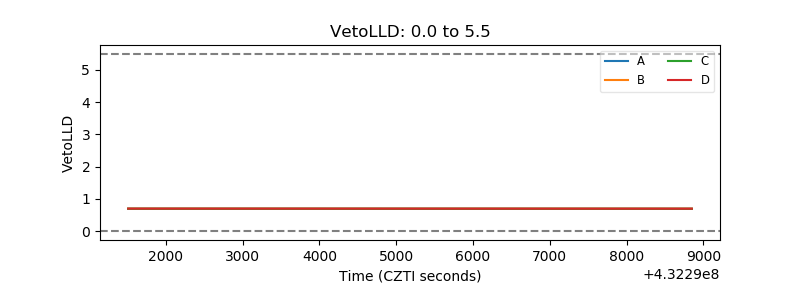 |
| Alpha Counter | 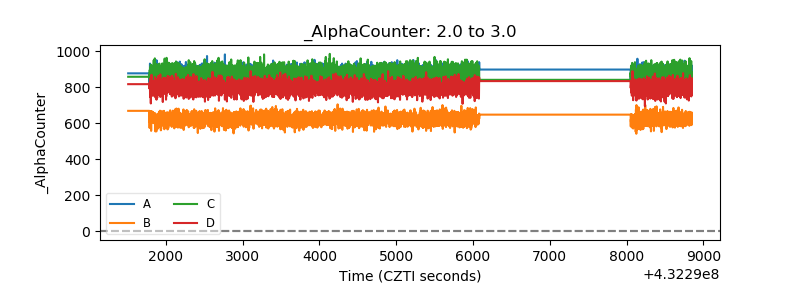 |
| _CPM_Rate |  |
| CZT Counter | 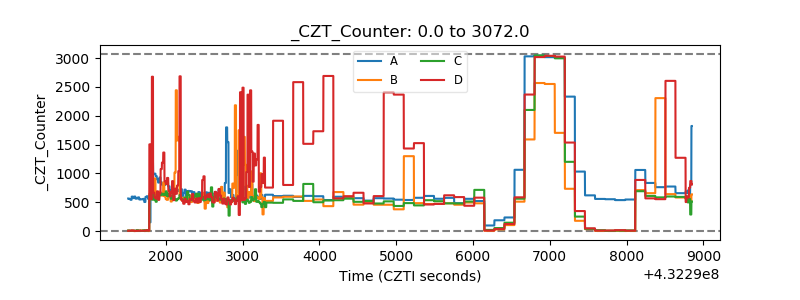 |
| +2.5 Volts monitor |  |
| +5 Volts monitor |  |
| _ROLL_ROT | 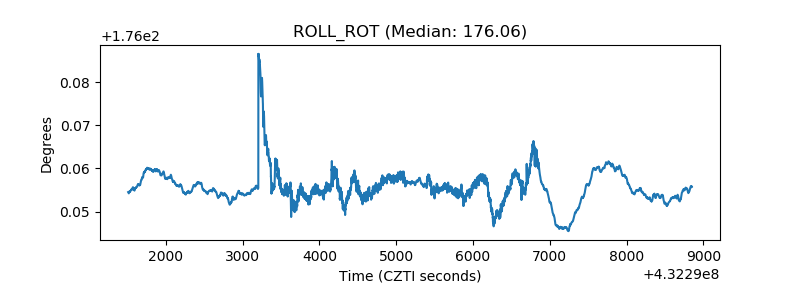 |
| _Roll_DEC | 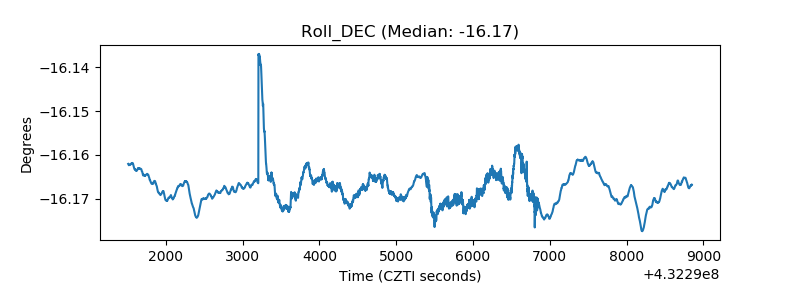 |
| _Roll_RA | 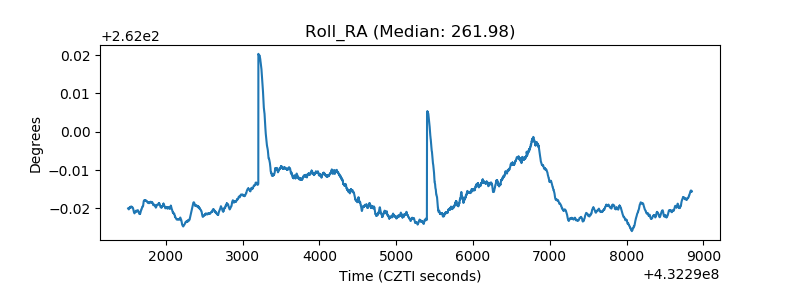 |
| Veto Counter | 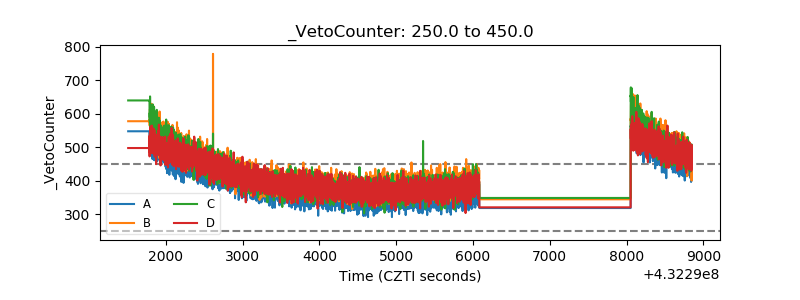 |