| Param | Original file | Final file |
|---|---|---|
| Filename | modeM0/AS1T05_148T01_9000005838_43041cztM0_level2.fits | modeM0/AS1T05_148T01_9000005838_43041cztM0_level2_quad_clean.evt |
| Size (bytes) | 398,839,680 | 99,135,360 |
| Size | 380.4 MB | 94.5 MB |
| Events in quadrant A | 3,208,800 | 704,501 |
| Events in quadrant B | 3,680,063 | 693,665 |
| Events in quadrant C | 2,581,467 | 686,159 |
| Events in quadrant D | 4,903,573 | 566,149 |
| Mode M9 | |||
|---|---|---|---|
| Quadrant | BADHDUFLAG | Total packets | Discarded packets |
| A | 0 | 21 | 0 |
| B | 0 | 21 | 0 |
| C | 0 | 21 | 0 |
| D | 0 | 21 | 0 |
| Mode SS | |||
|---|---|---|---|
| Quadrant | BADHDUFLAG | Total packets | Discarded packets |
| A | 0 | 102 | 0 |
| B | 0 | 102 | 0 |
| C | 0 | 102 | 0 |
| D | 0 | 102 | 0 |
| Mode M0 | |||
|---|---|---|---|
| Quadrant | BADHDUFLAG | Total packets | Discarded packets |
| A | 0 | 12685 | 1 |
| B | 0 | 14358 | 1 |
| C | 0 | 10471 | 1 |
| D | 0 | 17984 | 1 |
| Quadrant | Total seconds | Saturated seconds | Saturation percentage |
|---|---|---|---|
| A | 5014 | 107 | 2.134025% |
| B | 5014 | 214 | 4.268049% |
| C | 5015 | 1 | 0.019940% |
| D | 5015 | 587 | 11.704885% |
Noise dominated data is calculated using 1-second bins in cleaned event files. If a bin has >2000 counts, and if more than 50% of those come from <1% of pixels, then it is considered to be noise-dominated and hence unusable.
| Quadrant | # 1 sec bins | Bins with >0 counts | Bins with >2000 counts | High rate bins dominated by noise | Noise dominated (total time) | Noise dominated (detector-on time) | Marked lightcurve |
|---|---|---|---|---|---|---|---|
| A | 7106 | 5015 | 79 | 79 | 1.11% | 1.58% | 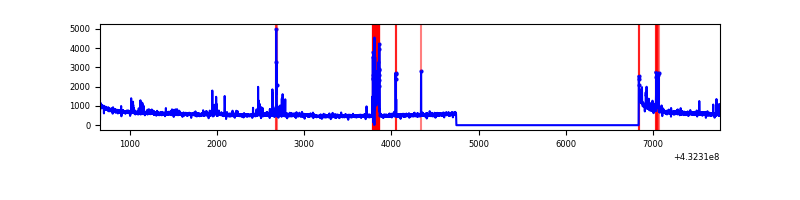 |
| B | 7106 | 5015 | 171 | 171 | 2.41% | 3.41% | 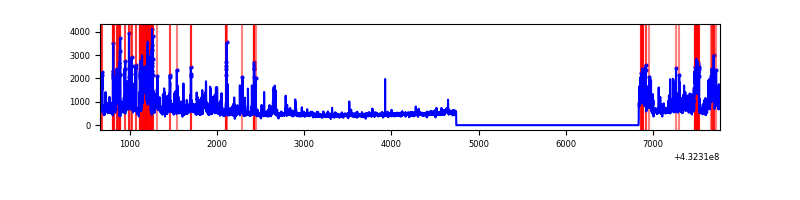 |
| C | 7107 | 5016 | 0 | 0 | 0.00% | 0.00% | 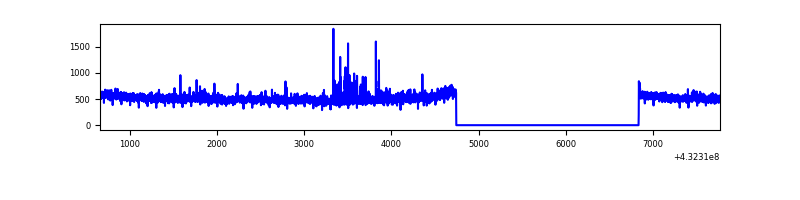 |
| D | 7107 | 5016 | 502 | 502 | 7.06% | 10.01% | 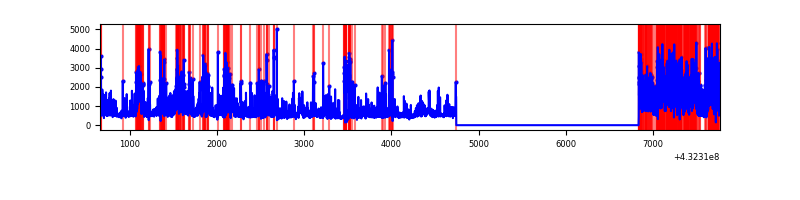 |
Top three noisy pixels from each quadrant. If the there are fewer than three noisy pixels in the level2.evt file, extra rows are filled as -1
| Pixel properties | Quadrant properties | ||||||
|---|---|---|---|---|---|---|---|
| Quadrant | DetID | PixID | Counts | Sigma | Mean | Median | Sigma |
| A | 10 | 83 | 555374 | 4291.7 | 594 | 585 | 129.3 |
| A | 15 | 237 | 281243 | 2171.1 | 594 | 585 | 129.3 |
| A | 12 | 189 | 57479 | 440.12 | 594 | 585 | 129.3 |
| B | 0 | 186 | 717753 | 5991.81 | 591 | 579 | 119.7 |
| B | 0 | 189 | 189441 | 1577.89 | 591 | 579 | 119.7 |
| B | 5 | 255 | 173936 | 1448.35 | 591 | 579 | 119.7 |
| C | 15 | 214 | 221164 | 1545.21 | 579 | 587 | 142.7 |
| C | 2 | 16 | 46120 | 318.97 | 579 | 587 | 142.7 |
| C | 0 | 207 | 44688 | 308.94 | 579 | 587 | 142.7 |
| D | 1 | 52 | 1947986 | 13911.01 | 549 | 535 | 140.0 |
| D | 10 | 118 | 640275 | 4569.78 | 549 | 535 | 140.0 |
| D | 12 | 233 | 72355 | 513.02 | 549 | 535 | 140.0 |
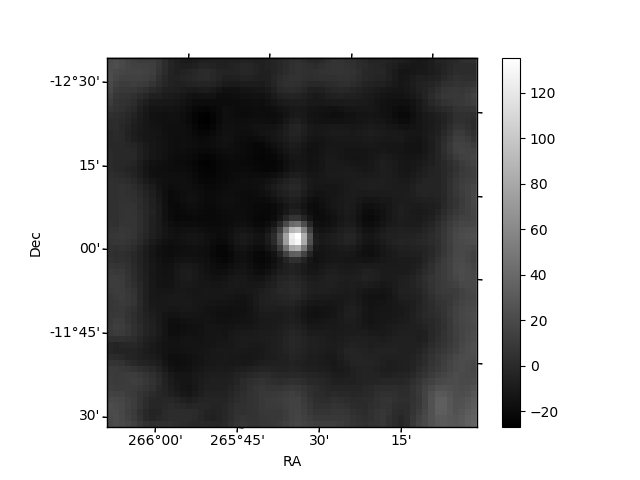
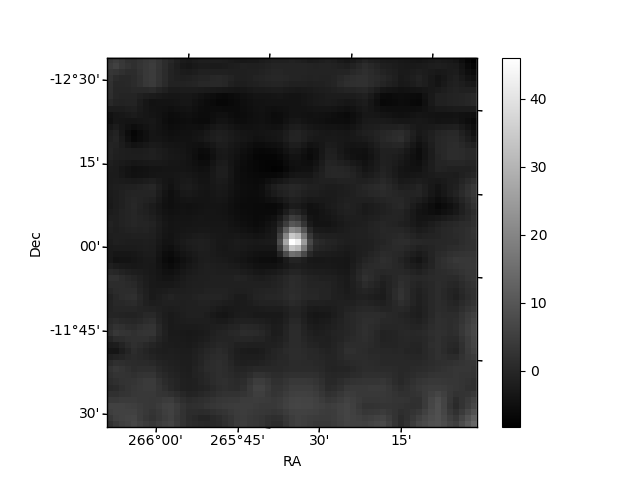
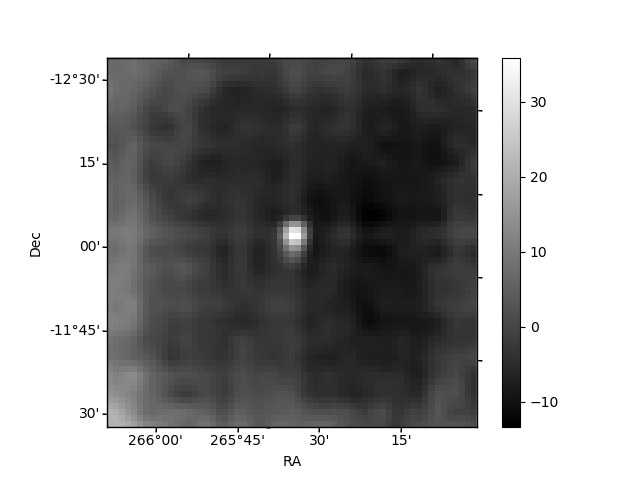
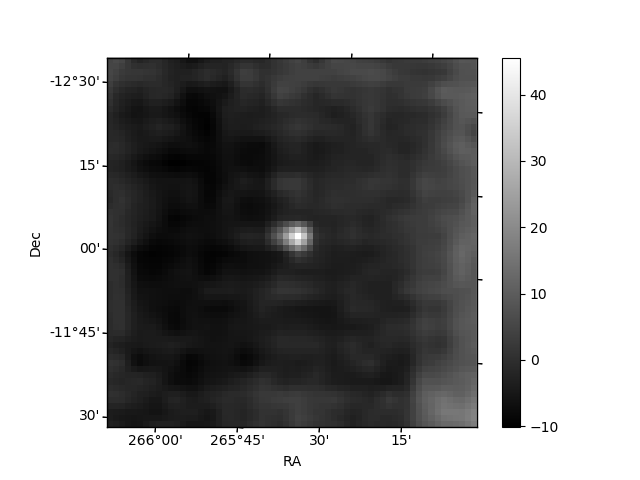
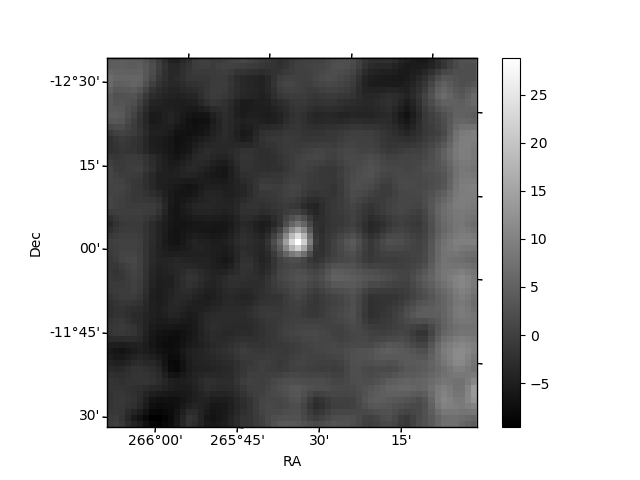
Histogram calculated using DETX and DETY for each event in the final _common_clean file
| Quadrant A | 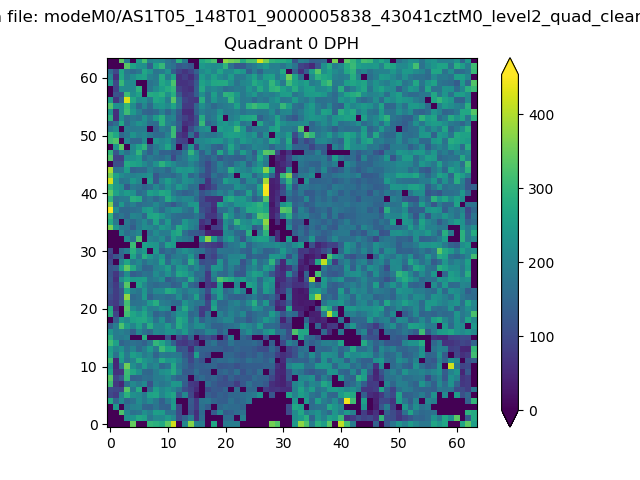 |
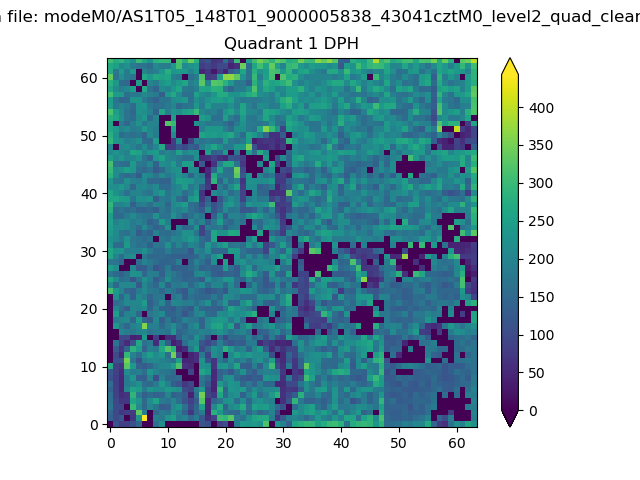 |
Quadrant B |
|---|---|---|---|
| Quadrant D | 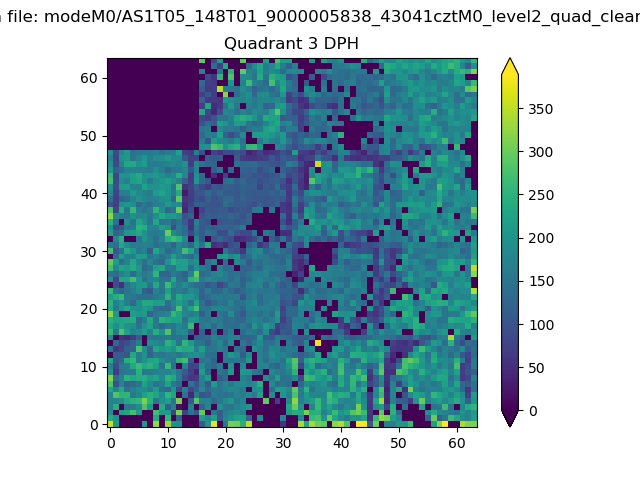 |
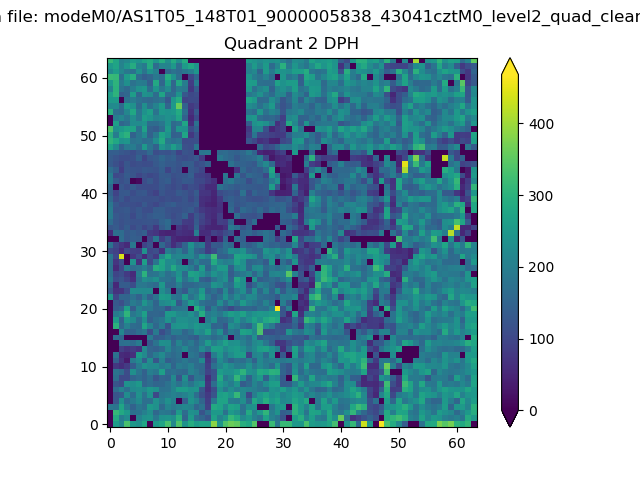 |
Quadrant C |
| Plot type | Count rate plots | Images |
|---|---|---|
| Comparison with Poisson distribution Blue bars denote a histogram of data divided into 1 sec bins. Red curve is a Poisson curve with rate = median count rate of data. |
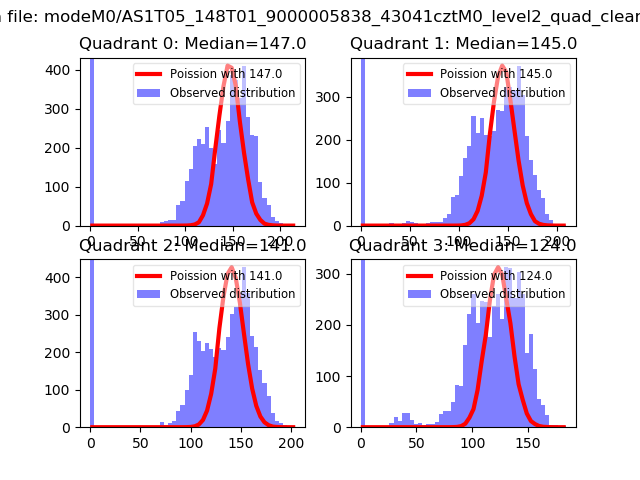 |
 |
| Quadrant-wise count rates Data is divided into 100 sec bins |
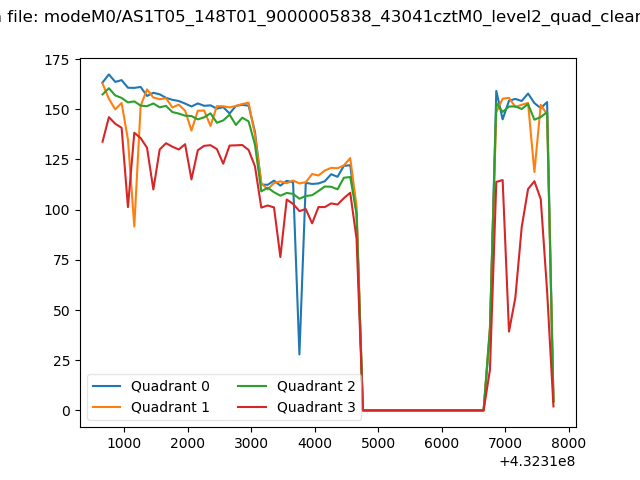 |
|
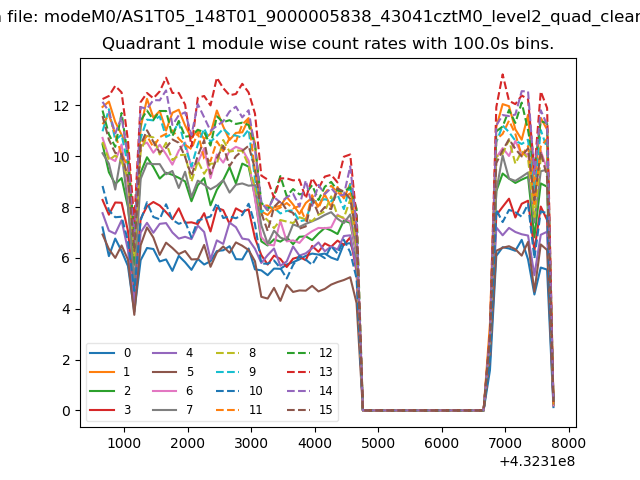
| Module-wise count rates for Quadrant A Data is divided into 100 sec bins |
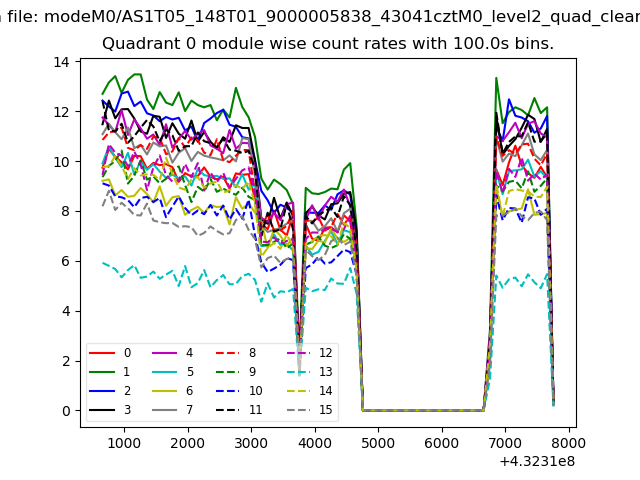 |
 |
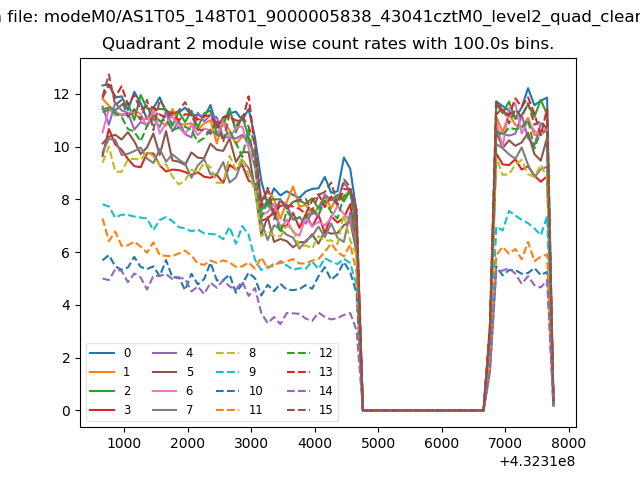
| Module-wise count rates for Quadrant B Data is divided into 100 sec bins |
 |
 |
| Module-wise count rates for Quadrant C Data is divided into 100 sec bins |
 |
 |
| Module-wise count rates for Quadrant D Data is divided into 100 sec bins |
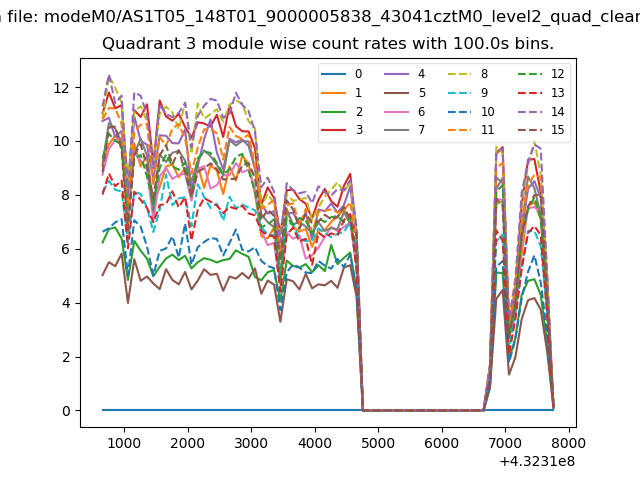 |
 |
| Parameter | Plot |
|---|---|
| CZT HV Monitor | 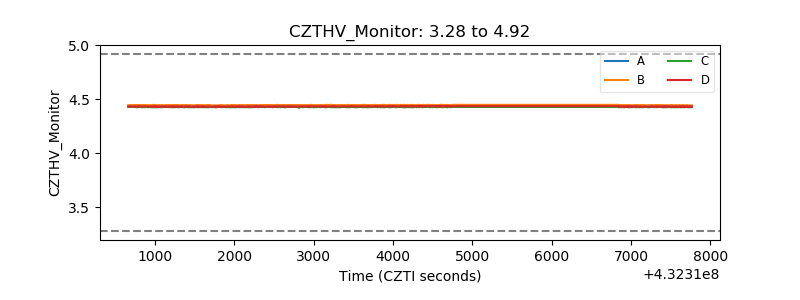 |
| D_VDD | 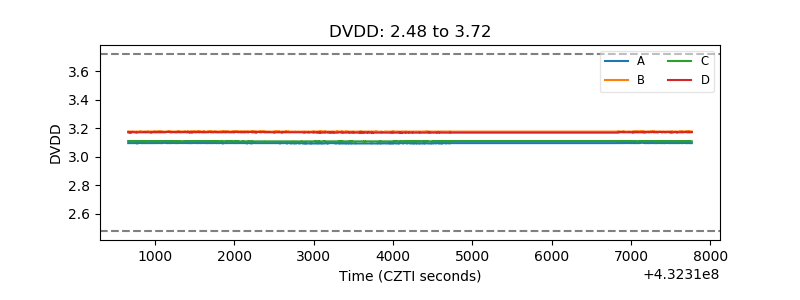 |
| Temperature 1 | 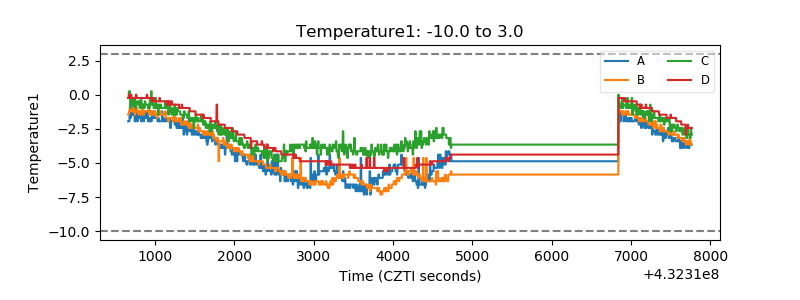 |
| Veto HV Monitor | 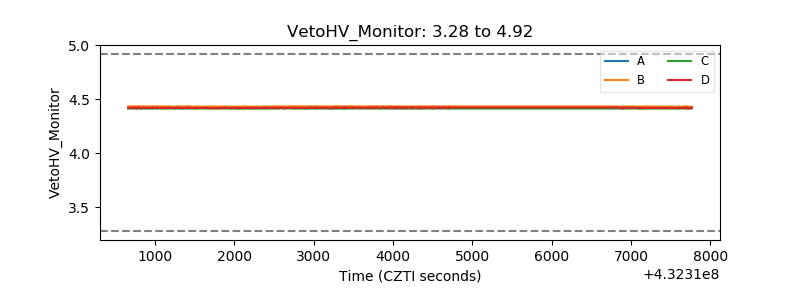 |
| Veto LLD | 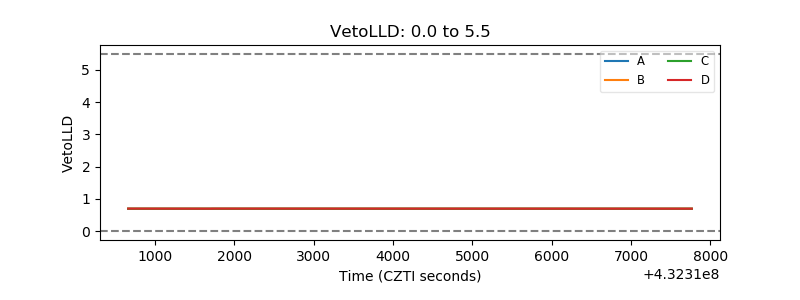 |
| Alpha Counter | 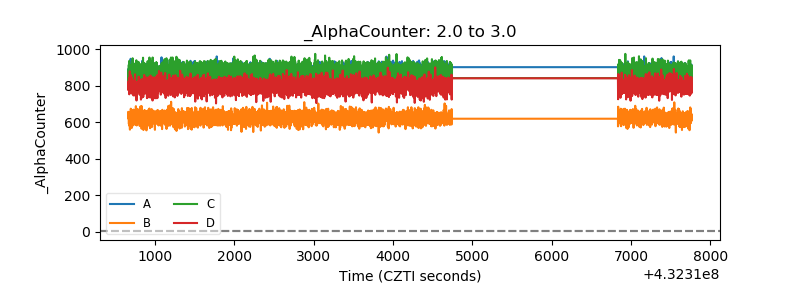 |
| _CPM_Rate | 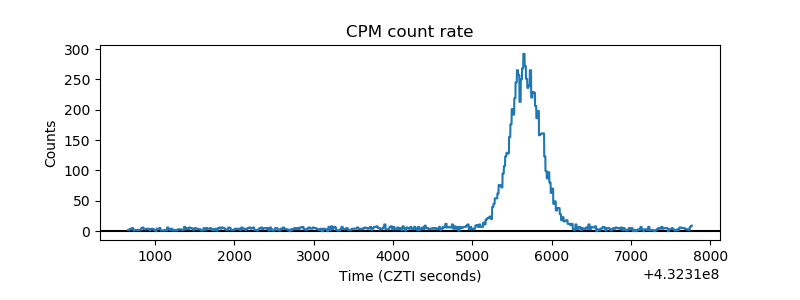 |
| CZT Counter | 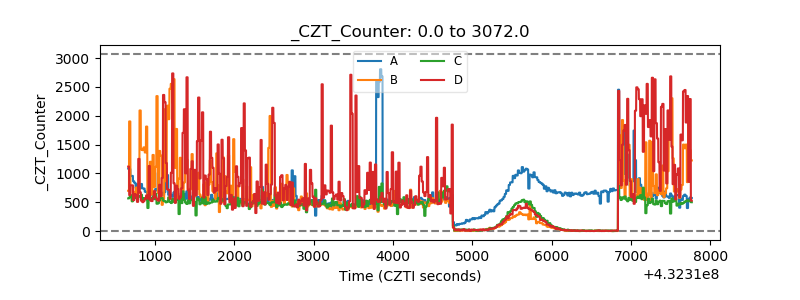 |
| +2.5 Volts monitor |  |
| +5 Volts monitor | 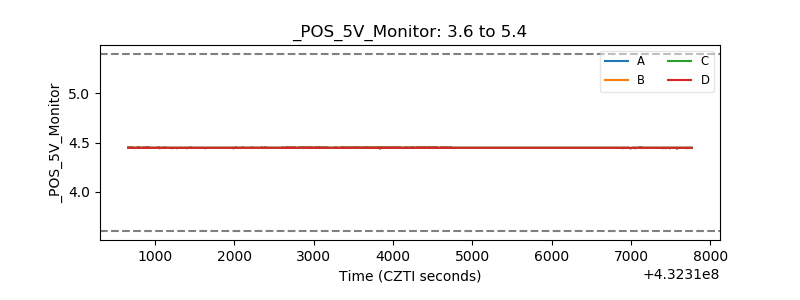 |
| _ROLL_ROT | 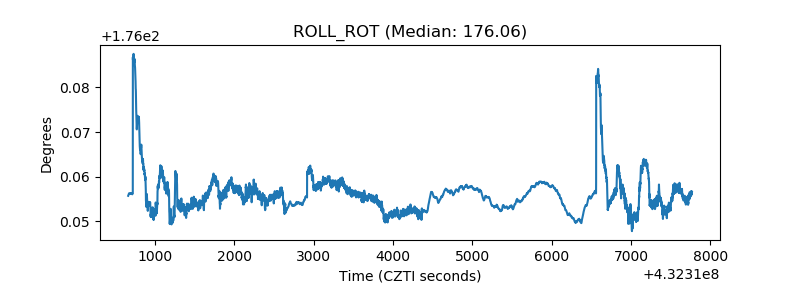 |
| _Roll_DEC |  |
| _Roll_RA | 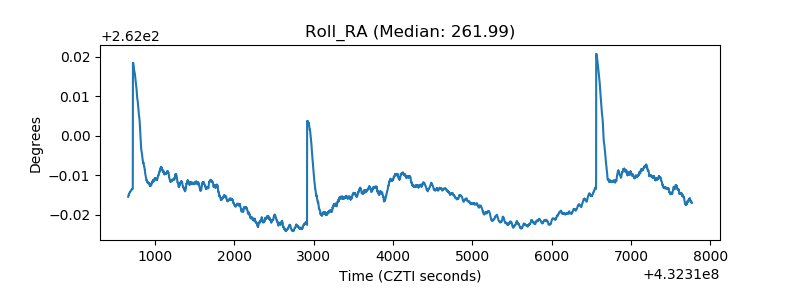 |
| Veto Counter | 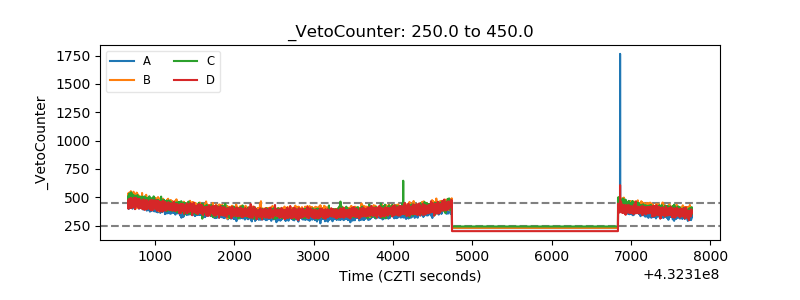 |