| Param | Original file | Final file |
|---|---|---|
| Filename | modeM0/AS1T05_148T01_9000005838_43043cztM0_level2.fits | modeM0/AS1T05_148T01_9000005838_43043cztM0_level2_quad_clean.evt |
| Size (bytes) | 384,151,680 | 103,619,520 |
| Size | 366.4 MB | 98.8 MB |
| Events in quadrant A | 3,273,023 | 729,378 |
| Events in quadrant B | 2,943,643 | 733,397 |
| Events in quadrant C | 2,749,196 | 705,087 |
| Events in quadrant D | 4,831,618 | 589,198 |
| Mode M9 | |||
|---|---|---|---|
| Quadrant | BADHDUFLAG | Total packets | Discarded packets |
| A | 0 | 26 | 0 |
| B | 0 | 27 | 0 |
| C | 0 | 27 | 0 |
| D | 0 | 27 | 0 |
| Mode SS | |||
|---|---|---|---|
| Quadrant | BADHDUFLAG | Total packets | Discarded packets |
| A | 0 | 112 | 0 |
| B | 0 | 112 | 0 |
| C | 0 | 112 | 0 |
| D | 0 | 112 | 0 |
| Mode M0 | |||
|---|---|---|---|
| Quadrant | BADHDUFLAG | Total packets | Discarded packets |
| A | 0 | 13197 | 2 |
| B | 0 | 12330 | 2 |
| C | 0 | 11459 | 2 |
| D | 0 | 18073 | 3 |
| Quadrant | Total seconds | Saturated seconds | Saturation percentage |
|---|---|---|---|
| A | 5434 | 55 | 1.012146% |
| B | 5434 | 49 | 0.901730% |
| C | 5434 | 4 | 0.073611% |
| D | 5433 | 487 | 8.963740% |
Noise dominated data is calculated using 1-second bins in cleaned event files. If a bin has >2000 counts, and if more than 50% of those come from <1% of pixels, then it is considered to be noise-dominated and hence unusable.
| Quadrant | # 1 sec bins | Bins with >0 counts | Bins with >2000 counts | High rate bins dominated by noise | Noise dominated (total time) | Noise dominated (detector-on time) | Marked lightcurve |
|---|---|---|---|---|---|---|---|
| A | 7047 | 5435 | 40 | 40 | 0.57% | 0.74% | 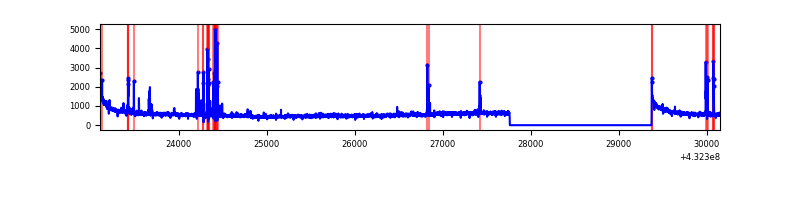 |
| B | 7047 | 5434 | 33 | 33 | 0.47% | 0.61% | 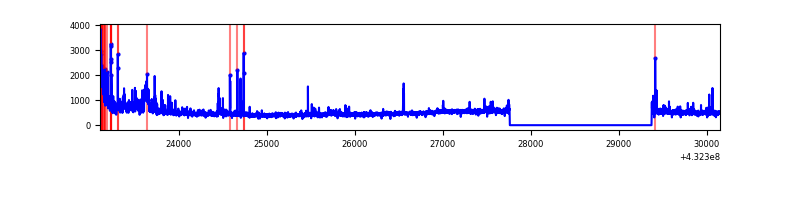 |
| C | 7047 | 5435 | 3 | 3 | 0.04% | 0.06% | 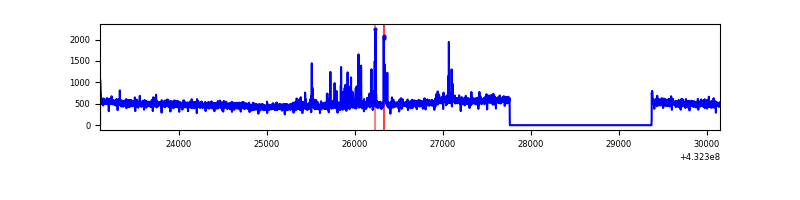 |
| D | 7046 | 5433 | 444 | 444 | 6.30% | 8.17% | 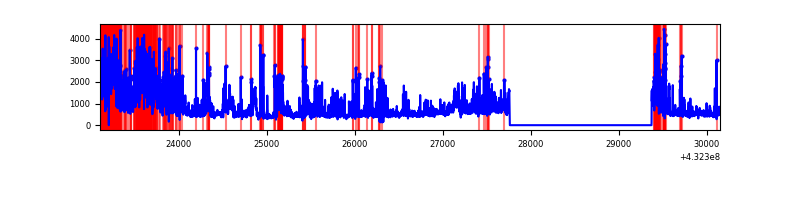 |
Top three noisy pixels from each quadrant. If the there are fewer than three noisy pixels in the level2.evt file, extra rows are filled as -1
| Pixel properties | Quadrant properties | ||||||
|---|---|---|---|---|---|---|---|
| Quadrant | DetID | PixID | Counts | Sigma | Mean | Median | Sigma |
| A | 10 | 83 | 597387 | 4257.29 | 634 | 623 | 140.2 |
| A | 15 | 237 | 175120 | 1244.85 | 634 | 623 | 140.2 |
| A | 12 | 189 | 48582 | 342.14 | 634 | 623 | 140.2 |
| B | 0 | 186 | 192820 | 1470.93 | 634 | 621 | 130.7 |
| B | 4 | 171 | 87338 | 663.66 | 634 | 621 | 130.7 |
| B | 0 | 189 | 63200 | 478.93 | 634 | 621 | 130.7 |
| C | 15 | 214 | 237191 | 1555.88 | 618 | 626 | 152.0 |
| C | 0 | 239 | 87155 | 569.1 | 618 | 626 | 152.0 |
| C | 3 | 233 | 9412 | 57.79 | 618 | 626 | 152.0 |
| D | 1 | 52 | 1692422 | 10957.27 | 590 | 572 | 154.4 |
| D | 10 | 118 | 561068 | 3630.05 | 590 | 572 | 154.4 |
| D | 1 | 4 | 207652 | 1341.15 | 590 | 572 | 154.4 |
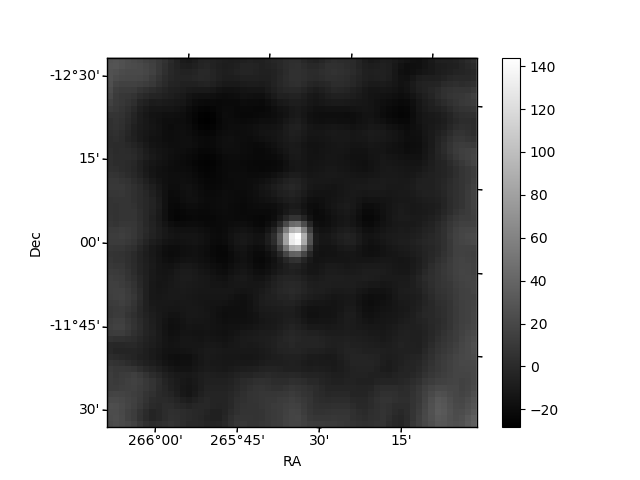
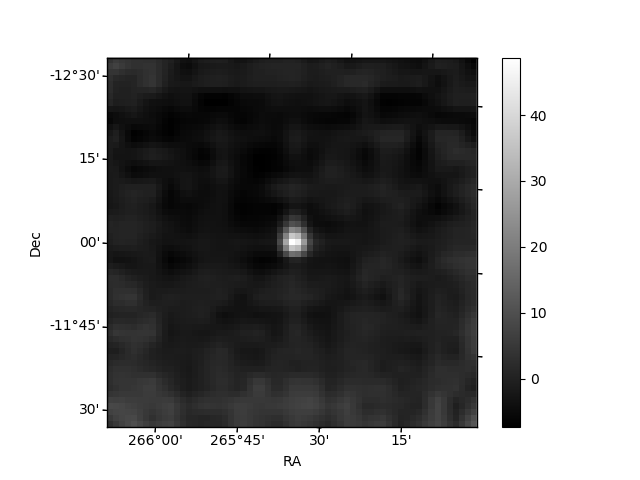
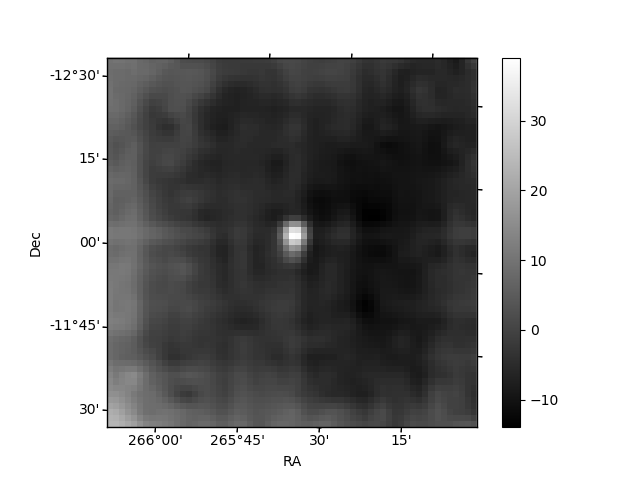
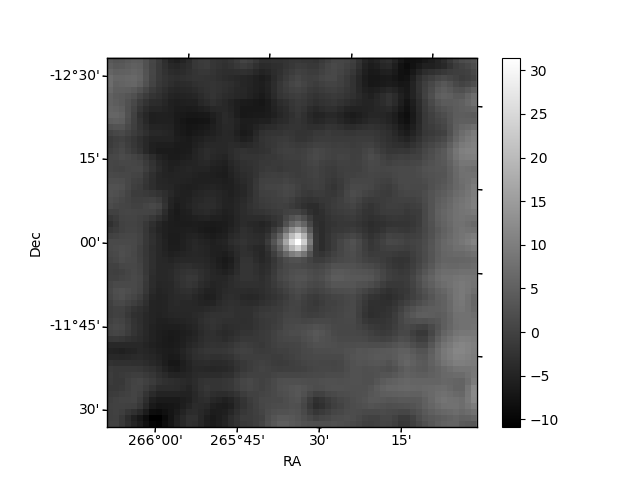
Histogram calculated using DETX and DETY for each event in the final _common_clean file
| Quadrant A | 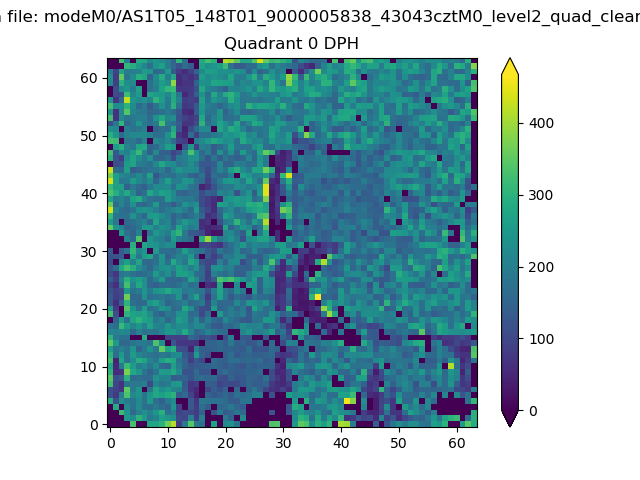 |
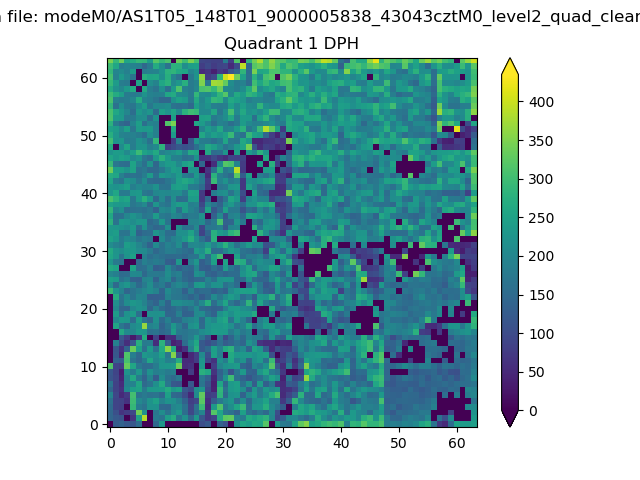 |
Quadrant B |
|---|---|---|---|
| Quadrant D |  |
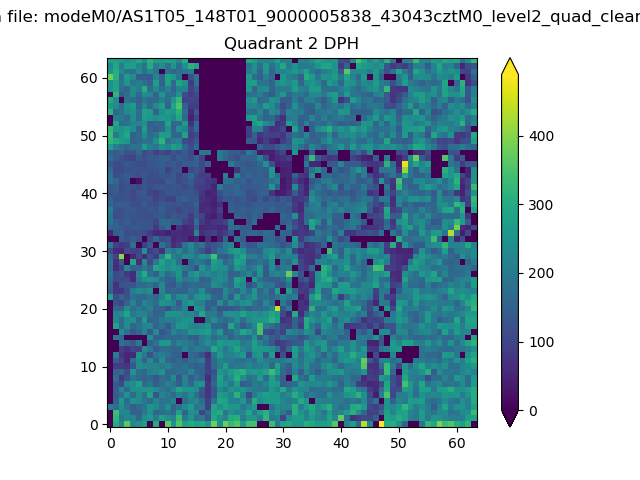 |
Quadrant C |
| Plot type | Count rate plots | Images |
|---|---|---|
| Comparison with Poisson distribution Blue bars denote a histogram of data divided into 1 sec bins. Red curve is a Poisson curve with rate = median count rate of data. |
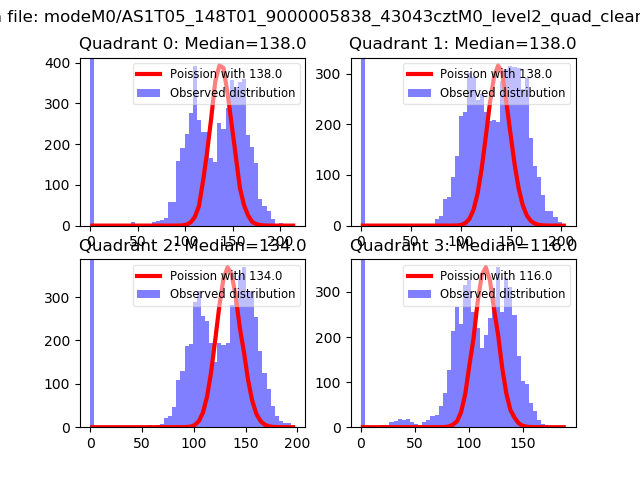 |
 |
| Quadrant-wise count rates Data is divided into 100 sec bins |
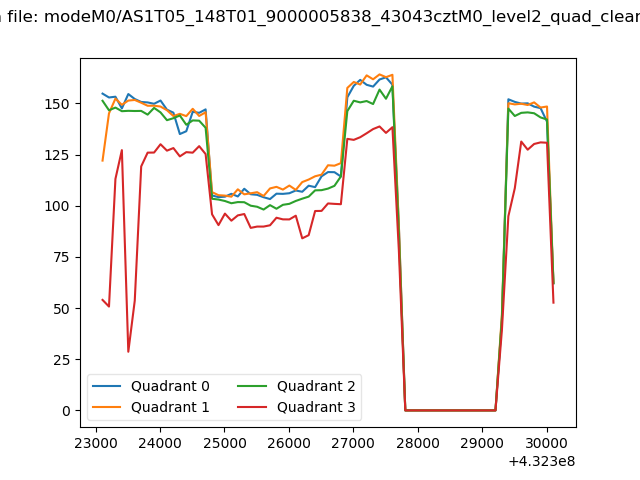 |
|
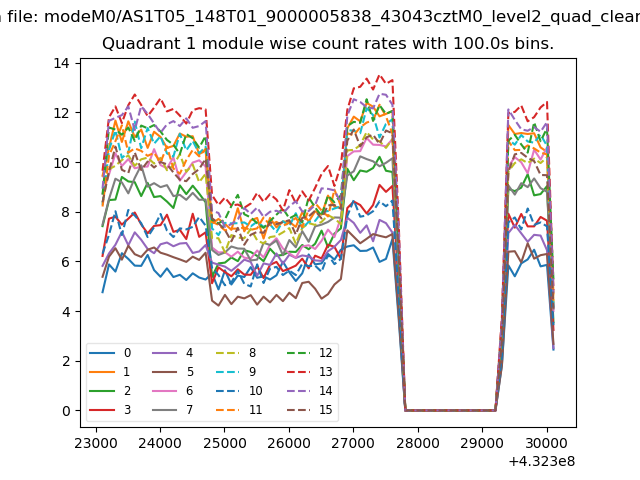
| Module-wise count rates for Quadrant A Data is divided into 100 sec bins |
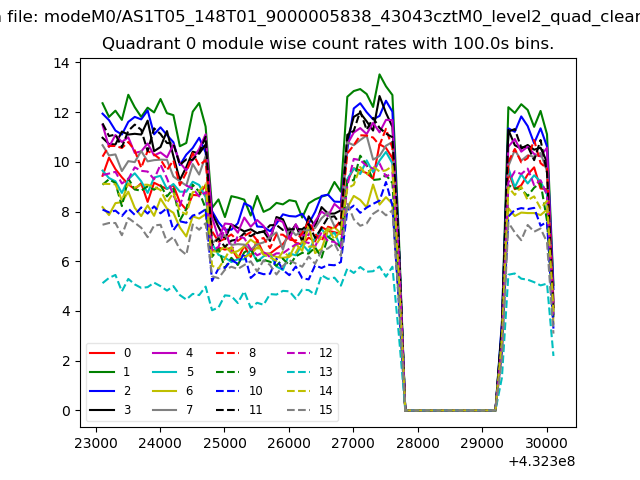 |
 |
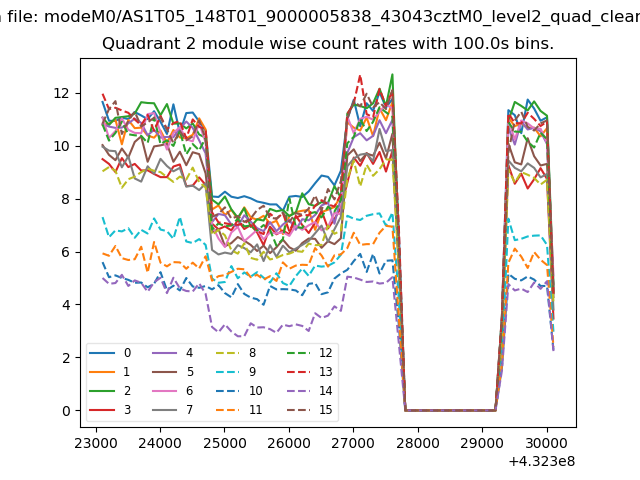
| Module-wise count rates for Quadrant B Data is divided into 100 sec bins |
 |
 |
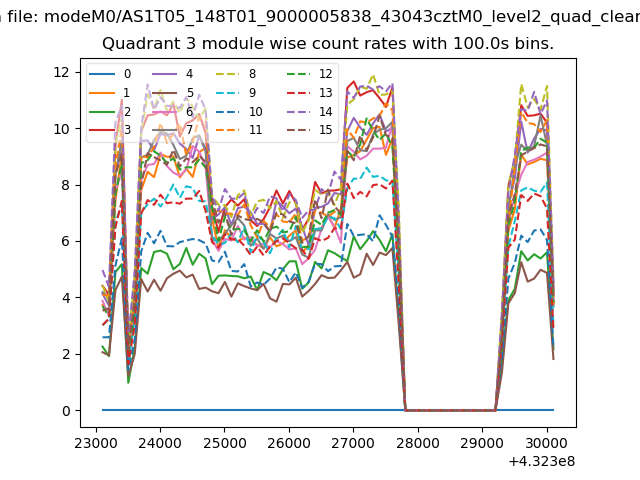
| Module-wise count rates for Quadrant C Data is divided into 100 sec bins |
 |
 |
| Module-wise count rates for Quadrant D Data is divided into 100 sec bins |
 |
 |
| Parameter | Plot |
|---|---|
| CZT HV Monitor |  |
| D_VDD | 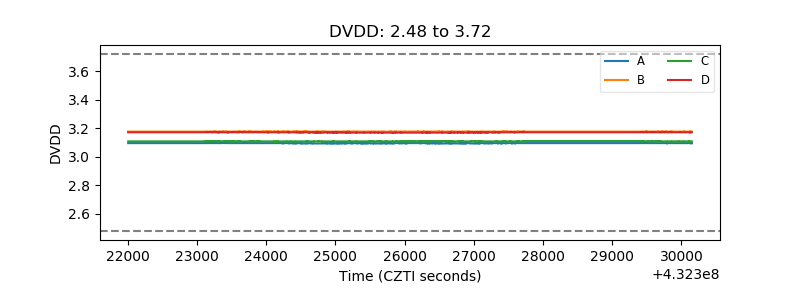 |
| Temperature 1 | 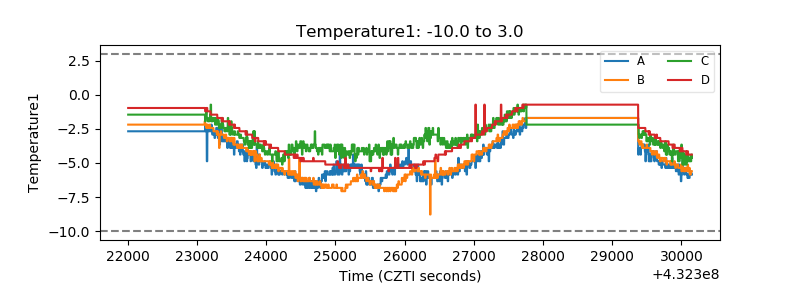 |
| Veto HV Monitor | 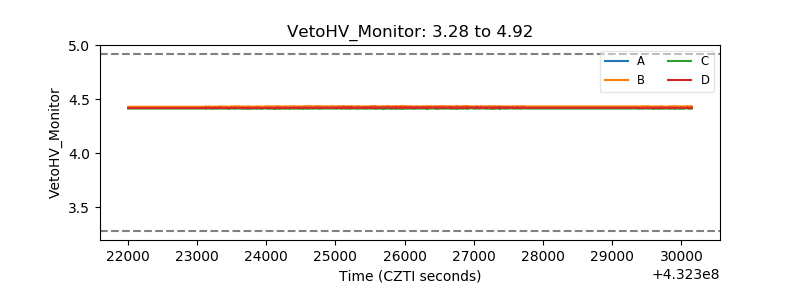 |
| Veto LLD | 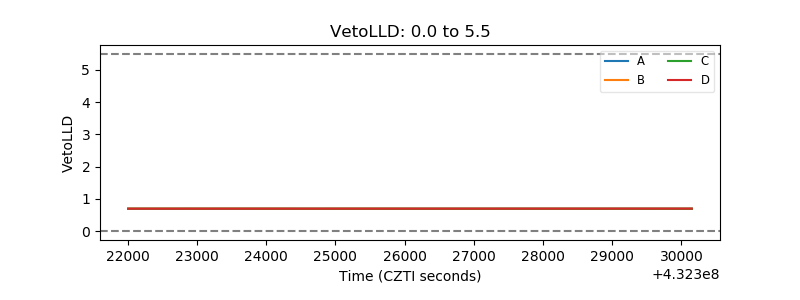 |
| Alpha Counter | 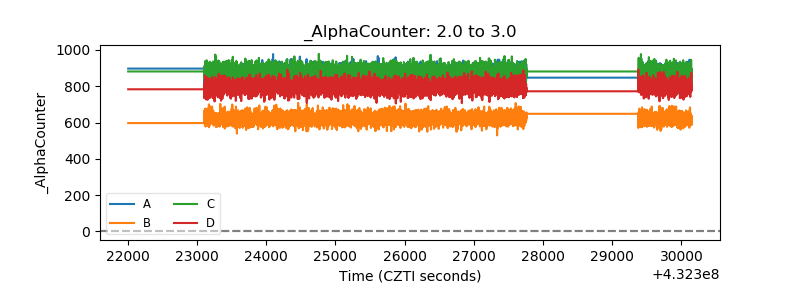 |
| _CPM_Rate |  |
| CZT Counter | 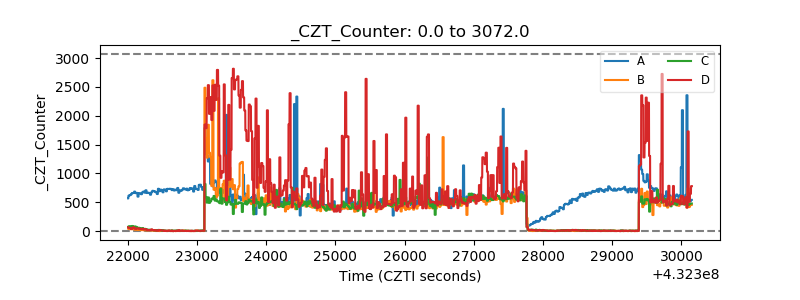 |
| +2.5 Volts monitor |  |
| +5 Volts monitor | 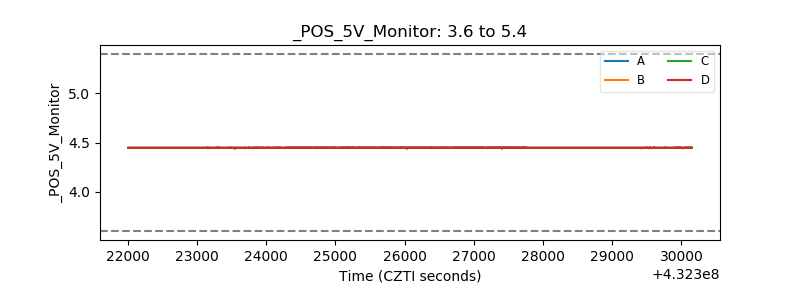 |
| _ROLL_ROT | 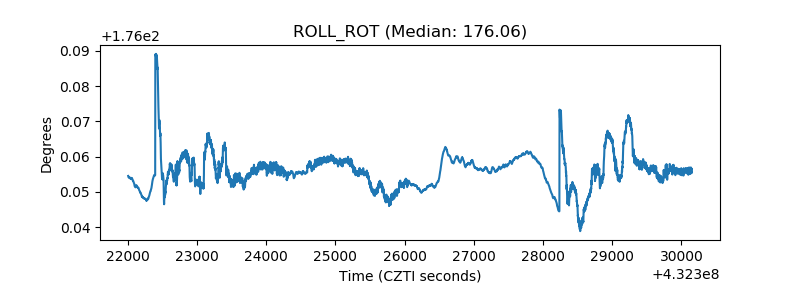 |
| _Roll_DEC | 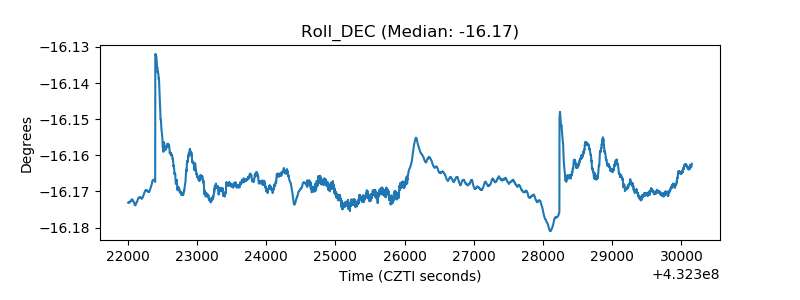 |
| _Roll_RA | 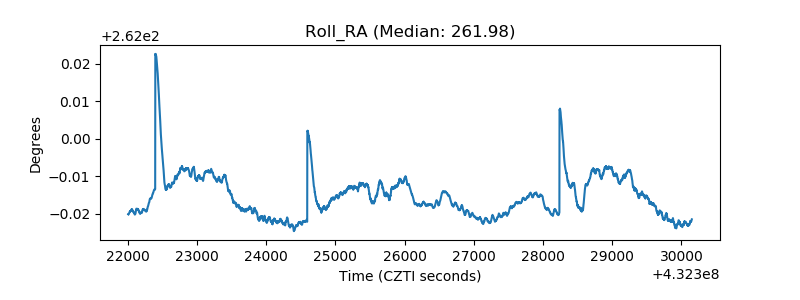 |
| Veto Counter | 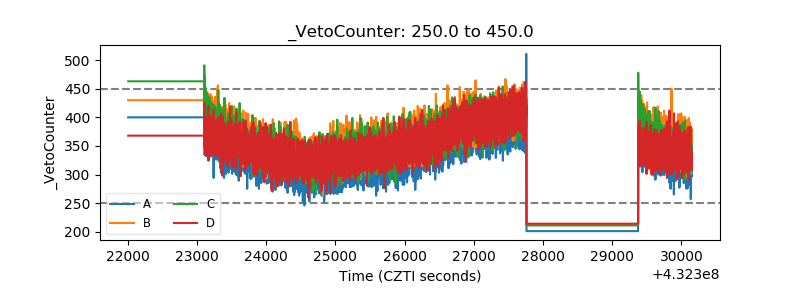 |