| Param | Original file | Final file |
|---|---|---|
| Filename | modeM0/AS1T05_148T01_9000005838_43044cztM0_level2.fits | modeM0/AS1T05_148T01_9000005838_43044cztM0_level2_quad_clean.evt |
| Size (bytes) | 402,742,080 | 109,785,600 |
| Size | 384.1 MB | 104.7 MB |
| Events in quadrant A | 3,445,576 | 775,472 |
| Events in quadrant B | 2,888,441 | 780,632 |
| Events in quadrant C | 2,841,460 | 749,086 |
| Events in quadrant D | 5,283,675 | 615,747 |
| Mode M9 | |||
|---|---|---|---|
| Quadrant | BADHDUFLAG | Total packets | Discarded packets |
| A | 0 | 19 | 0 |
| B | 0 | 20 | 0 |
| C | 0 | 20 | 0 |
| D | 0 | 20 | 0 |
| Mode SS | |||
|---|---|---|---|
| Quadrant | BADHDUFLAG | Total packets | Discarded packets |
| A | 0 | 118 | 0 |
| B | 0 | 118 | 0 |
| C | 0 | 118 | 0 |
| D | 0 | 118 | 0 |
| Mode M0 | |||
|---|---|---|---|
| Quadrant | BADHDUFLAG | Total packets | Discarded packets |
| A | 0 | 14190 | 2 |
| B | 0 | 12212 | 2 |
| C | 0 | 11958 | 2 |
| D | 0 | 19683 | 6 |
| Quadrant | Total seconds | Saturated seconds | Saturation percentage |
|---|---|---|---|
| A | 5773 | 37 | 0.640915% |
| B | 5773 | 28 | 0.485016% |
| C | 5773 | 3 | 0.051966% |
| D | 5772 | 663 | 11.486486% |
Noise dominated data is calculated using 1-second bins in cleaned event files. If a bin has >2000 counts, and if more than 50% of those come from <1% of pixels, then it is considered to be noise-dominated and hence unusable.
| Quadrant | # 1 sec bins | Bins with >0 counts | Bins with >2000 counts | High rate bins dominated by noise | Noise dominated (total time) | Noise dominated (detector-on time) | Marked lightcurve |
|---|---|---|---|---|---|---|---|
| A | 7146 | 5774 | 21 | 21 | 0.29% | 0.36% | 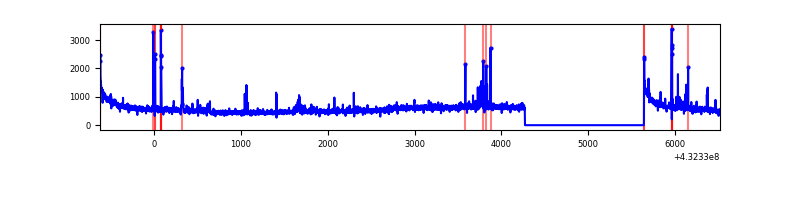 |
| B | 7146 | 5774 | 15 | 15 | 0.21% | 0.26% | 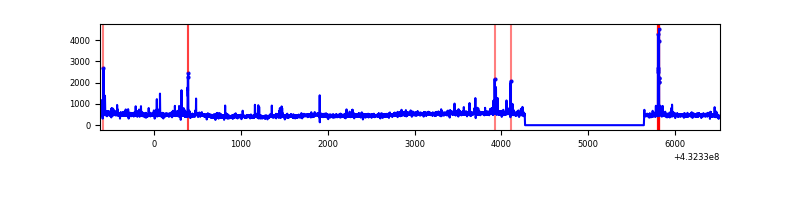 |
| C | 7146 | 5774 | 0 | 0 | 0.00% | 0.00% | 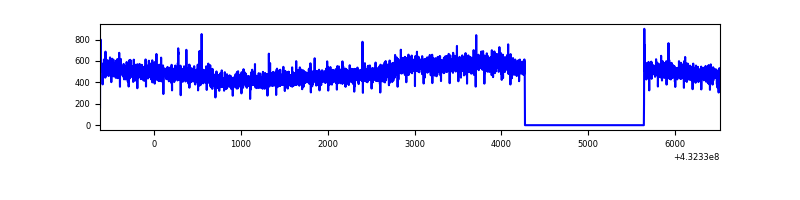 |
| D | 7144 | 5772 | 547 | 547 | 7.66% | 9.48% | 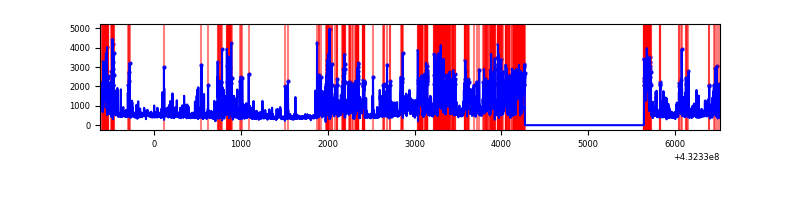 |
Top three noisy pixels from each quadrant. If the there are fewer than three noisy pixels in the level2.evt file, extra rows are filled as -1
| Pixel properties | Quadrant properties | ||||||
|---|---|---|---|---|---|---|---|
| Quadrant | DetID | PixID | Counts | Sigma | Mean | Median | Sigma |
| A | 10 | 83 | 611356 | 4139.13 | 681 | 671 | 147.5 |
| A | 15 | 237 | 106021 | 714.05 | 681 | 671 | 147.5 |
| A | 12 | 189 | 82833 | 556.88 | 681 | 671 | 147.5 |
| B | 0 | 229 | 83778 | 600.45 | 677 | 663 | 138.4 |
| B | 5 | 255 | 43888 | 312.27 | 677 | 663 | 138.4 |
| B | 0 | 189 | 39083 | 277.56 | 677 | 663 | 138.4 |
| C | 15 | 214 | 254271 | 1551.54 | 660 | 666 | 163.5 |
| C | 0 | 207 | 5779 | 31.28 | 660 | 666 | 163.5 |
| C | 3 | 233 | 5307 | 28.39 | 660 | 666 | 163.5 |
| D | 1 | 52 | 2528785 | 15449.6 | 630 | 613 | 163.6 |
| D | 10 | 118 | 144181 | 877.34 | 630 | 613 | 163.6 |
| D | 13 | 249 | 76472 | 463.57 | 630 | 613 | 163.6 |
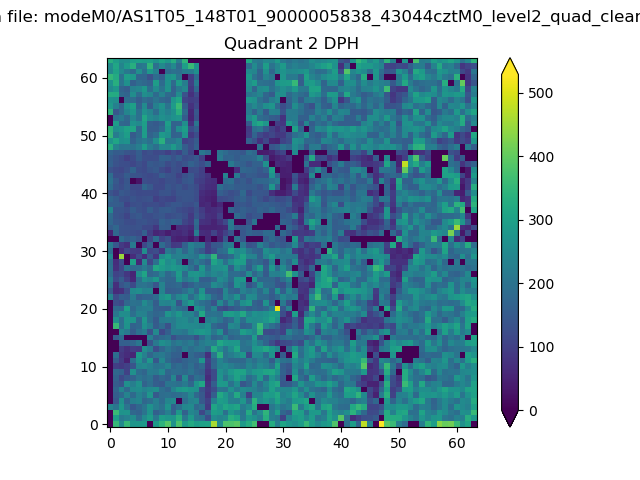
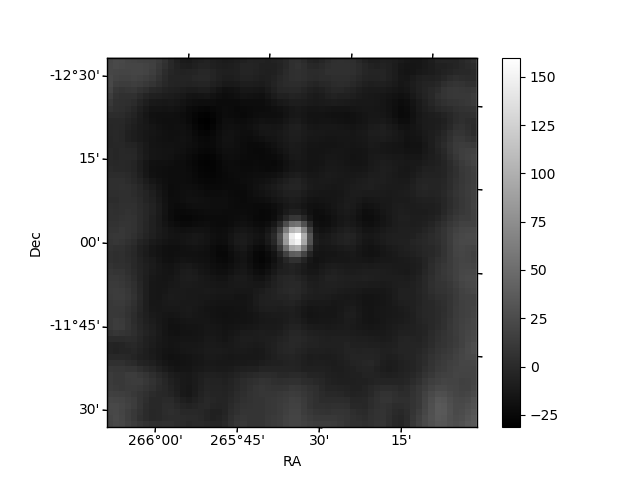
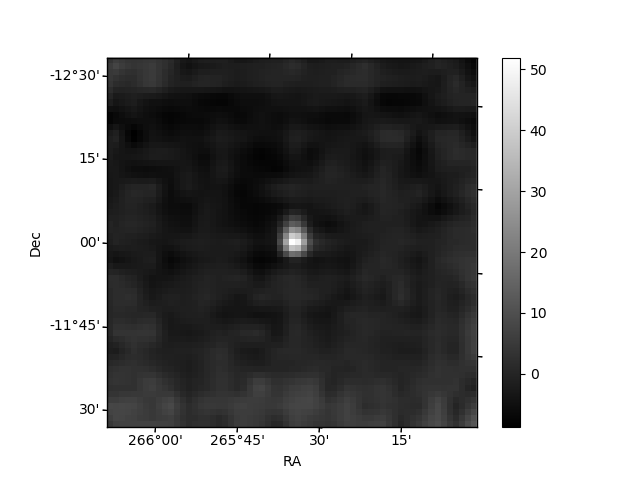
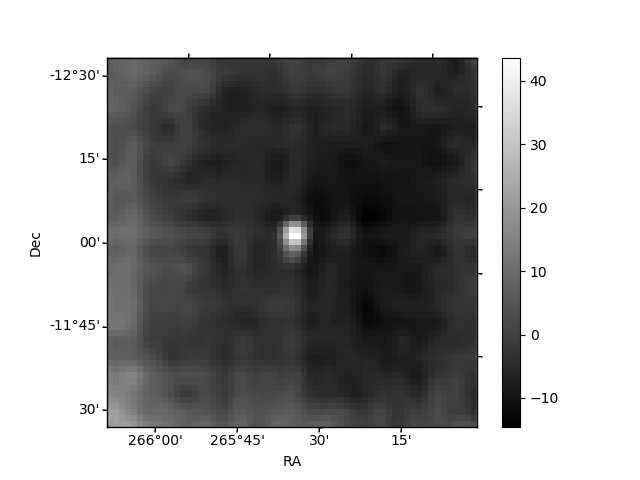
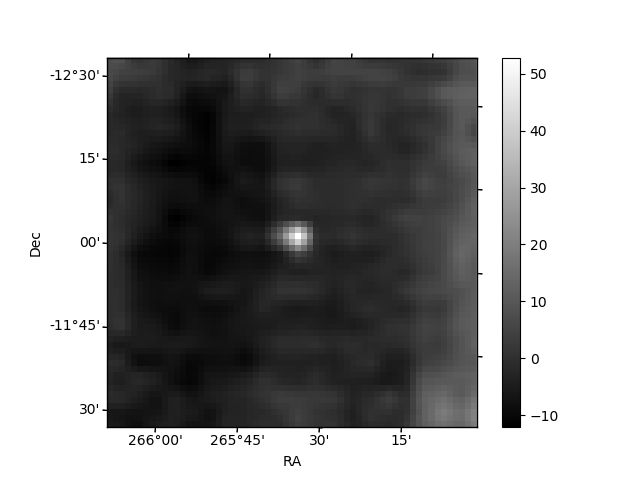
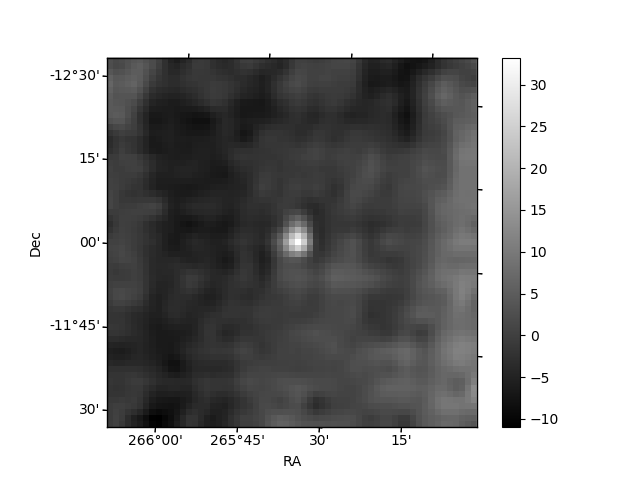
Histogram calculated using DETX and DETY for each event in the final _common_clean file
| Quadrant A | 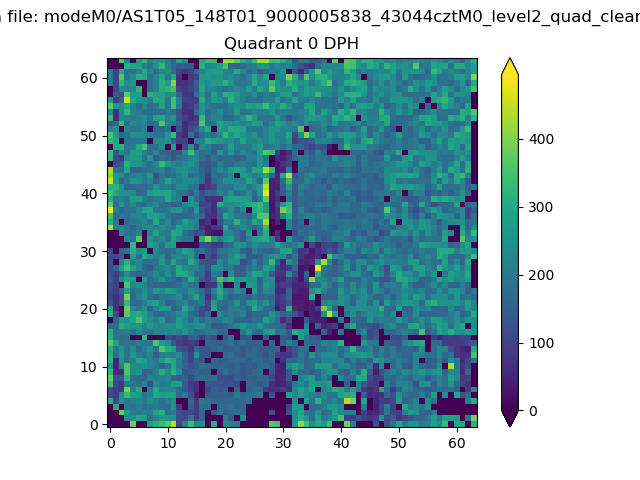 |
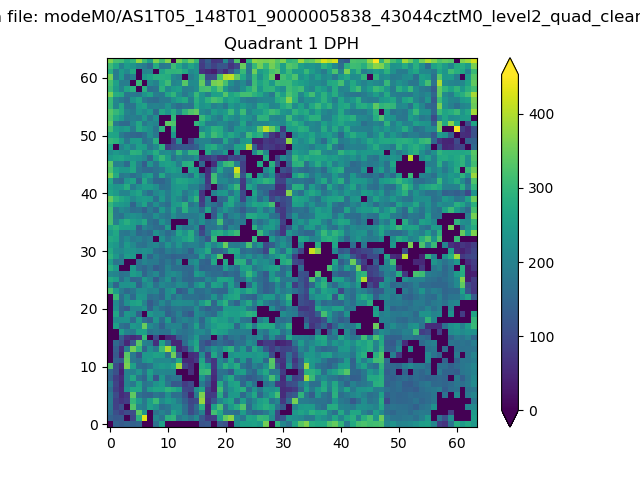 |
Quadrant B |
|---|---|---|---|
| Quadrant D | 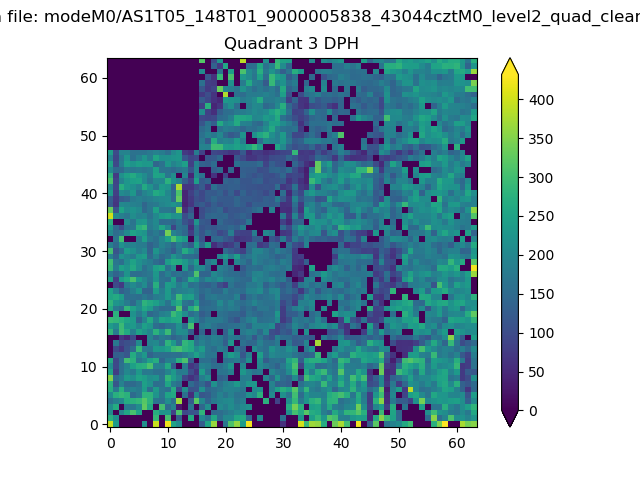 |
 |
Quadrant C |
| Plot type | Count rate plots | Images |
|---|---|---|
| Comparison with Poisson distribution Blue bars denote a histogram of data divided into 1 sec bins. Red curve is a Poisson curve with rate = median count rate of data. |
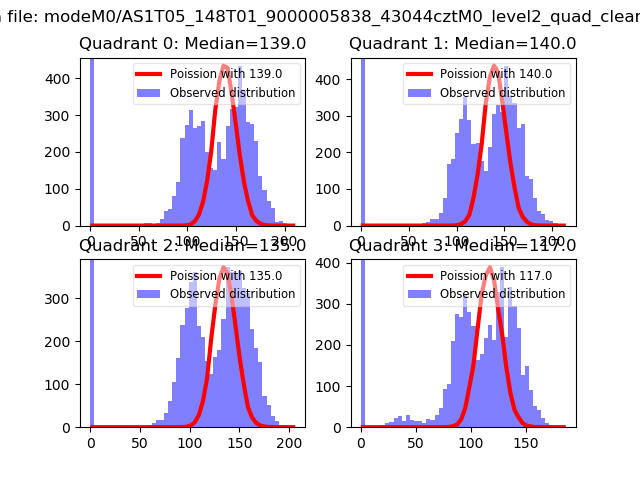 |
 |
| Quadrant-wise count rates Data is divided into 100 sec bins |
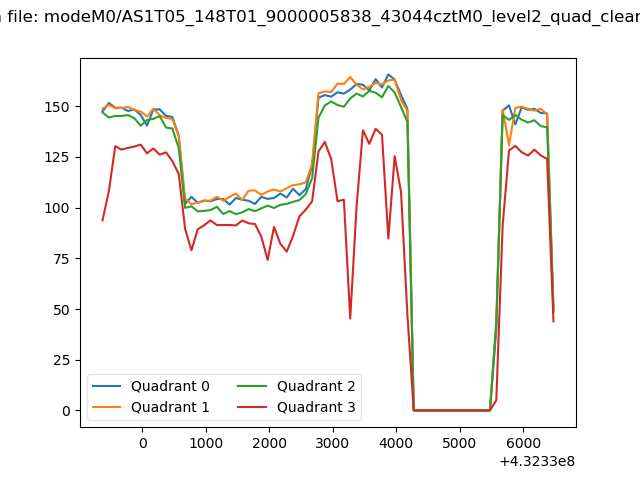 |
|
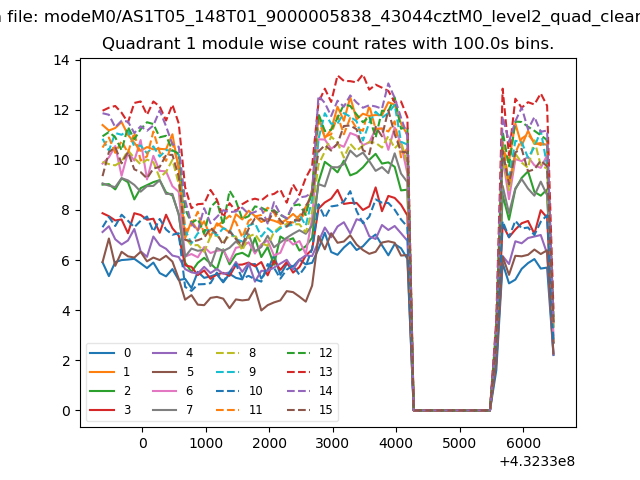
| Module-wise count rates for Quadrant A Data is divided into 100 sec bins |
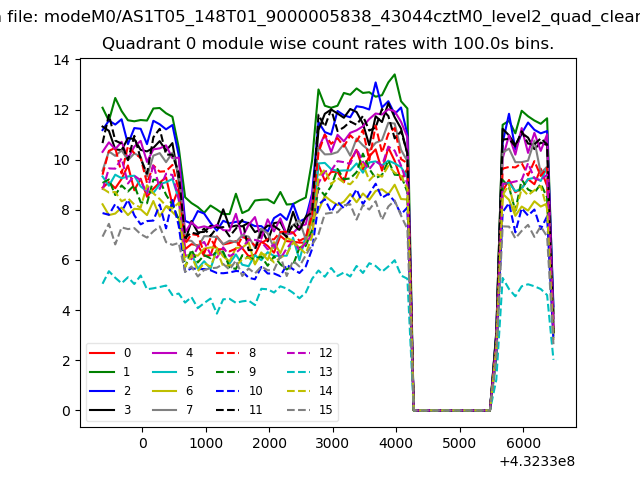 |
 |
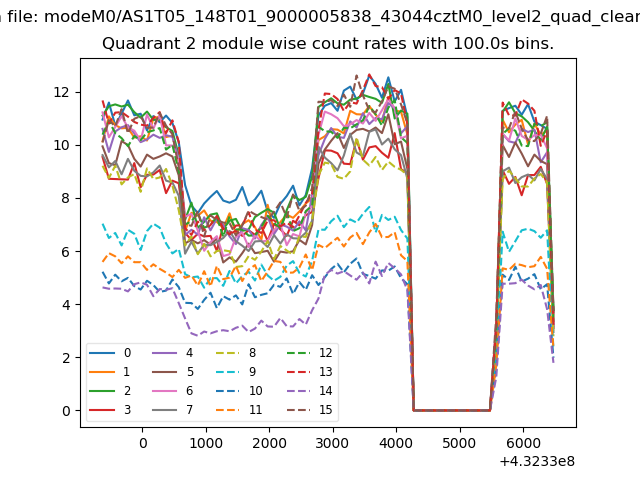
| Module-wise count rates for Quadrant B Data is divided into 100 sec bins |
 |
 |
| Module-wise count rates for Quadrant C Data is divided into 100 sec bins |
 |
 |
| Module-wise count rates for Quadrant D Data is divided into 100 sec bins |
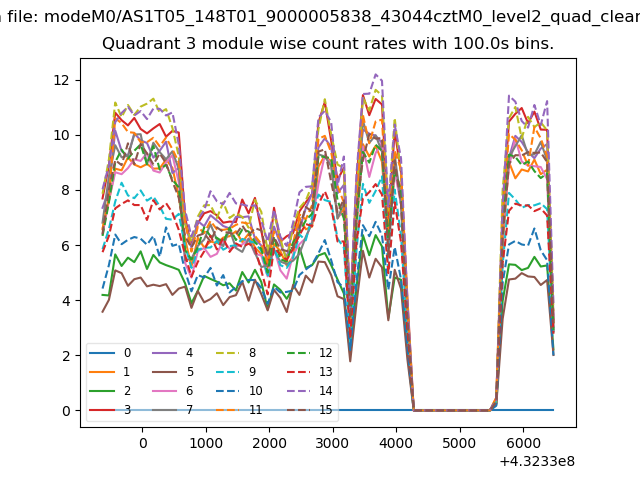 |
 |
| Parameter | Plot |
|---|---|
| CZT HV Monitor | 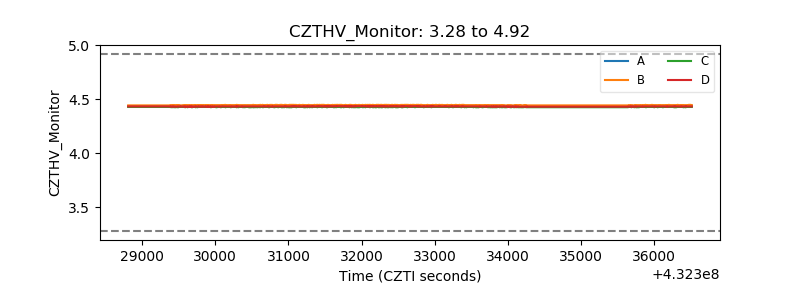 |
| D_VDD | 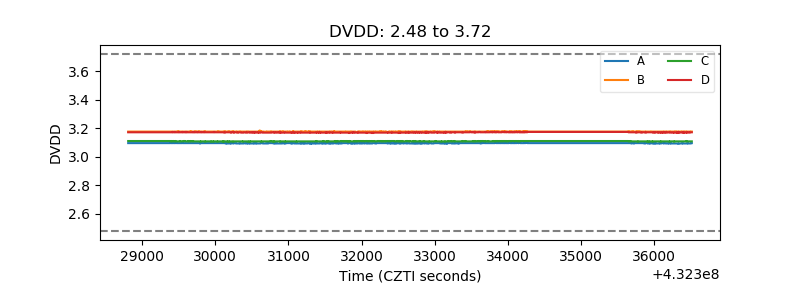 |
| Temperature 1 | 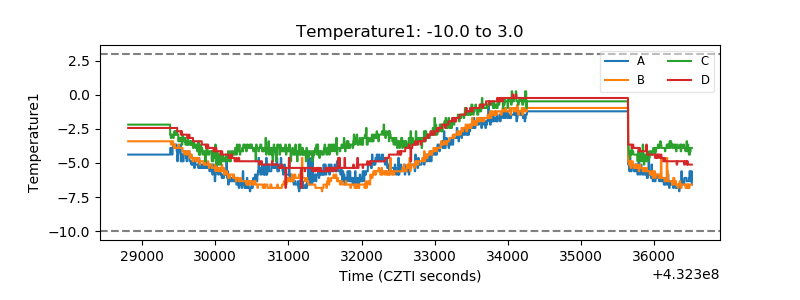 |
| Veto HV Monitor | 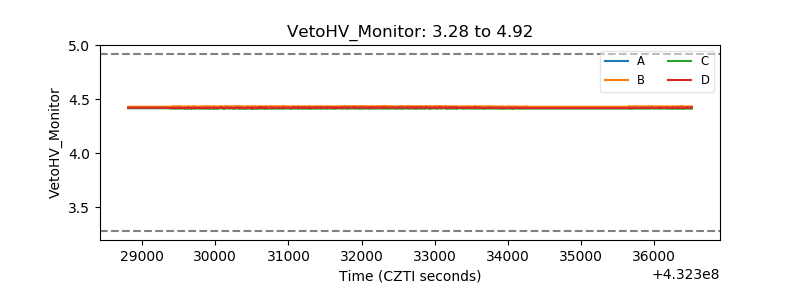 |
| Veto LLD | 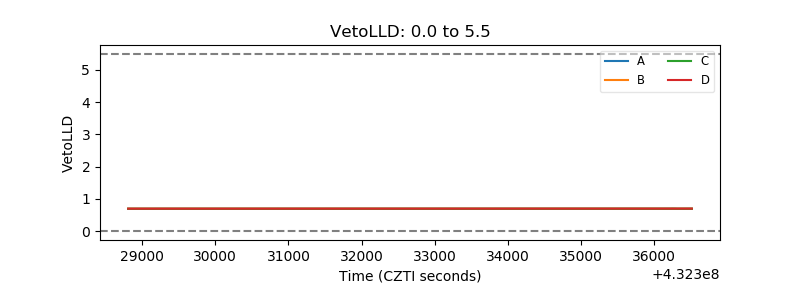 |
| Alpha Counter | 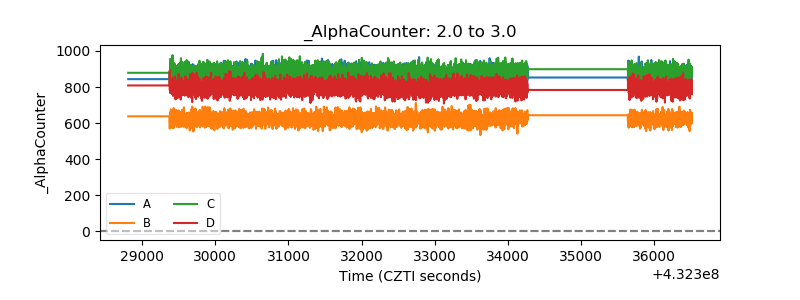 |
| _CPM_Rate |  |
| CZT Counter | 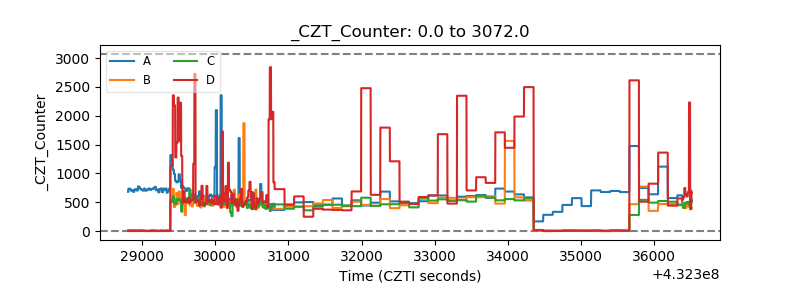 |
| +2.5 Volts monitor | 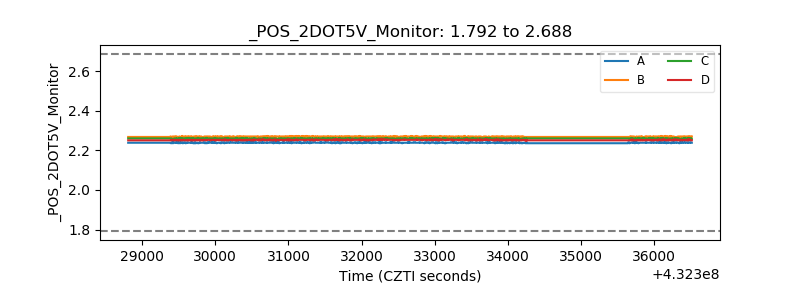 |
| +5 Volts monitor |  |
| _ROLL_ROT | 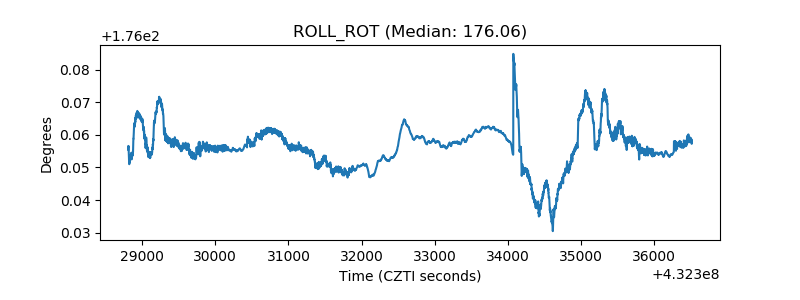 |
| _Roll_DEC | 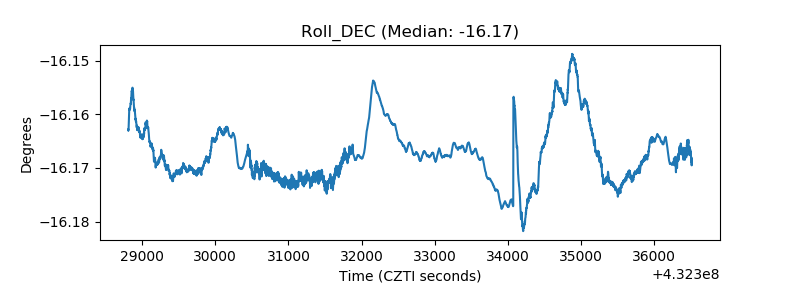 |
| _Roll_RA | 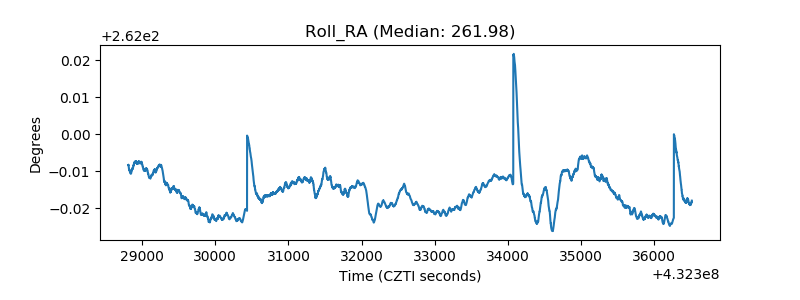 |
| Veto Counter | 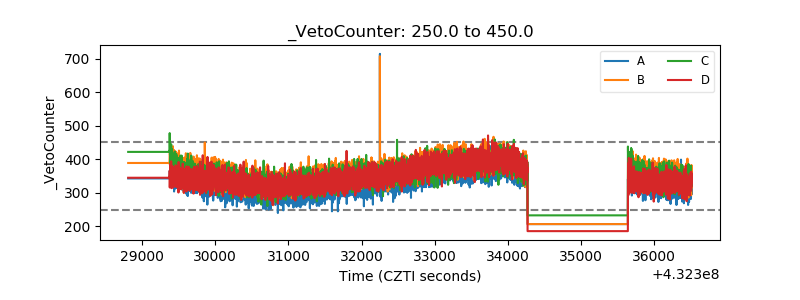 |