| Param | Original file | Final file |
|---|---|---|
| Filename | modeM0/AS1T05_148T01_9000005838_43045cztM0_level2.fits | modeM0/AS1T05_148T01_9000005838_43045cztM0_level2_quad_clean.evt |
| Size (bytes) | 428,391,360 | 111,830,400 |
| Size | 408.5 MB | 106.6 MB |
| Events in quadrant A | 3,684,541 | 790,058 |
| Events in quadrant B | 3,968,364 | 743,352 |
| Events in quadrant C | 3,060,354 | 766,284 |
| Events in quadrant D | 4,671,349 | 661,695 |
| Mode M9 | |||
|---|---|---|---|
| Quadrant | BADHDUFLAG | Total packets | Discarded packets |
| A | 0 | 27 | 0 |
| B | 0 | 27 | 0 |
| C | 0 | 27 | 0 |
| D | 0 | 27 | 0 |
| Mode SS | |||
|---|---|---|---|
| Quadrant | BADHDUFLAG | Total packets | Discarded packets |
| A | 0 | 126 | 0 |
| B | 0 | 126 | 0 |
| C | 0 | 126 | 0 |
| D | 0 | 126 | 0 |
| Mode M0 | |||
|---|---|---|---|
| Quadrant | BADHDUFLAG | Total packets | Discarded packets |
| A | 0 | 15098 | 2 |
| B | 0 | 15805 | 2 |
| C | 0 | 12766 | 2 |
| D | 0 | 17986 | 2 |
| Quadrant | Total seconds | Saturated seconds | Saturation percentage |
|---|---|---|---|
| A | 6086 | 49 | 0.805127% |
| B | 6086 | 436 | 7.163983% |
| C | 6086 | 20 | 0.328623% |
| D | 6086 | 410 | 6.736773% |
Noise dominated data is calculated using 1-second bins in cleaned event files. If a bin has >2000 counts, and if more than 50% of those come from <1% of pixels, then it is considered to be noise-dominated and hence unusable.
| Quadrant | # 1 sec bins | Bins with >0 counts | Bins with >2000 counts | High rate bins dominated by noise | Noise dominated (total time) | Noise dominated (detector-on time) | Marked lightcurve |
|---|---|---|---|---|---|---|---|
| A | 8742 | 6088 | 28 | 28 | 0.32% | 0.46% | 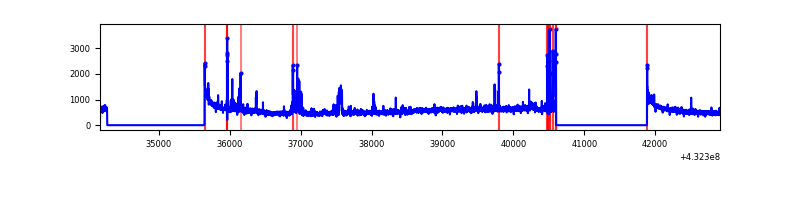 |
| B | 8742 | 6088 | 350 | 350 | 4.00% | 5.75% | 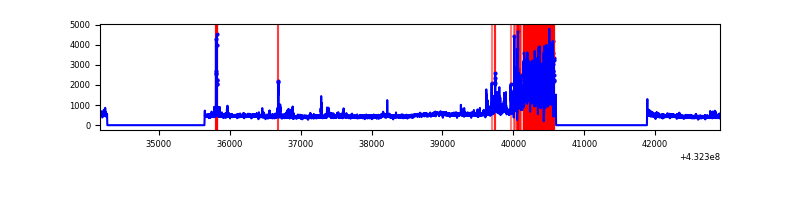 |
| C | 8742 | 6088 | 16 | 16 | 0.18% | 0.26% | 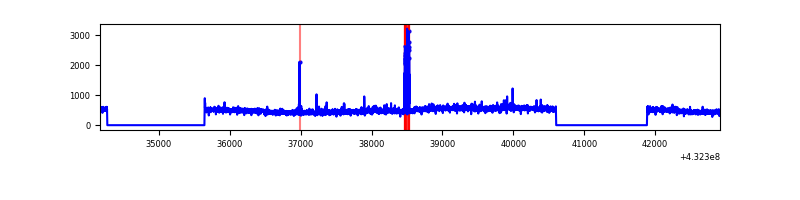 |
| D | 8742 | 6088 | 329 | 329 | 3.76% | 5.40% | 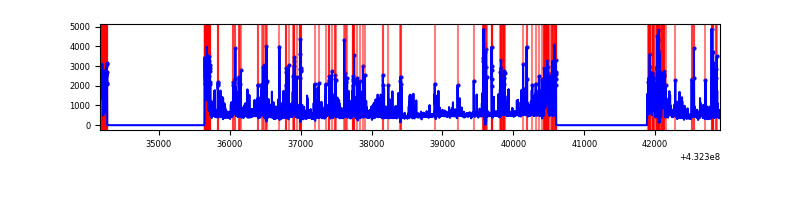 |
Top three noisy pixels from each quadrant. If the there are fewer than three noisy pixels in the level2.evt file, extra rows are filled as -1
| Pixel properties | Quadrant properties | ||||||
|---|---|---|---|---|---|---|---|
| Quadrant | DetID | PixID | Counts | Sigma | Mean | Median | Sigma |
| A | 10 | 83 | 633533 | 4136.78 | 711 | 701 | 153.0 |
| A | 15 | 237 | 217047 | 1414.24 | 711 | 701 | 153.0 |
| A | 12 | 189 | 80596 | 522.27 | 711 | 701 | 153.0 |
| B | 0 | 186 | 1022921 | 7460.01 | 682 | 668 | 137.0 |
| B | 0 | 229 | 92458 | 669.85 | 682 | 668 | 137.0 |
| B | 5 | 255 | 52799 | 380.43 | 682 | 668 | 137.0 |
| C | 15 | 214 | 268508 | 1587.87 | 691 | 699 | 168.7 |
| C | 0 | 207 | 68453 | 401.72 | 691 | 699 | 168.7 |
| C | 14 | 254 | 21632 | 124.11 | 691 | 699 | 168.7 |
| D | 1 | 52 | 1924800 | 11092.91 | 670 | 650 | 173.5 |
| D | 10 | 118 | 109731 | 628.86 | 670 | 650 | 173.5 |
| D | 2 | 234 | 29929 | 168.8 | 670 | 650 | 173.5 |
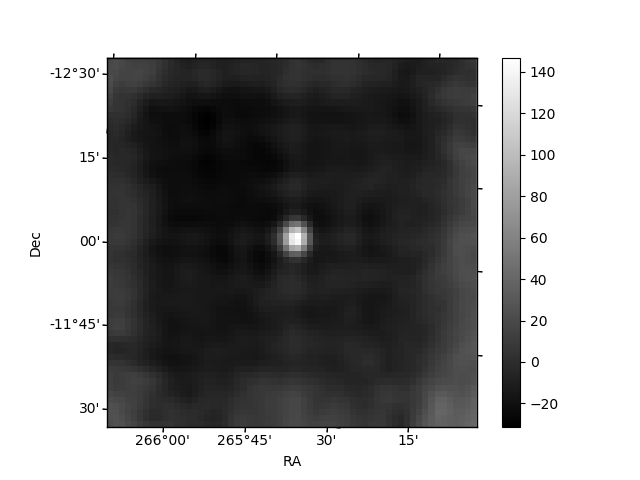
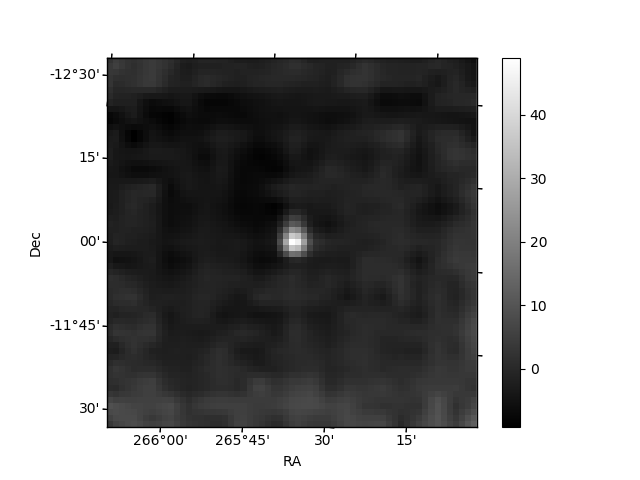
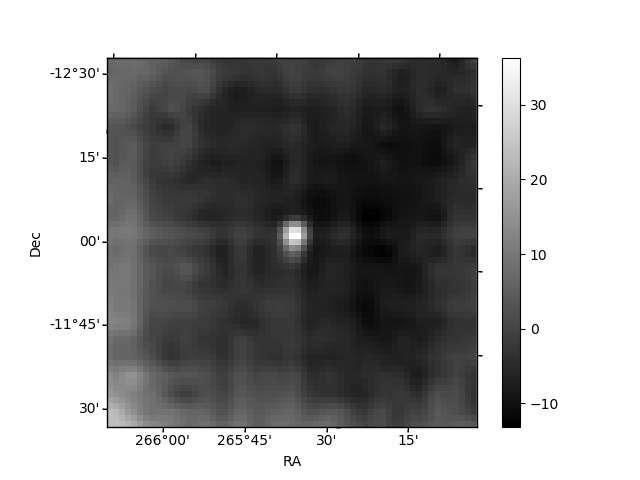
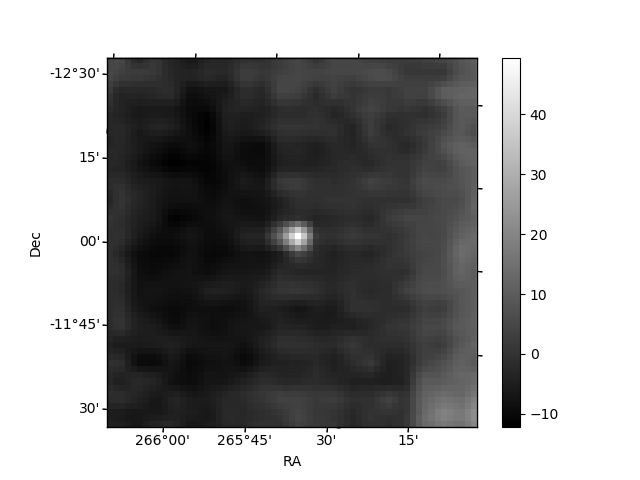
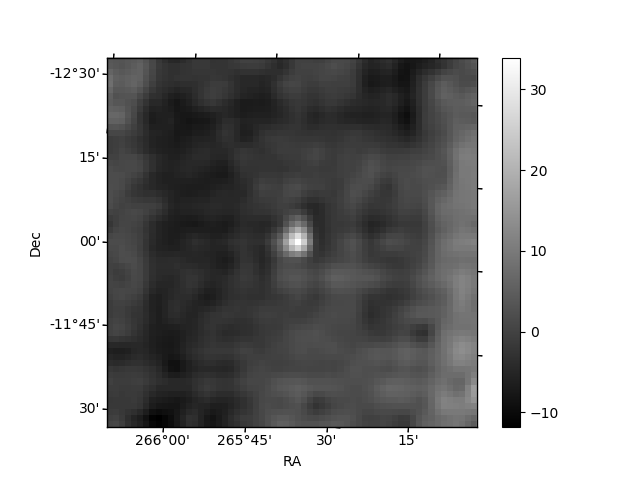
Histogram calculated using DETX and DETY for each event in the final _common_clean file
| Quadrant A | 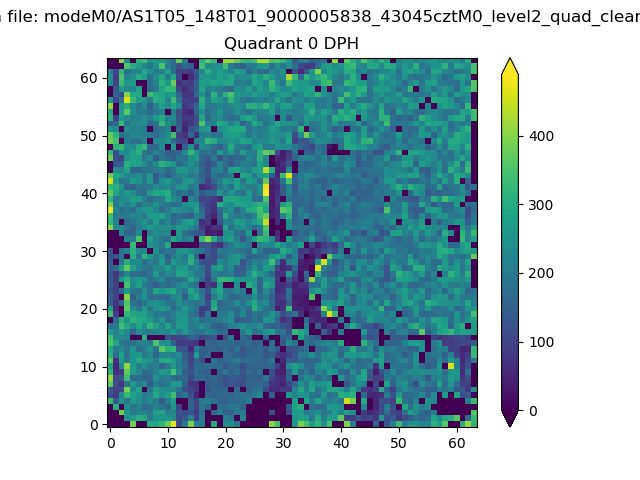 |
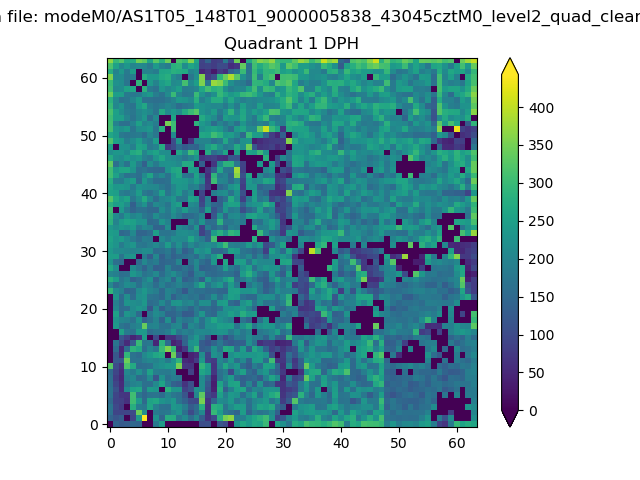 |
Quadrant B |
|---|---|---|---|
| Quadrant D | 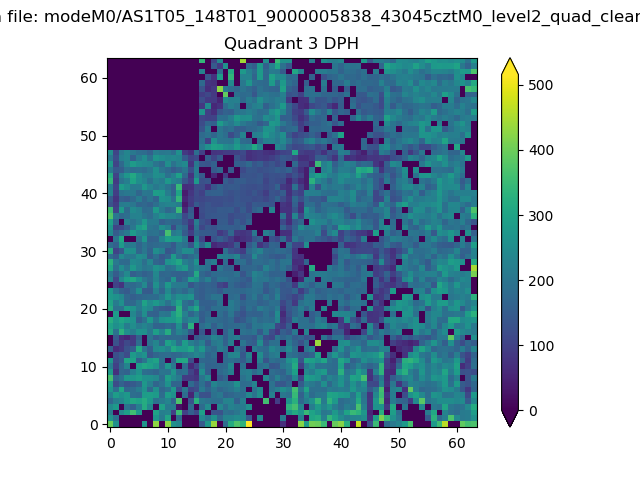 |
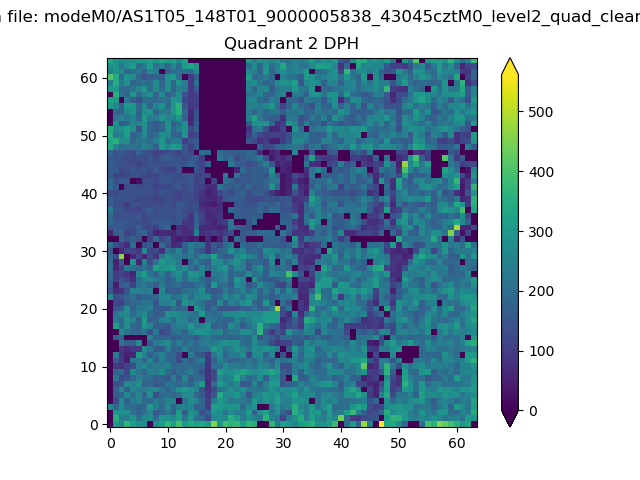 |
Quadrant C |
| Plot type | Count rate plots | Images |
|---|---|---|
| Comparison with Poisson distribution Blue bars denote a histogram of data divided into 1 sec bins. Red curve is a Poisson curve with rate = median count rate of data. |
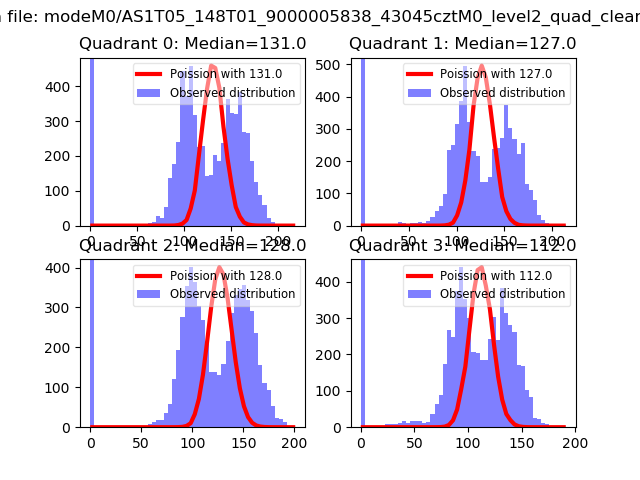 |
 |
| Quadrant-wise count rates Data is divided into 100 sec bins |
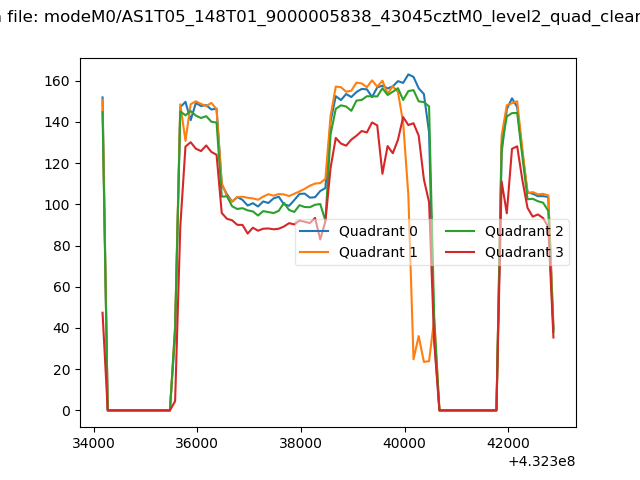 |
|
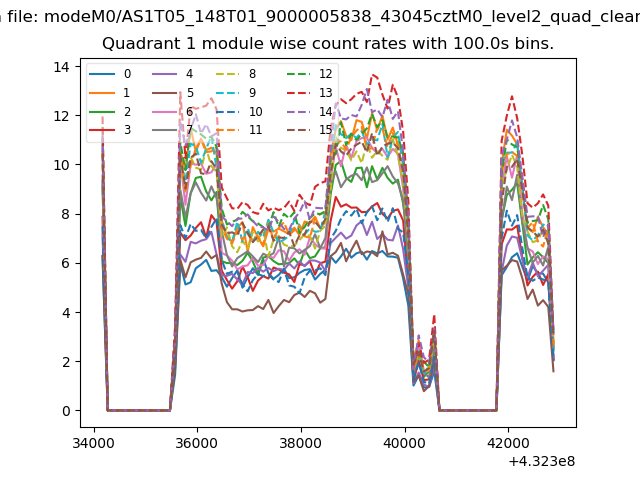
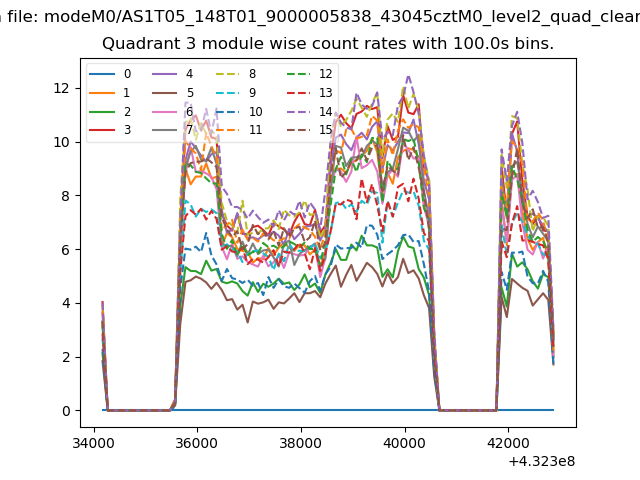
| Module-wise count rates for Quadrant A Data is divided into 100 sec bins |
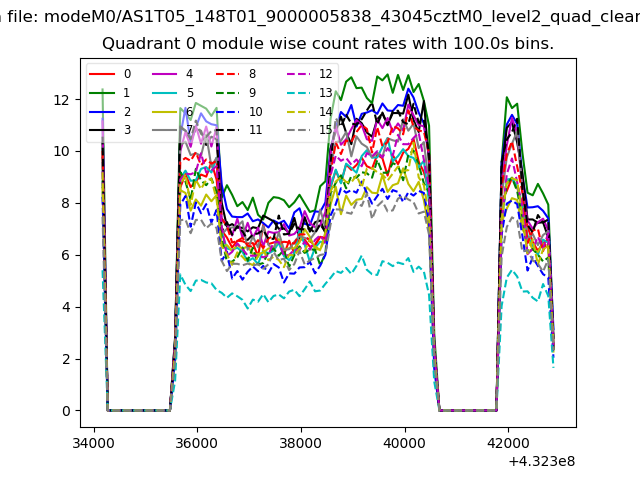 |
 |
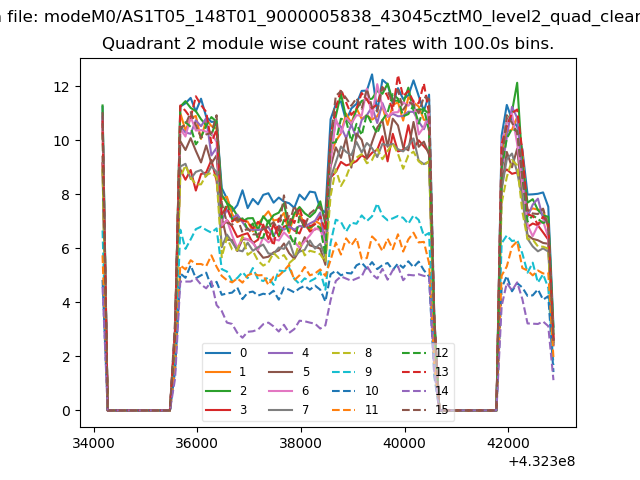
| Module-wise count rates for Quadrant B Data is divided into 100 sec bins |
 |
 |
| Module-wise count rates for Quadrant C Data is divided into 100 sec bins |
 |
 |
| Module-wise count rates for Quadrant D Data is divided into 100 sec bins |
 |
 |
| Parameter | Plot |
|---|---|
| CZT HV Monitor | 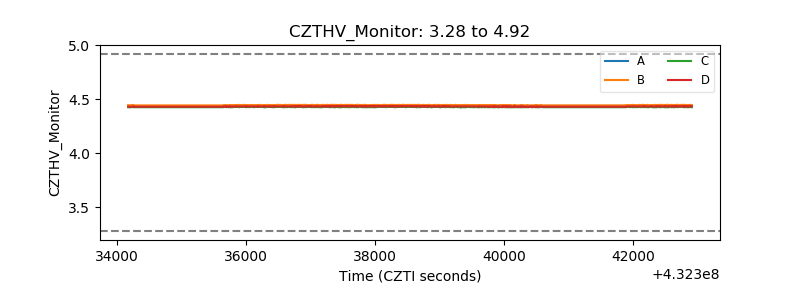 |
| D_VDD | 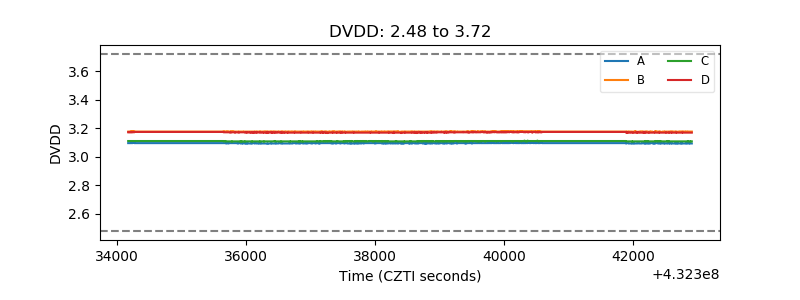 |
| Temperature 1 | 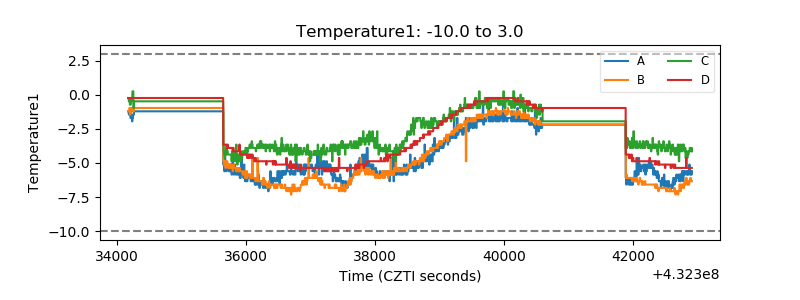 |
| Veto HV Monitor | 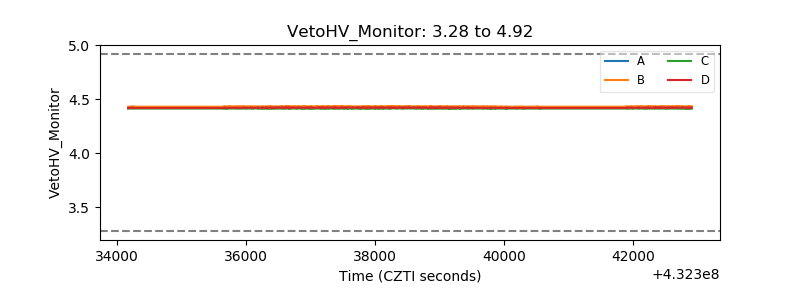 |
| Veto LLD | 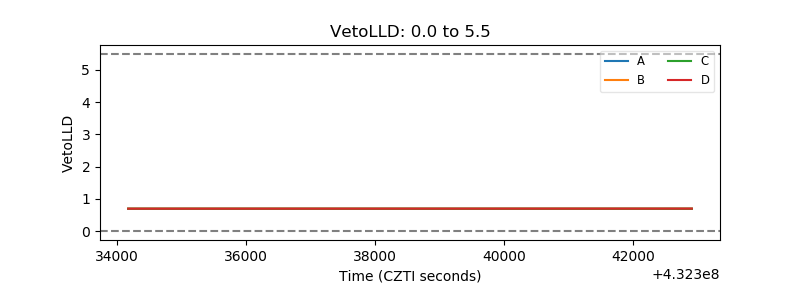 |
| Alpha Counter | 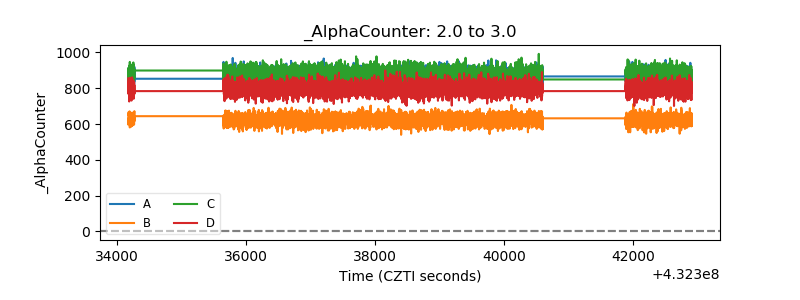 |
| _CPM_Rate | 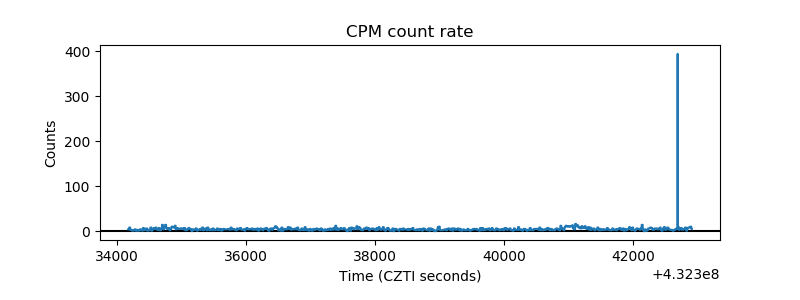 |
| CZT Counter | 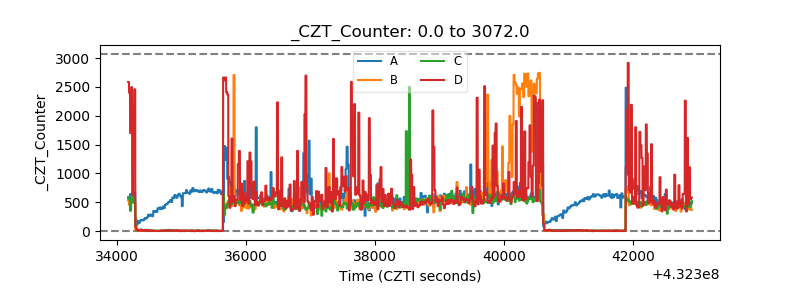 |
| +2.5 Volts monitor | 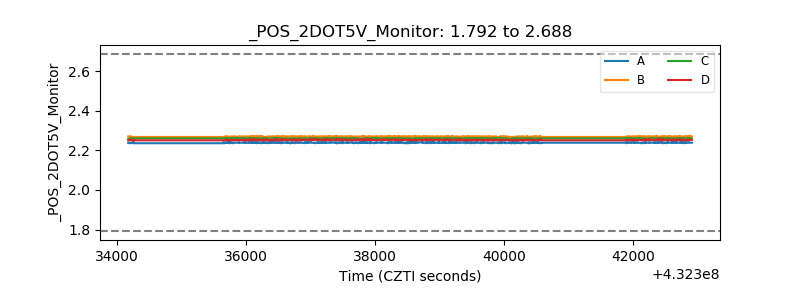 |
| +5 Volts monitor | 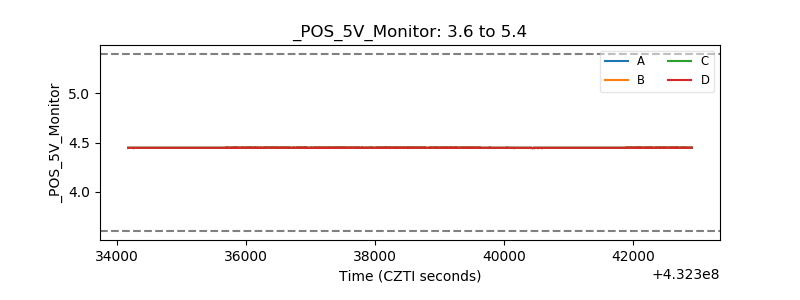 |
| _ROLL_ROT | 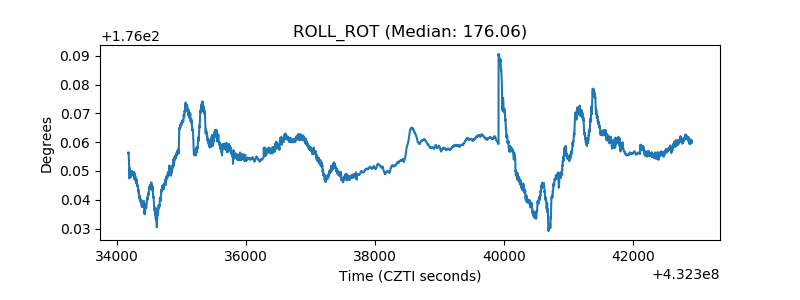 |
| _Roll_DEC | 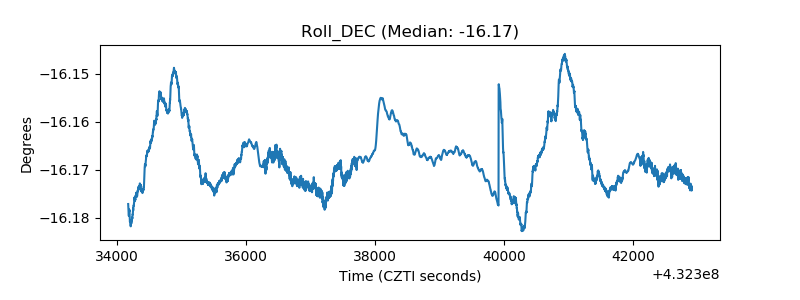 |
| _Roll_RA | 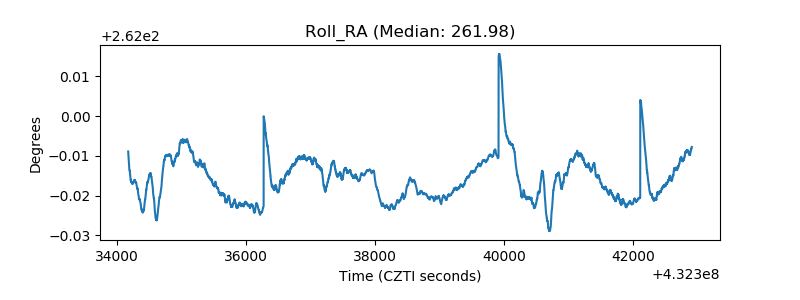 |
| Veto Counter | 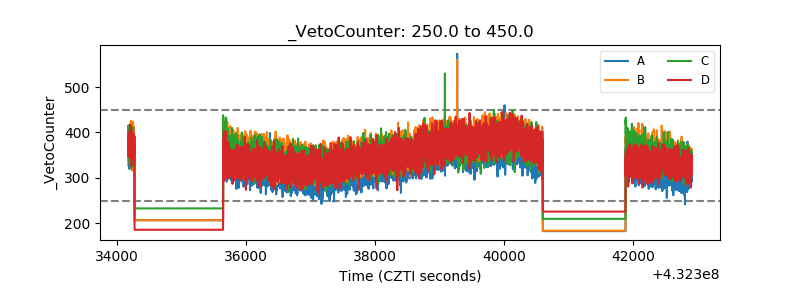 |