| Param | Original file | Final file |
|---|---|---|
| Filename | modeM0/AS1T05_148T01_9000005838_43047cztM0_level2.fits | modeM0/AS1T05_148T01_9000005838_43047cztM0_level2_quad_clean.evt |
| Size (bytes) | 857,090,880 | 188,366,400 |
| Size | 817.4 MB | 179.6 MB |
| Events in quadrant A | 6,367,022 | 1,366,613 |
| Events in quadrant B | 10,665,672 | 1,097,197 |
| Events in quadrant C | 5,273,981 | 1,330,018 |
| Events in quadrant D | 8,588,567 | 1,165,891 |
| Mode M9 | |||
|---|---|---|---|
| Quadrant | BADHDUFLAG | Total packets | Discarded packets |
| A | 0 | 35 | 0 |
| B | 0 | 36 | 0 |
| C | 0 | 36 | 0 |
| D | 0 | 36 | 0 |
| Mode SS | |||
|---|---|---|---|
| Quadrant | BADHDUFLAG | Total packets | Discarded packets |
| A | 0 | 220 | 0 |
| B | 0 | 220 | 0 |
| C | 0 | 220 | 0 |
| D | 0 | 220 | 0 |
| Mode M0 | |||
|---|---|---|---|
| Quadrant | BADHDUFLAG | Total packets | Discarded packets |
| A | 0 | 25945 | 3 |
| B | 0 | 39109 | 3 |
| C | 0 | 21871 | 3 |
| D | 0 | 33052 | 3 |
| Quadrant | Total seconds | Saturated seconds | Saturation percentage |
|---|---|---|---|
| A | 10738 | 86 | 0.800894% |
| B | 10738 | 2281 | 21.242317% |
| C | 10738 | 5 | 0.046564% |
| D | 10738 | 466 | 4.339728% |
Noise dominated data is calculated using 1-second bins in cleaned event files. If a bin has >2000 counts, and if more than 50% of those come from <1% of pixels, then it is considered to be noise-dominated and hence unusable.
| Quadrant | # 1 sec bins | Bins with >0 counts | Bins with >2000 counts | High rate bins dominated by noise | Noise dominated (total time) | Noise dominated (detector-on time) | Marked lightcurve |
|---|---|---|---|---|---|---|---|
| A | 13452 | 10740 | 50 | 50 | 0.37% | 0.47% | 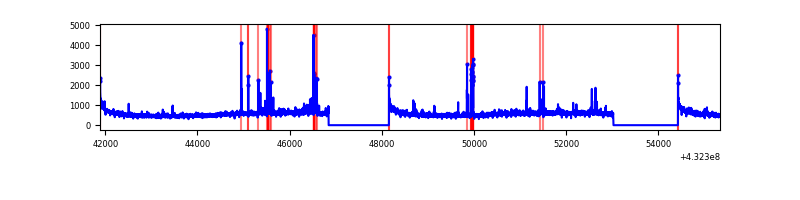 |
| B | 13452 | 10740 | 1785 | 1785 | 13.27% | 16.62% | 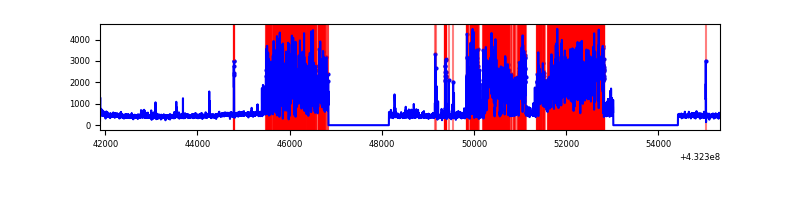 |
| C | 13452 | 10740 | 0 | 0 | 0.00% | 0.00% | 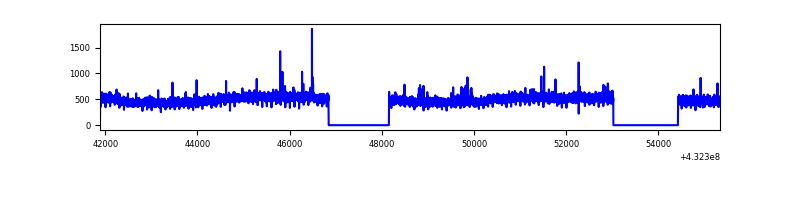 |
| D | 13452 | 10740 | 403 | 403 | 3.00% | 3.75% | 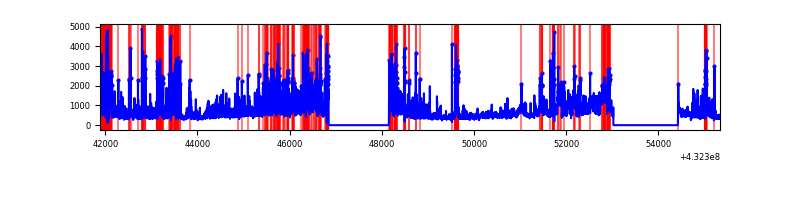 |
Top three noisy pixels from each quadrant. If the there are fewer than three noisy pixels in the level2.evt file, extra rows are filled as -1
| Pixel properties | Quadrant properties | ||||||
|---|---|---|---|---|---|---|---|
| Quadrant | DetID | PixID | Counts | Sigma | Mean | Median | Sigma |
| A | 10 | 83 | 1082664 | 4094.54 | 1254 | 1235 | 264.1 |
| A | 15 | 237 | 224731 | 846.21 | 1254 | 1235 | 264.1 |
| A | 12 | 189 | 155366 | 583.58 | 1254 | 1235 | 264.1 |
| B | 0 | 186 | 4268646 | 19026.93 | 1132 | 1106 | 224.3 |
| B | 0 | 229 | 1691617 | 7537.18 | 1132 | 1106 | 224.3 |
| B | 4 | 171 | 80635 | 354.58 | 1132 | 1106 | 224.3 |
| C | 15 | 214 | 473063 | 1603.69 | 1220 | 1233 | 294.2 |
| C | 14 | 254 | 24518 | 79.14 | 1220 | 1233 | 294.2 |
| C | 7 | 220 | 13153 | 40.51 | 1220 | 1233 | 294.2 |
| D | 1 | 52 | 1975473 | 6471.03 | 1193 | 1156 | 305.1 |
| D | 2 | 16 | 1222662 | 4003.61 | 1193 | 1156 | 305.1 |
| D | 13 | 249 | 457622 | 1496.12 | 1193 | 1156 | 305.1 |
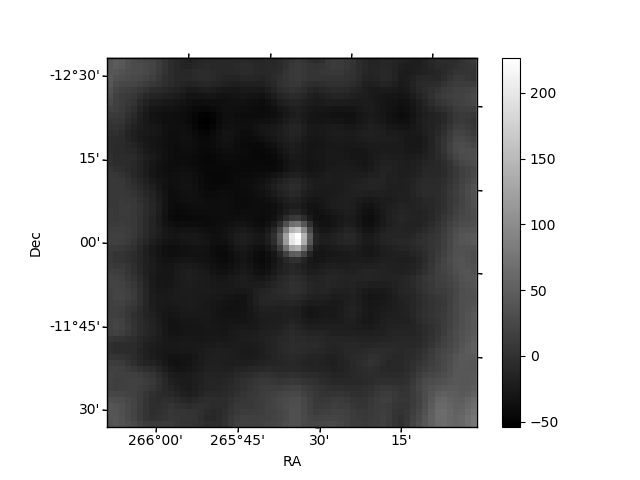
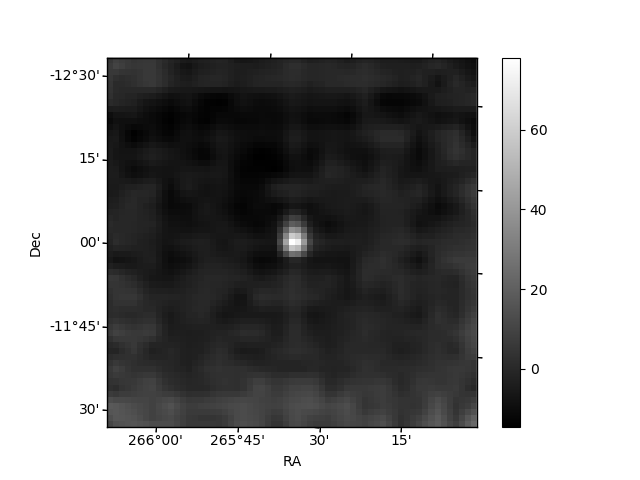
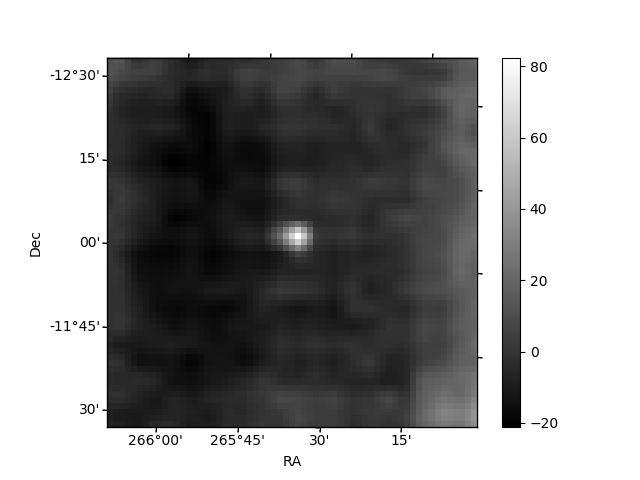
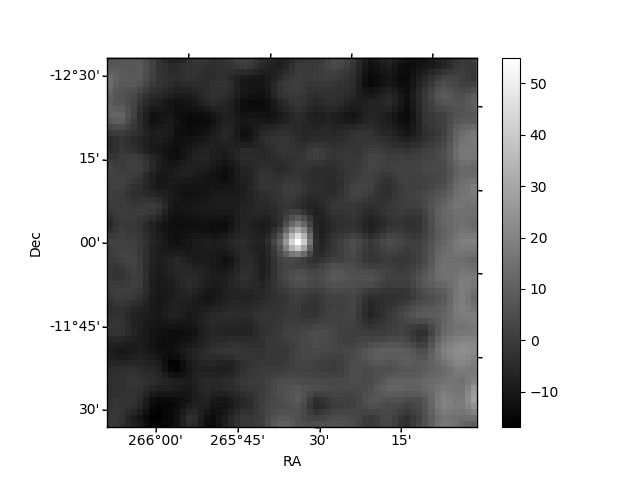
Histogram calculated using DETX and DETY for each event in the final _common_clean file
| Quadrant A | 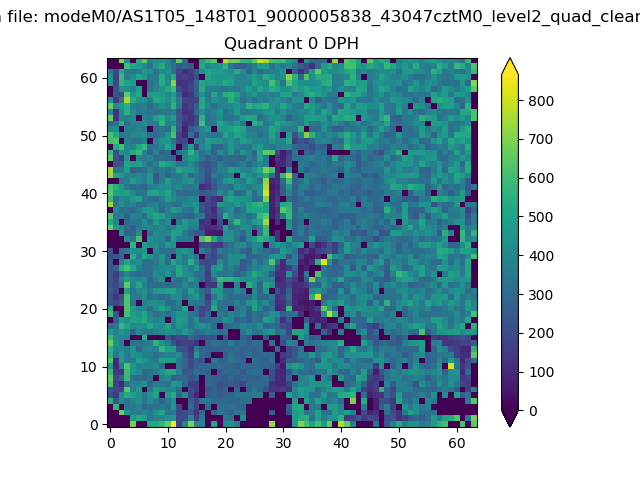 |
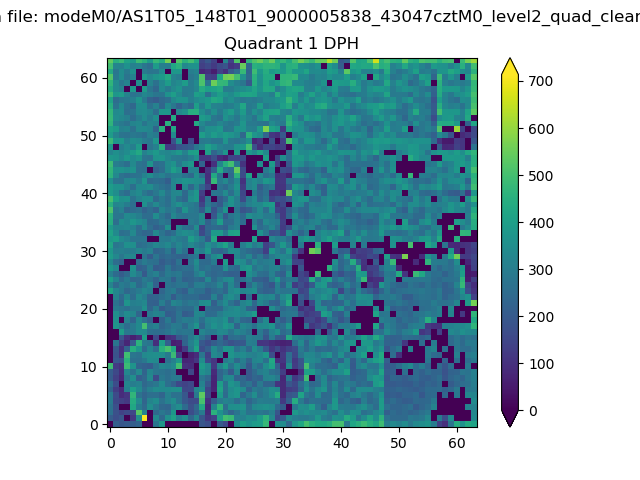 |
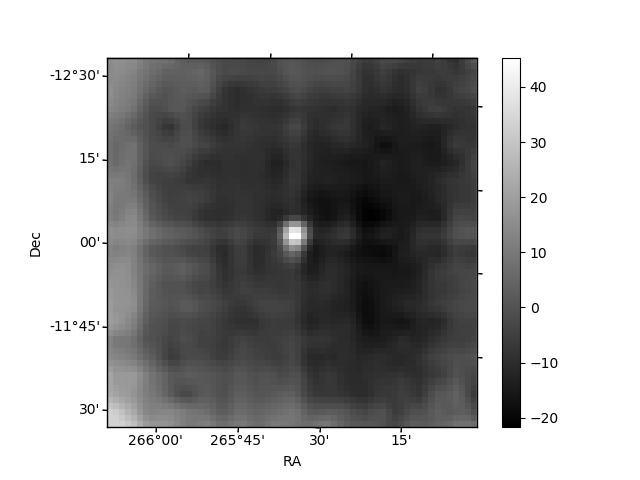
Quadrant B |
|---|---|---|---|
| Quadrant D | 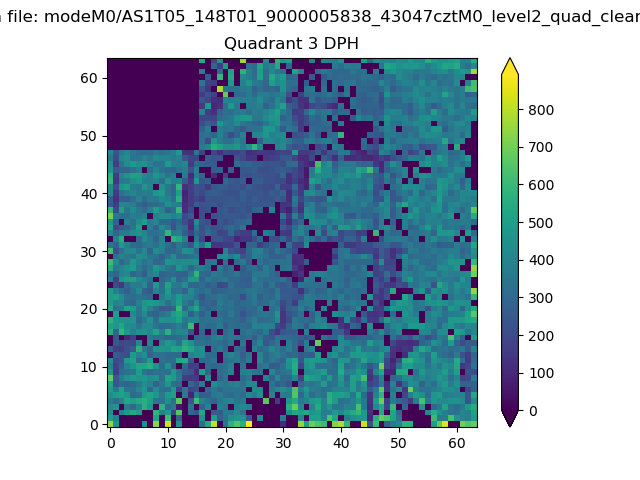 |
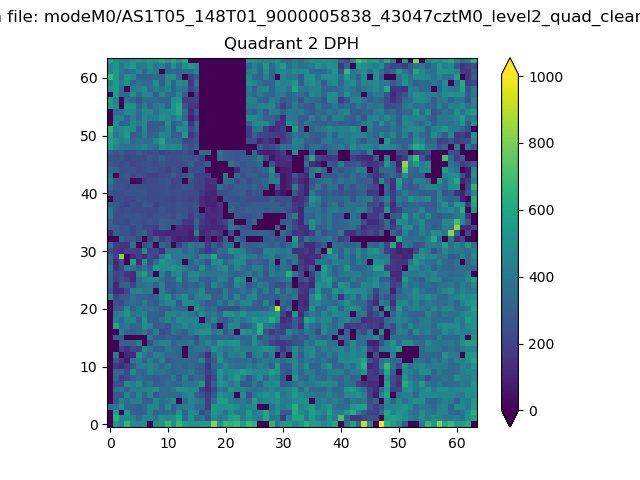 |
Quadrant C |
| Plot type | Count rate plots | Images |
|---|---|---|
| Comparison with Poisson distribution Blue bars denote a histogram of data divided into 1 sec bins. Red curve is a Poisson curve with rate = median count rate of data. |
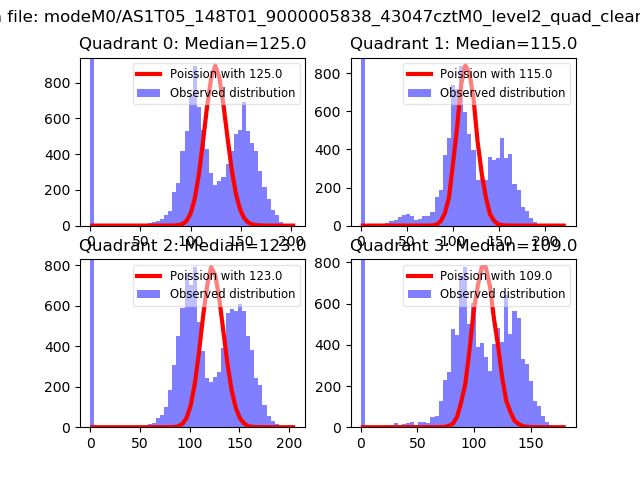 |
 |
| Quadrant-wise count rates Data is divided into 100 sec bins |
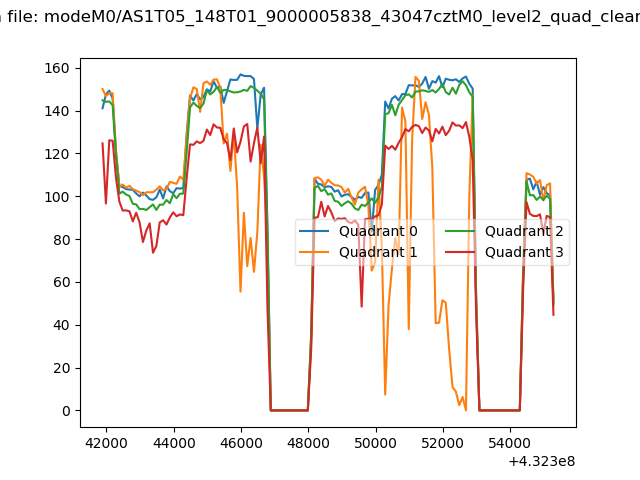 |
|
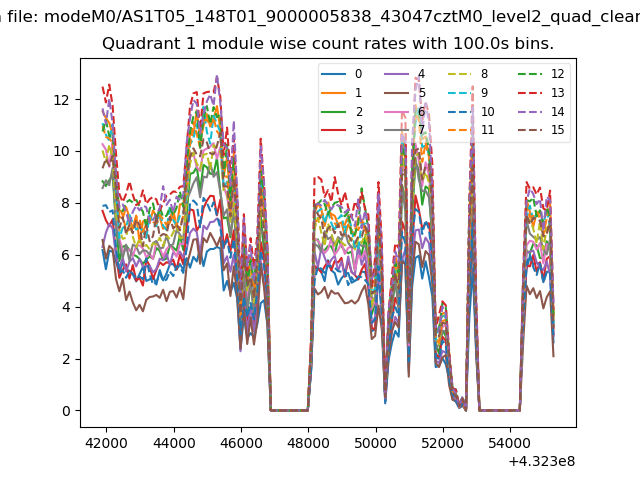
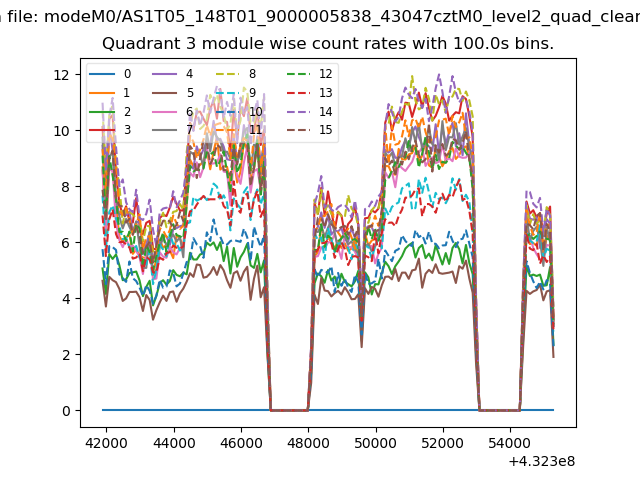
| Module-wise count rates for Quadrant A Data is divided into 100 sec bins |
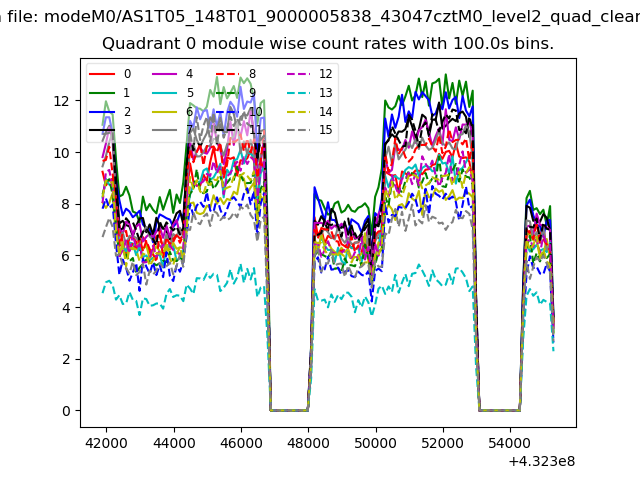 |
 |
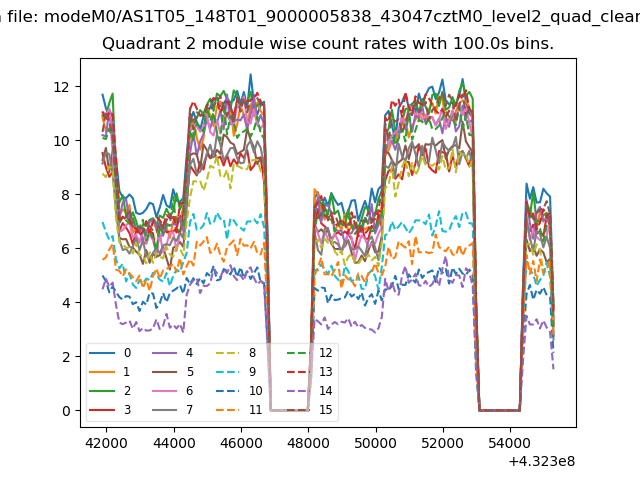
| Module-wise count rates for Quadrant B Data is divided into 100 sec bins |
 |
 |
| Module-wise count rates for Quadrant C Data is divided into 100 sec bins |
 |
 |
| Module-wise count rates for Quadrant D Data is divided into 100 sec bins |
 |
 |
| Parameter | Plot |
|---|---|
| CZT HV Monitor |  |
| D_VDD | 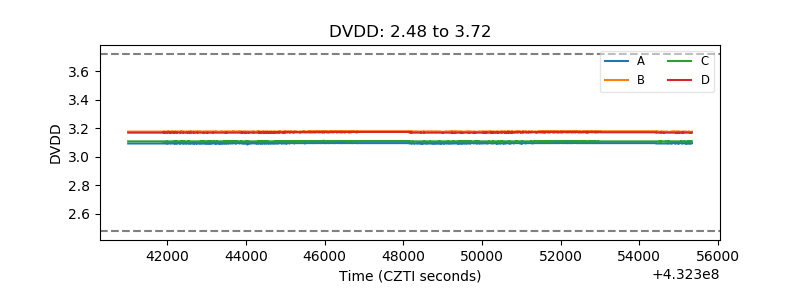 |
| Temperature 1 | 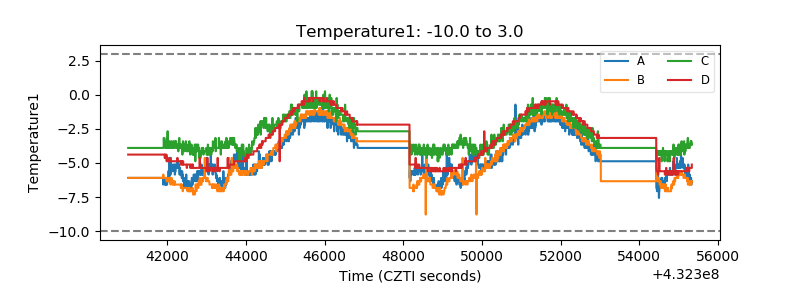 |
| Veto HV Monitor | 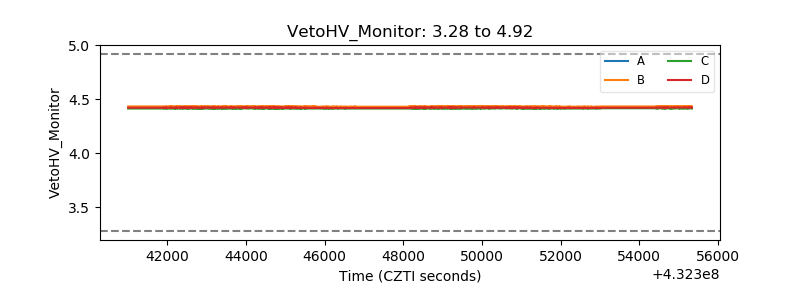 |
| Veto LLD | 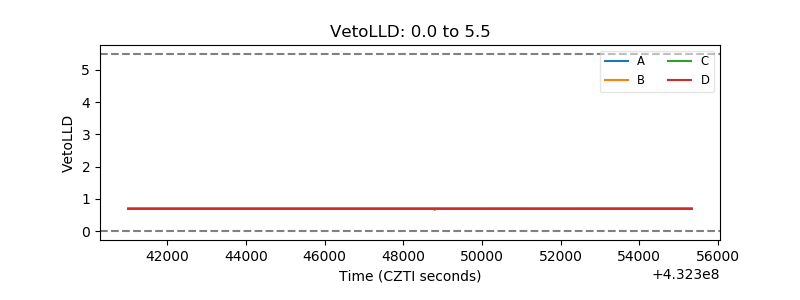 |
| Alpha Counter | 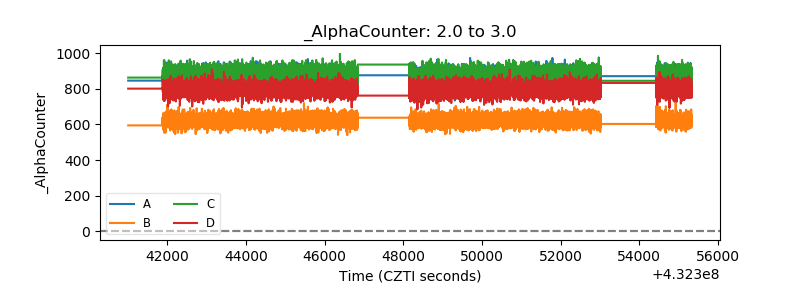 |
| _CPM_Rate |  |
| CZT Counter | 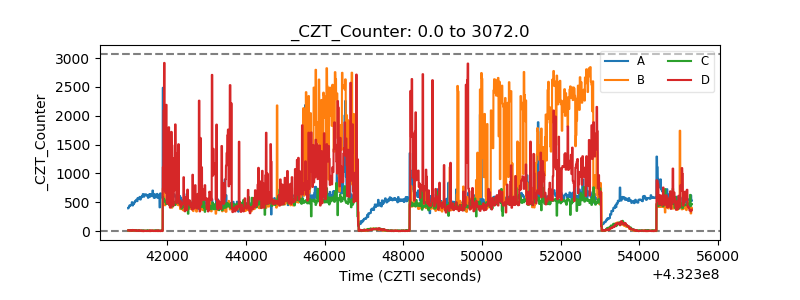 |
| +2.5 Volts monitor | 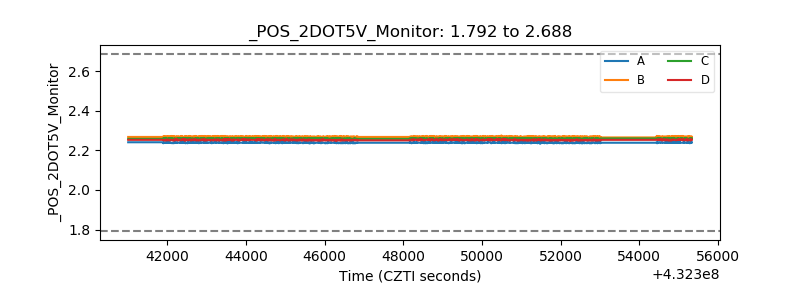 |
| +5 Volts monitor | 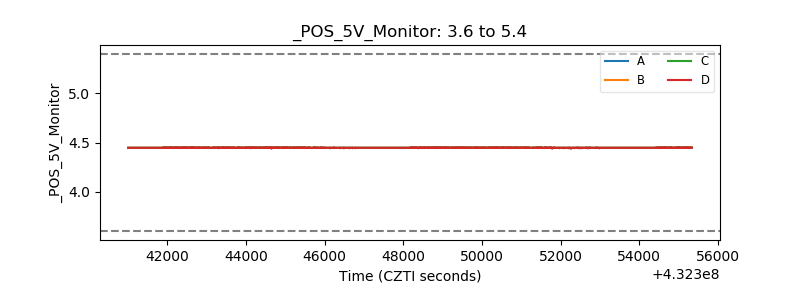 |
| _ROLL_ROT | 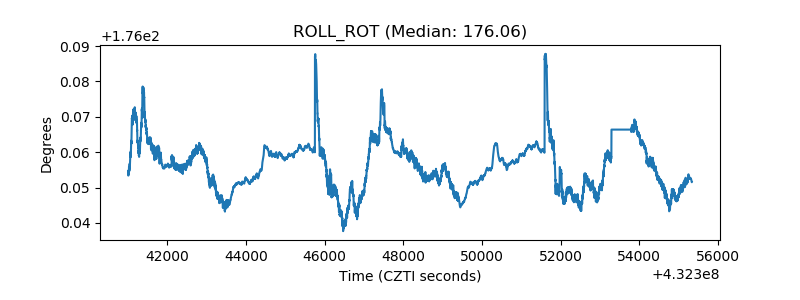 |
| _Roll_DEC | 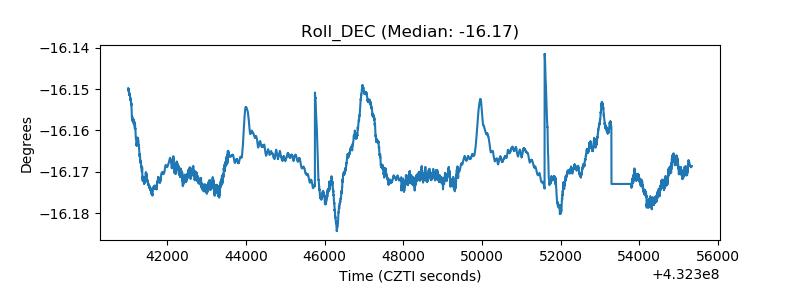 |
| _Roll_RA | 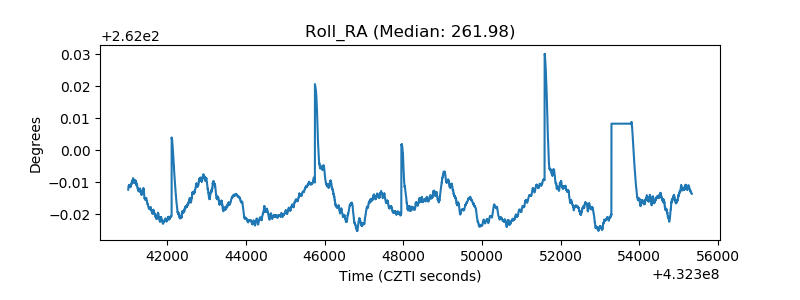 |
| Veto Counter | 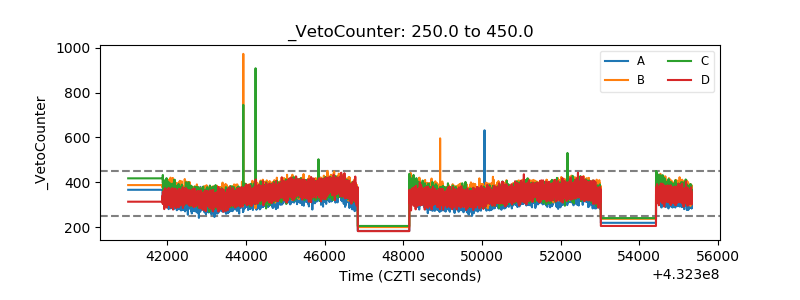 |