| Param | Original file | Final file |
|---|---|---|
| Filename | modeM0/AS1T05_148T01_9000005838_43048cztM0_level2.fits | modeM0/AS1T05_148T01_9000005838_43048cztM0_level2_quad_clean.evt |
| Size (bytes) | 464,935,680 | 105,762,240 |
| Size | 443.4 MB | 100.9 MB |
| Events in quadrant A | 3,697,360 | 773,932 |
| Events in quadrant B | 5,383,051 | 613,400 |
| Events in quadrant C | 2,985,103 | 747,072 |
| Events in quadrant D | 4,685,954 | 655,242 |
| Mode M9 | |||
|---|---|---|---|
| Quadrant | BADHDUFLAG | Total packets | Discarded packets |
| A | 0 | 29 | 0 |
| B | 0 | 29 | 0 |
| C | 0 | 29 | 0 |
| D | 0 | 29 | 0 |
| Mode SS | |||
|---|---|---|---|
| Quadrant | BADHDUFLAG | Total packets | Discarded packets |
| A | 0 | 124 | 0 |
| B | 0 | 124 | 0 |
| C | 0 | 124 | 0 |
| D | 0 | 124 | 0 |
| Mode M0 | |||
|---|---|---|---|
| Quadrant | BADHDUFLAG | Total packets | Discarded packets |
| A | 0 | 15026 | 2 |
| B | 0 | 19921 | 2 |
| C | 0 | 12154 | 2 |
| D | 0 | 17978 | 2 |
| Quadrant | Total seconds | Saturated seconds | Saturation percentage |
|---|---|---|---|
| A | 5903 | 42 | 0.711503% |
| B | 5904 | 1225 | 20.748645% |
| C | 5904 | 20 | 0.338753% |
| D | 5904 | 233 | 3.946477% |
Noise dominated data is calculated using 1-second bins in cleaned event files. If a bin has >2000 counts, and if more than 50% of those come from <1% of pixels, then it is considered to be noise-dominated and hence unusable.
| Quadrant | # 1 sec bins | Bins with >0 counts | Bins with >2000 counts | High rate bins dominated by noise | Noise dominated (total time) | Noise dominated (detector-on time) | Marked lightcurve |
|---|---|---|---|---|---|---|---|
| A | 8859 | 5905 | 19 | 19 | 0.21% | 0.32% | 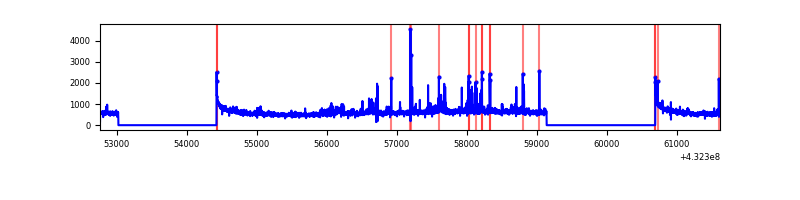 |
| B | 8860 | 5906 | 933 | 933 | 10.53% | 15.80% | 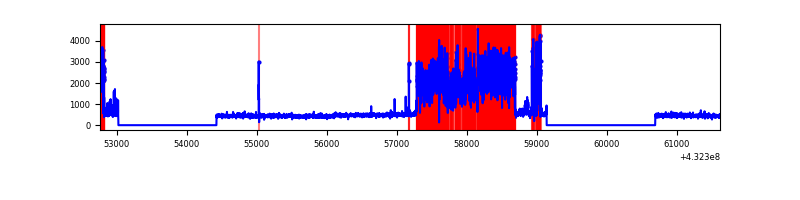 |
| C | 8860 | 5906 | 15 | 15 | 0.17% | 0.25% | 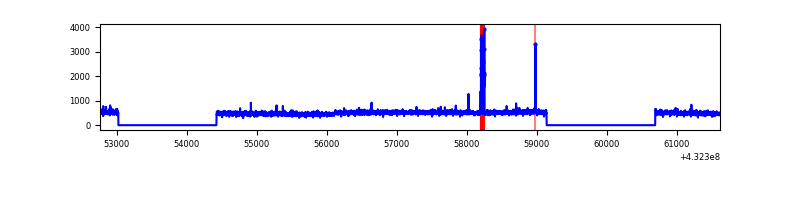 |
| D | 8860 | 5906 | 183 | 183 | 2.07% | 3.10% | 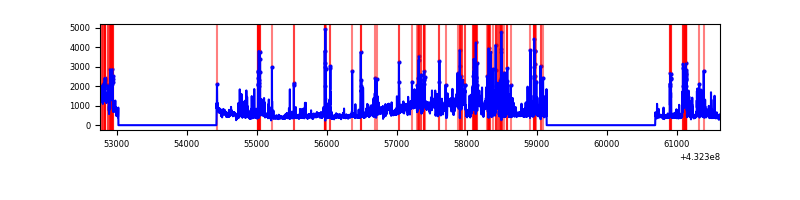 |
Top three noisy pixels from each quadrant. If the there are fewer than three noisy pixels in the level2.evt file, extra rows are filled as -1
| Pixel properties | Quadrant properties | ||||||
|---|---|---|---|---|---|---|---|
| Quadrant | DetID | PixID | Counts | Sigma | Mean | Median | Sigma |
| A | 10 | 83 | 650476 | 4327.22 | 696 | 686 | 150.2 |
| A | 15 | 222 | 166455 | 1103.92 | 696 | 686 | 150.2 |
| A | 15 | 237 | 134634 | 892.01 | 696 | 686 | 150.2 |
| B | 0 | 186 | 2508174 | 20030.82 | 627 | 612 | 125.2 |
| B | 3 | 112 | 323613 | 2580.19 | 627 | 612 | 125.2 |
| B | 15 | 32 | 30638 | 239.85 | 627 | 612 | 125.2 |
| C | 15 | 214 | 261780 | 1582.55 | 676 | 684 | 165.0 |
| C | 14 | 254 | 67014 | 402.04 | 676 | 684 | 165.0 |
| C | 7 | 220 | 11603 | 66.18 | 676 | 684 | 165.0 |
| D | 2 | 16 | 1006592 | 5841.57 | 661 | 640 | 172.2 |
| D | 13 | 249 | 437543 | 2537.1 | 661 | 640 | 172.2 |
| D | 1 | 52 | 357684 | 2073.36 | 661 | 640 | 172.2 |
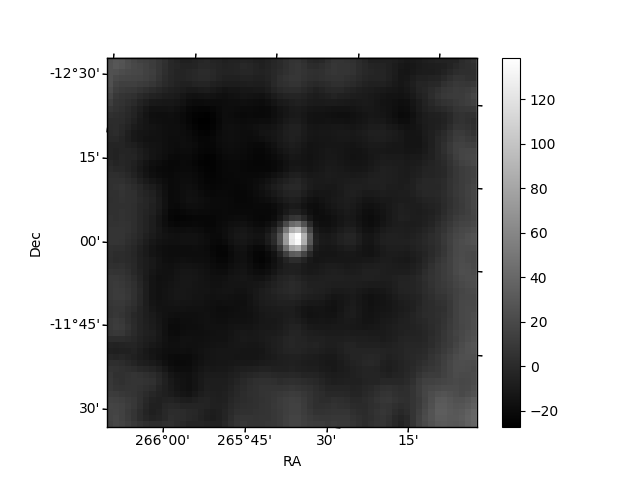
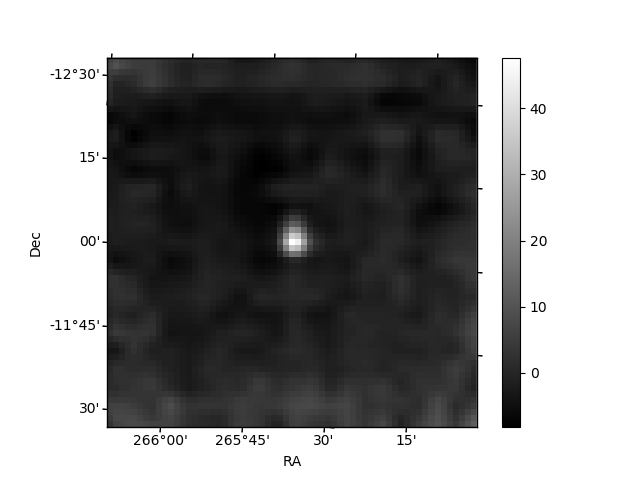
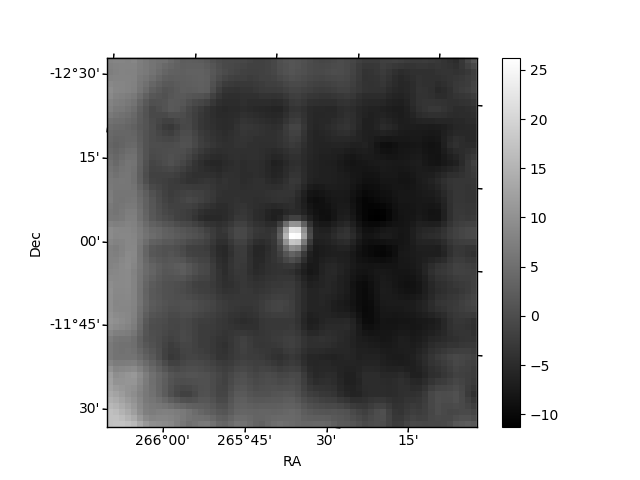
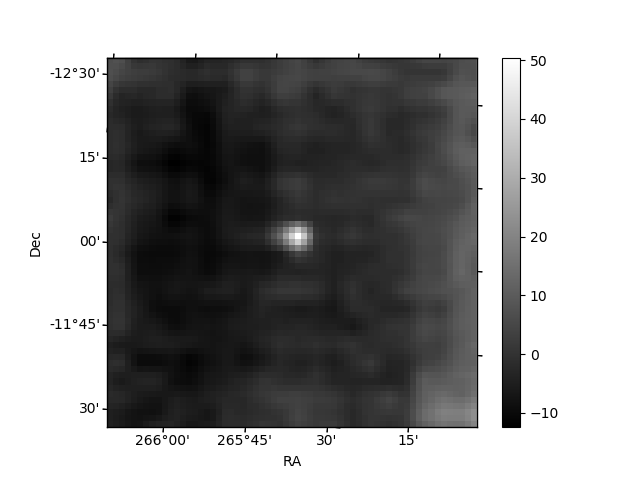
Histogram calculated using DETX and DETY for each event in the final _common_clean file
| Quadrant A | 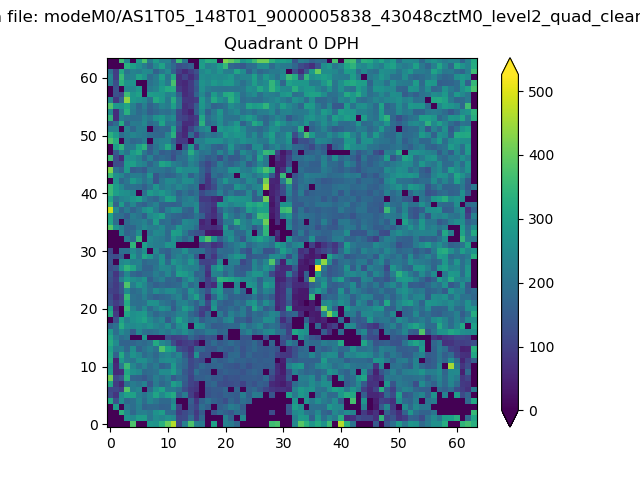 |
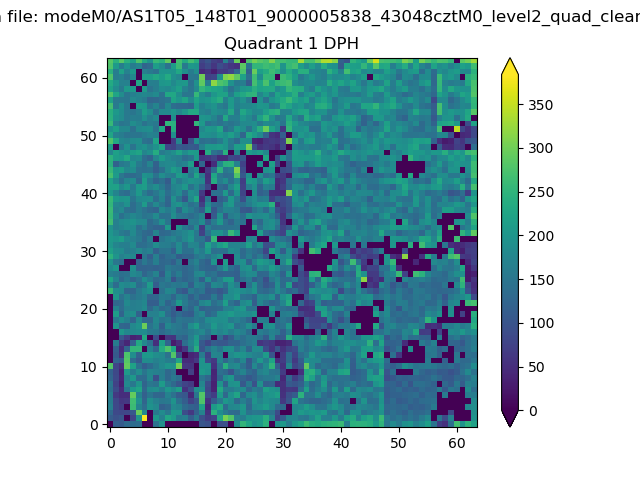 |
Quadrant B |
|---|---|---|---|
| Quadrant D | 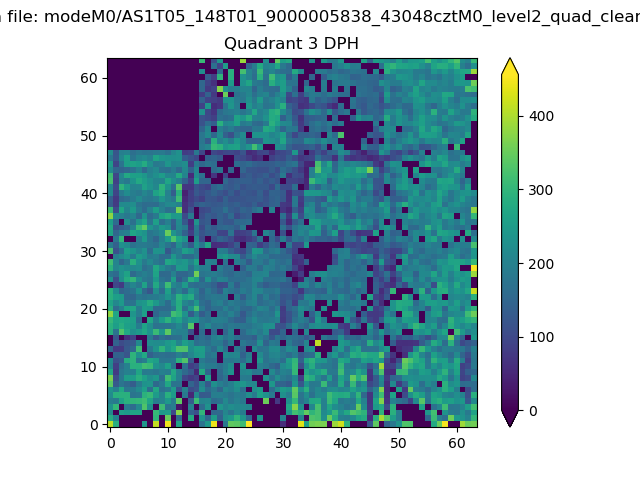 |
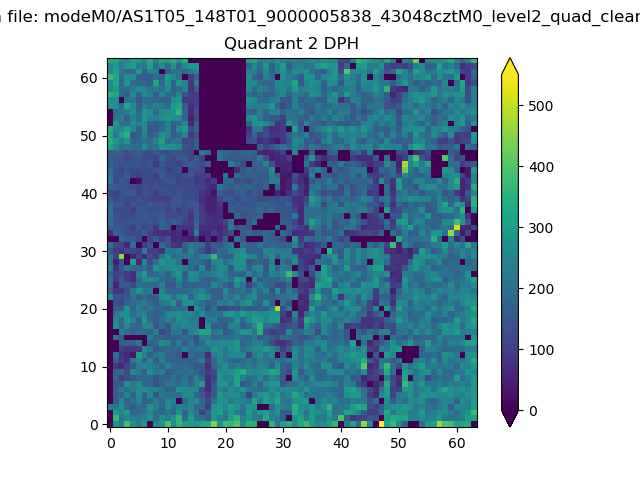 |
Quadrant C |
| Plot type | Count rate plots | Images |
|---|---|---|
| Comparison with Poisson distribution Blue bars denote a histogram of data divided into 1 sec bins. Red curve is a Poisson curve with rate = median count rate of data. |
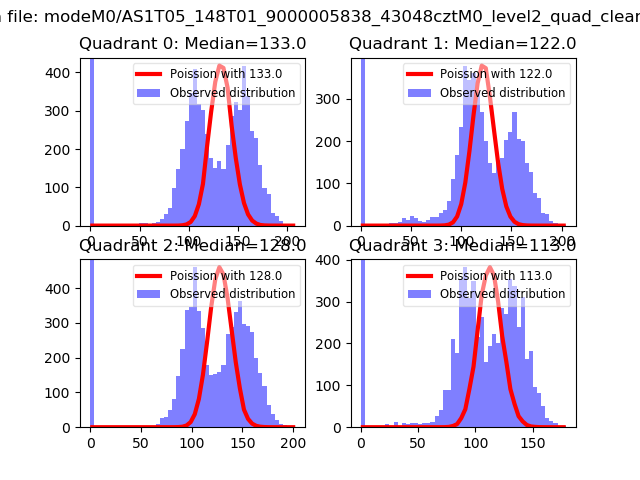 |
 |
| Quadrant-wise count rates Data is divided into 100 sec bins |
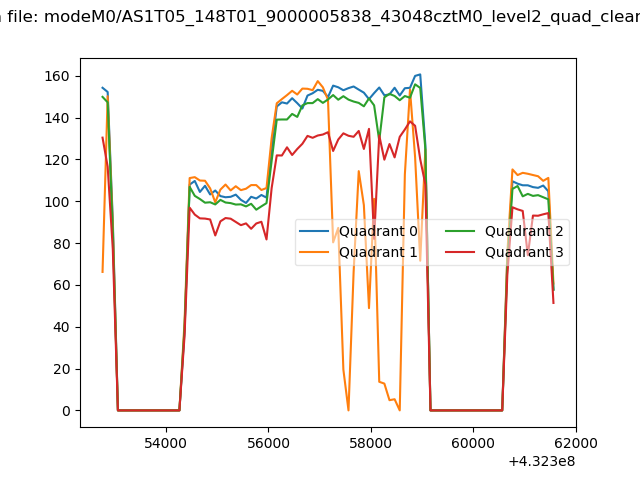 |
|
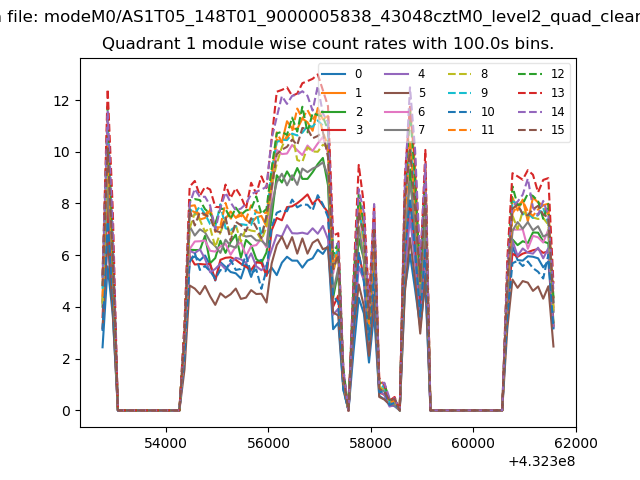
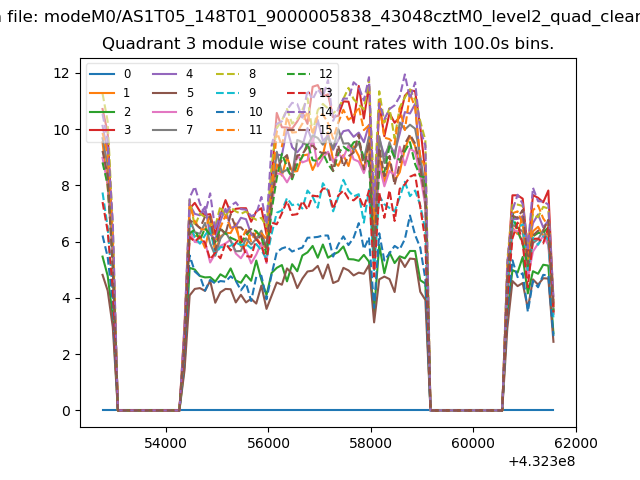
| Module-wise count rates for Quadrant A Data is divided into 100 sec bins |
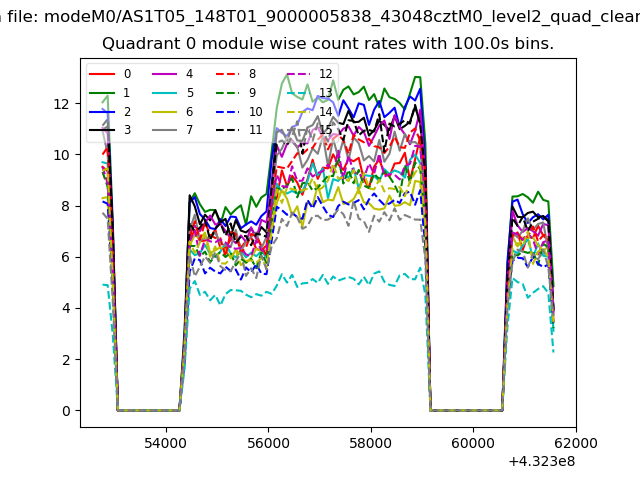 |
 |
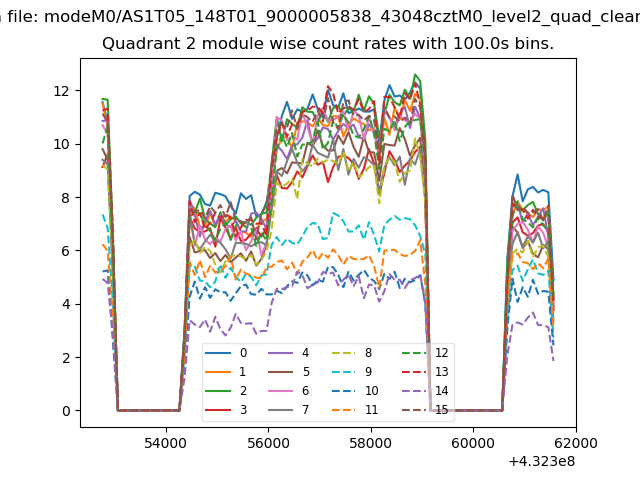
| Module-wise count rates for Quadrant B Data is divided into 100 sec bins |
 |
 |
| Module-wise count rates for Quadrant C Data is divided into 100 sec bins |
 |
 |
| Module-wise count rates for Quadrant D Data is divided into 100 sec bins |
 |
 |
| Parameter | Plot |
|---|---|
| CZT HV Monitor | 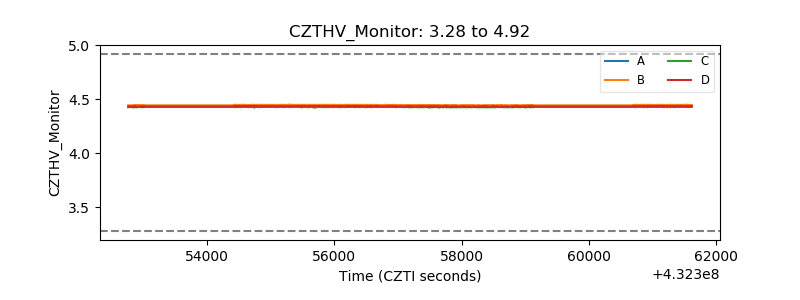 |
| D_VDD | 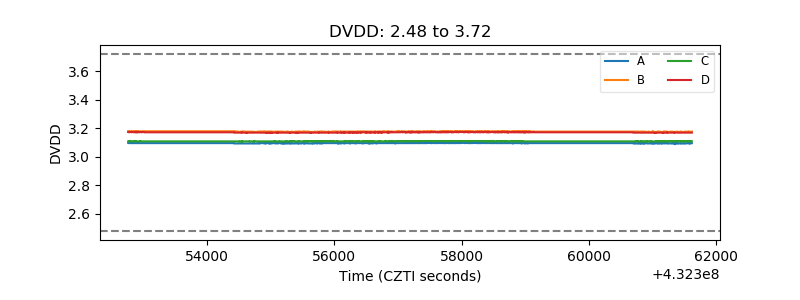 |
| Temperature 1 | 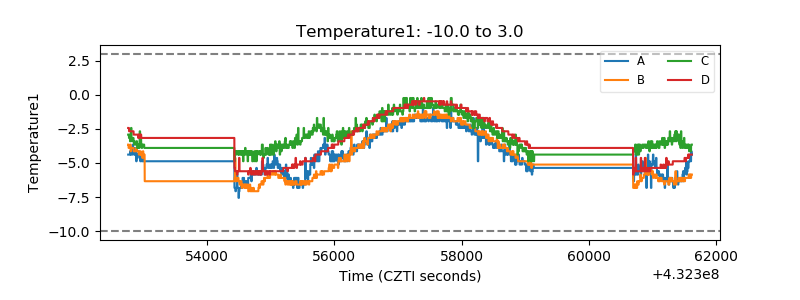 |
| Veto HV Monitor | 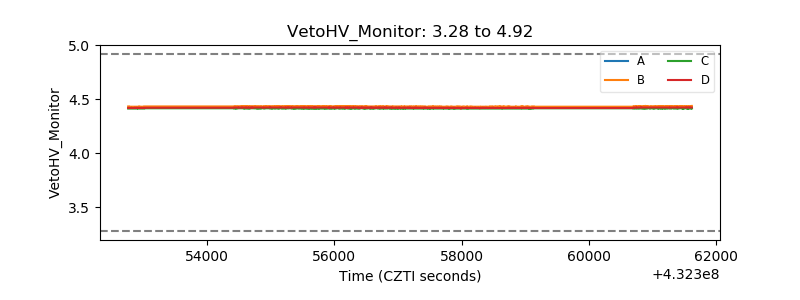 |
| Veto LLD | 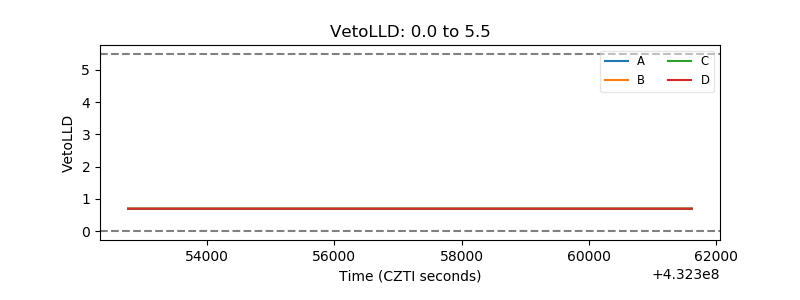 |
| Alpha Counter | 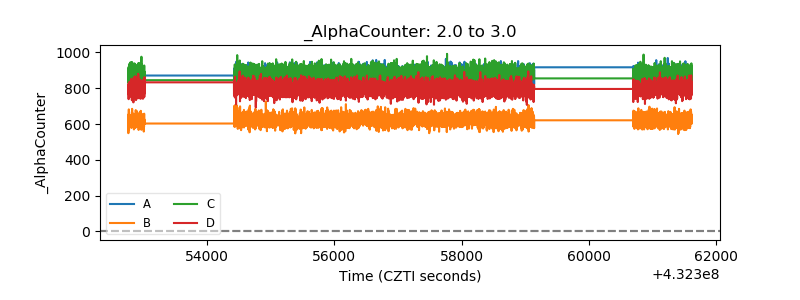 |
| _CPM_Rate |  |
| CZT Counter | 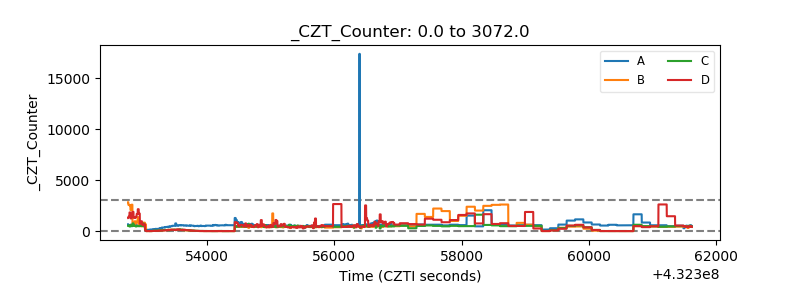 |
| +2.5 Volts monitor | 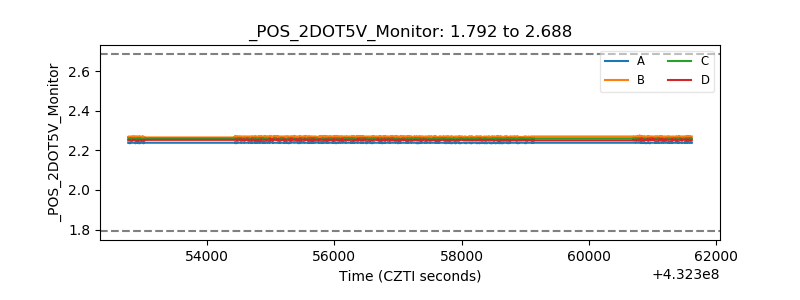 |
| +5 Volts monitor | 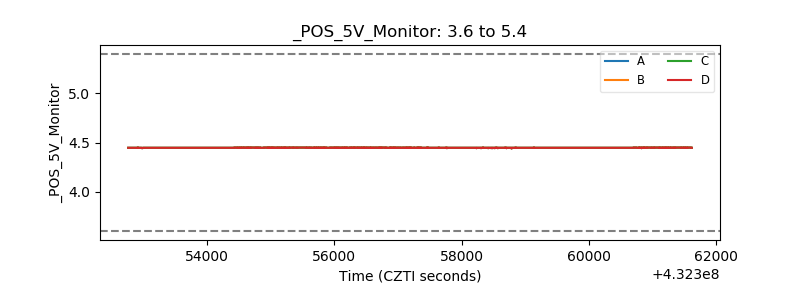 |
| _ROLL_ROT | 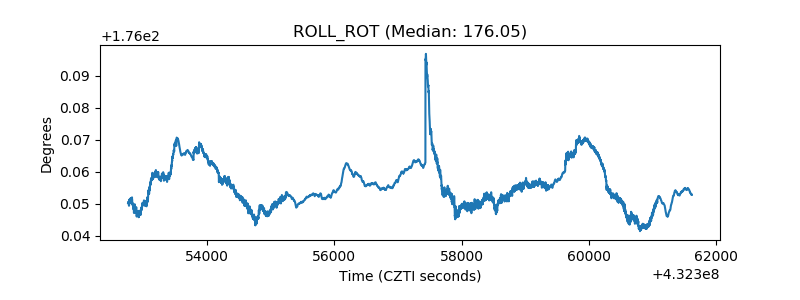 |
| _Roll_DEC | 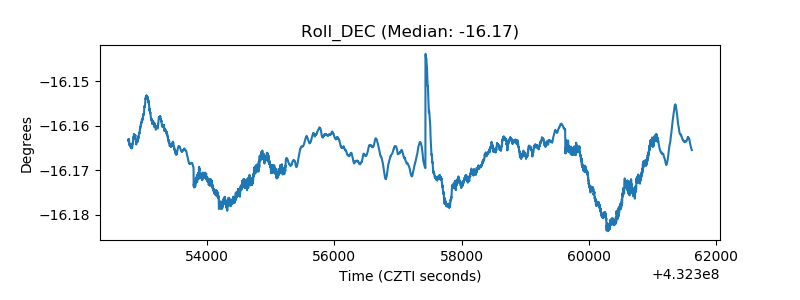 |
| _Roll_RA | 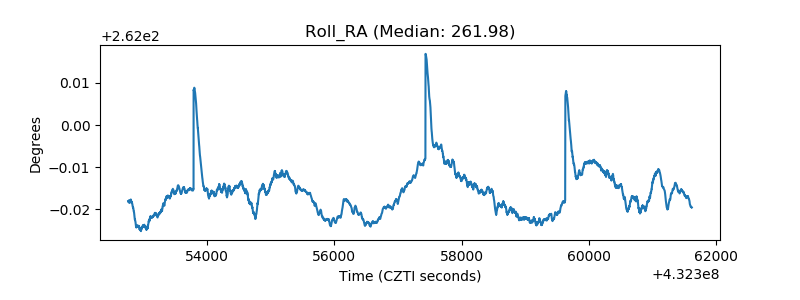 |
| Veto Counter | 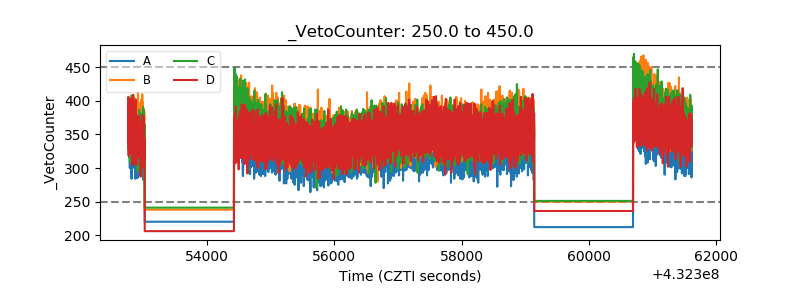 |