| Param | Original file | Final file |
|---|---|---|
| Filename | modeM0/AS1T05_148T01_9000005838_43049cztM0_level2.fits | modeM0/AS1T05_148T01_9000005838_43049cztM0_level2_quad_clean.evt |
| Size (bytes) | 464,935,680 | 100,149,120 |
| Size | 443.4 MB | 95.5 MB |
| Events in quadrant A | 3,921,457 | 741,046 |
| Events in quadrant B | 5,162,896 | 586,365 |
| Events in quadrant C | 2,766,089 | 726,220 |
| Events in quadrant D | 4,932,708 | 594,454 |
| Mode M9 | |||
|---|---|---|---|
| Quadrant | BADHDUFLAG | Total packets | Discarded packets |
| A | 0 | 28 | 0 |
| B | 0 | 29 | 0 |
| C | 0 | 29 | 0 |
| D | 0 | 29 | 0 |
| Mode SS | |||
|---|---|---|---|
| Quadrant | BADHDUFLAG | Total packets | Discarded packets |
| A | 0 | 112 | 0 |
| B | 0 | 112 | 0 |
| C | 0 | 112 | 0 |
| D | 0 | 112 | 0 |
| Mode M0 | |||
|---|---|---|---|
| Quadrant | BADHDUFLAG | Total packets | Discarded packets |
| A | 0 | 15444 | 2 |
| B | 0 | 18820 | 2 |
| C | 0 | 11163 | 2 |
| D | 0 | 18348 | 2 |
| Quadrant | Total seconds | Saturated seconds | Saturation percentage |
|---|---|---|---|
| A | 5495 | 111 | 2.020018% |
| B | 5495 | 1236 | 22.493176% |
| C | 5494 | 5 | 0.091008% |
| D | 5494 | 572 | 10.411358% |
Noise dominated data is calculated using 1-second bins in cleaned event files. If a bin has >2000 counts, and if more than 50% of those come from <1% of pixels, then it is considered to be noise-dominated and hence unusable.
| Quadrant | # 1 sec bins | Bins with >0 counts | Bins with >2000 counts | High rate bins dominated by noise | Noise dominated (total time) | Noise dominated (detector-on time) | Marked lightcurve |
|---|---|---|---|---|---|---|---|
| A | 7138 | 5496 | 74 | 74 | 1.04% | 1.35% | 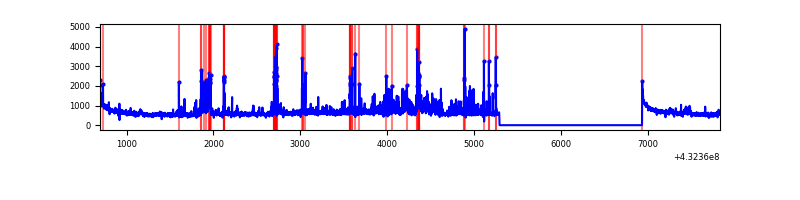 |
| B | 7138 | 5496 | 964 | 964 | 13.51% | 17.54% | 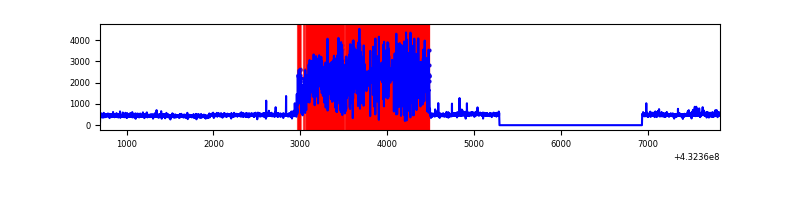 |
| C | 7137 | 5495 | 1 | 1 | 0.01% | 0.02% | 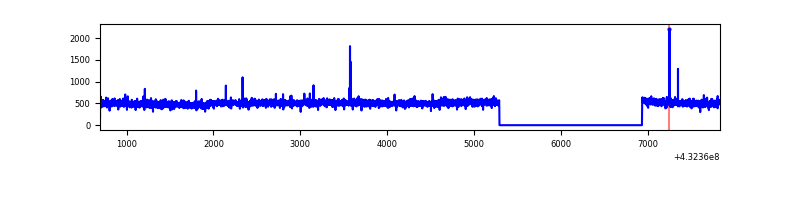 |
| D | 7137 | 5495 | 502 | 502 | 7.03% | 9.14% | 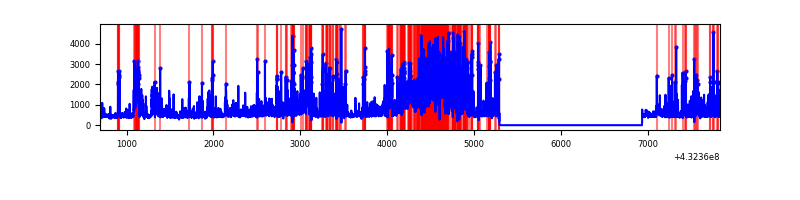 |
Top three noisy pixels from each quadrant. If the there are fewer than three noisy pixels in the level2.evt file, extra rows are filled as -1
| Pixel properties | Quadrant properties | ||||||
|---|---|---|---|---|---|---|---|
| Quadrant | DetID | PixID | Counts | Sigma | Mean | Median | Sigma |
| A | 10 | 83 | 615734 | 4315.01 | 657 | 647 | 142.5 |
| A | 15 | 237 | 352265 | 2466.7 | 657 | 647 | 142.5 |
| A | 15 | 222 | 322993 | 2261.35 | 657 | 647 | 142.5 |
| B | 0 | 186 | 2836257 | 24350.07 | 577 | 565 | 116.5 |
| B | 4 | 171 | 20305 | 169.51 | 577 | 565 | 116.5 |
| B | 0 | 229 | 17737 | 147.46 | 577 | 565 | 116.5 |
| C | 15 | 214 | 244129 | 1535.71 | 640 | 647 | 158.5 |
| C | 14 | 254 | 12464 | 74.53 | 640 | 647 | 158.5 |
| C | 7 | 220 | 5856 | 32.85 | 640 | 647 | 158.5 |
| D | 13 | 249 | 1434173 | 9010.95 | 609 | 592 | 159.1 |
| D | 1 | 52 | 895251 | 5623.49 | 609 | 592 | 159.1 |
| D | 12 | 6 | 256179 | 1606.52 | 609 | 592 | 159.1 |
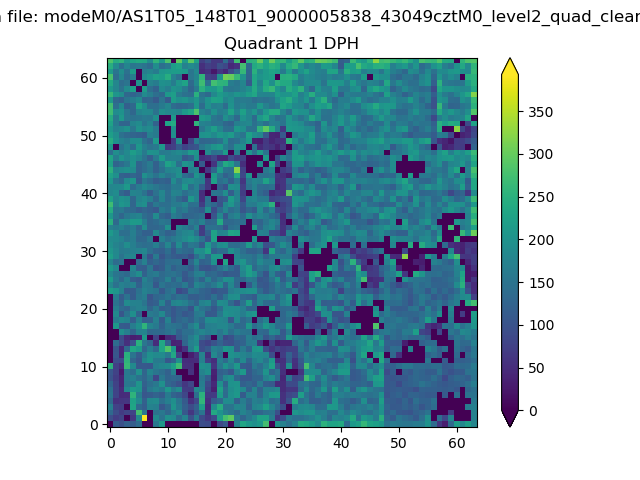
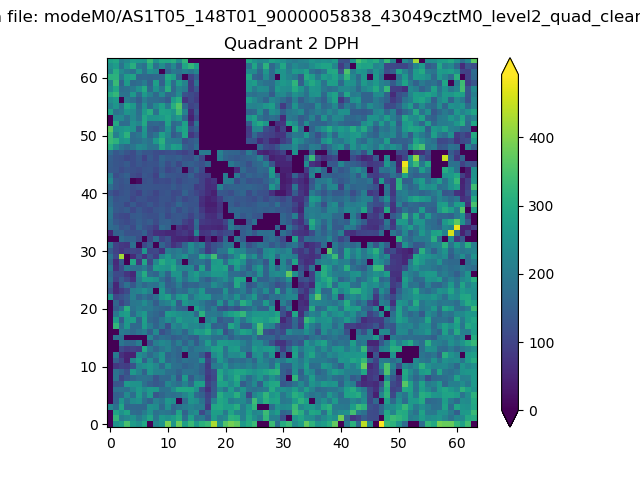
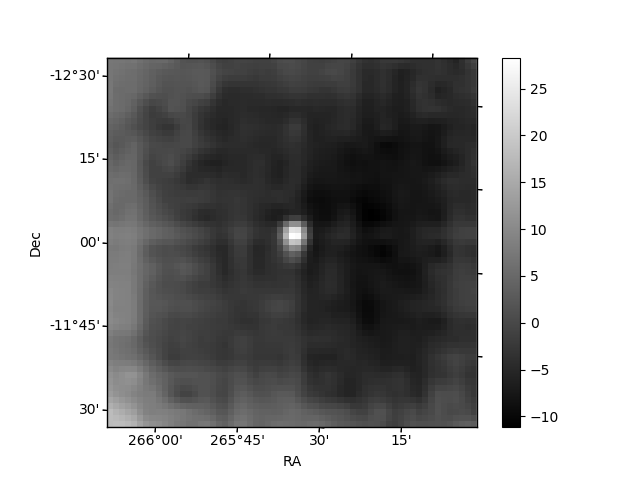
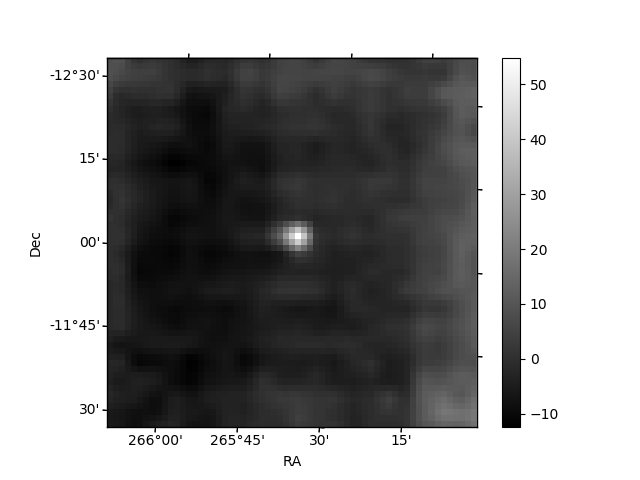
Histogram calculated using DETX and DETY for each event in the final _common_clean file
| Quadrant A | 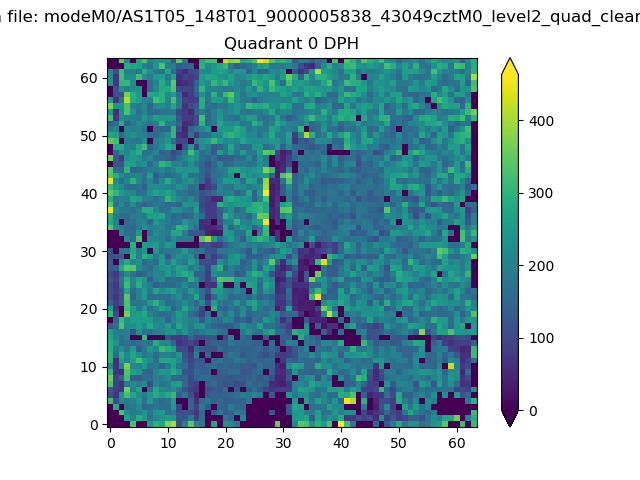 |
 |
Quadrant B |
|---|---|---|---|
| Quadrant D |  |
 |
Quadrant C |
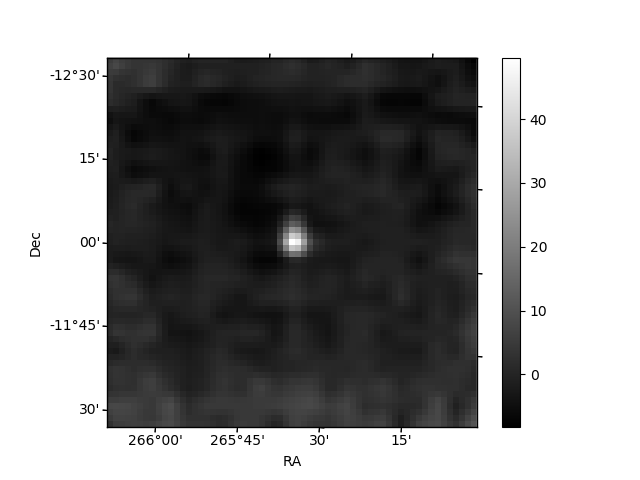
| Plot type | Count rate plots | Images |
|---|---|---|
| Comparison with Poisson distribution Blue bars denote a histogram of data divided into 1 sec bins. Red curve is a Poisson curve with rate = median count rate of data. |
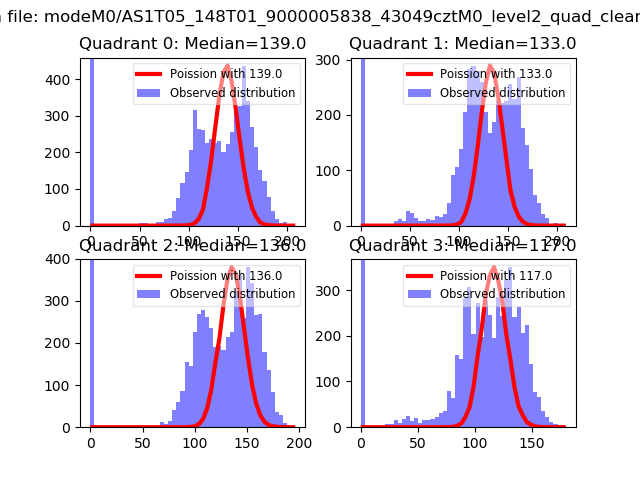 |
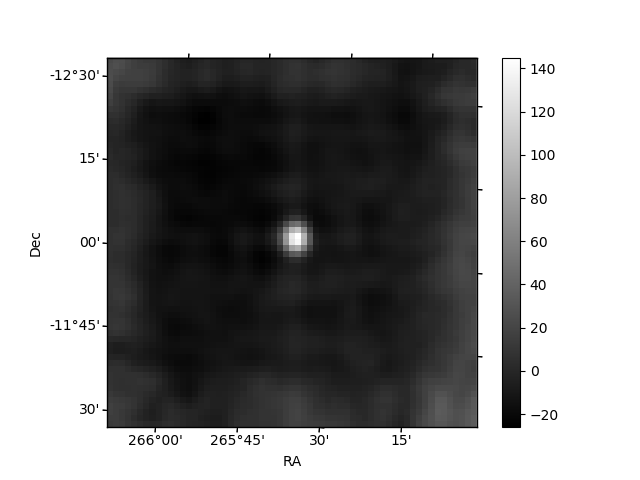 |
| Quadrant-wise count rates Data is divided into 100 sec bins |
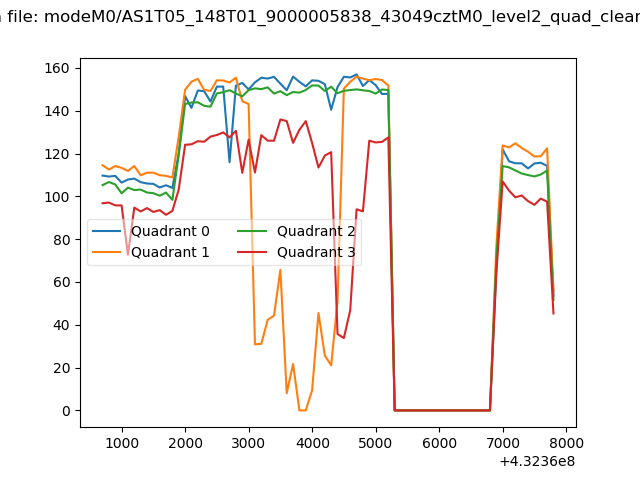 |
|
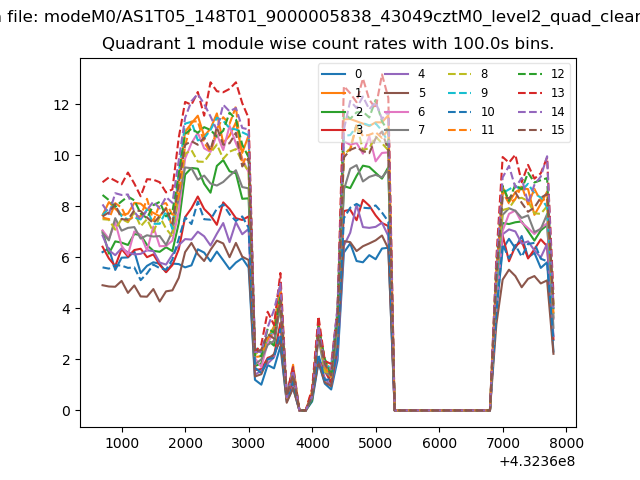
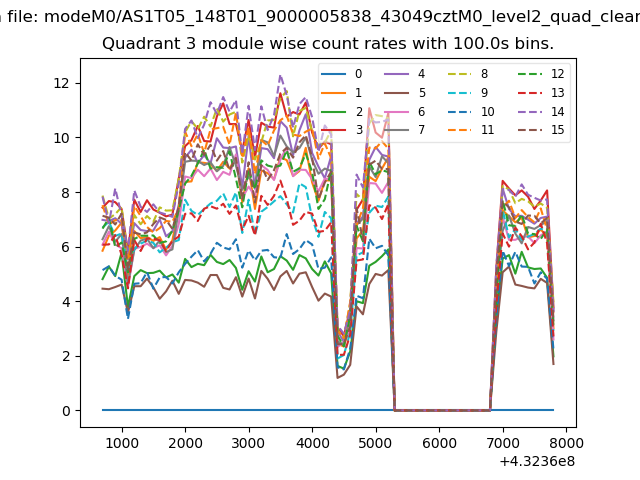
| Module-wise count rates for Quadrant A Data is divided into 100 sec bins |
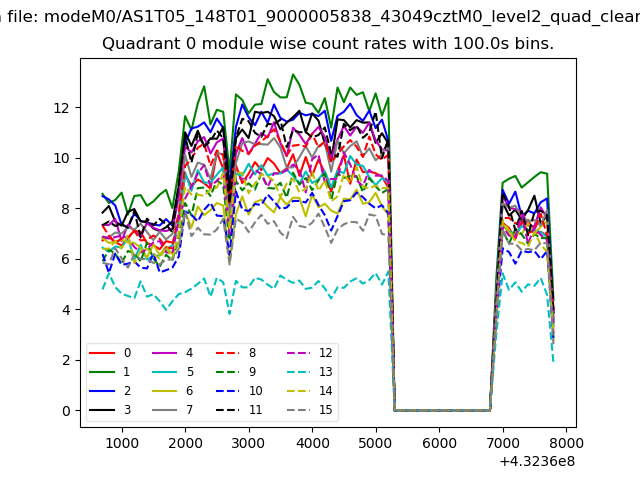 |
 |
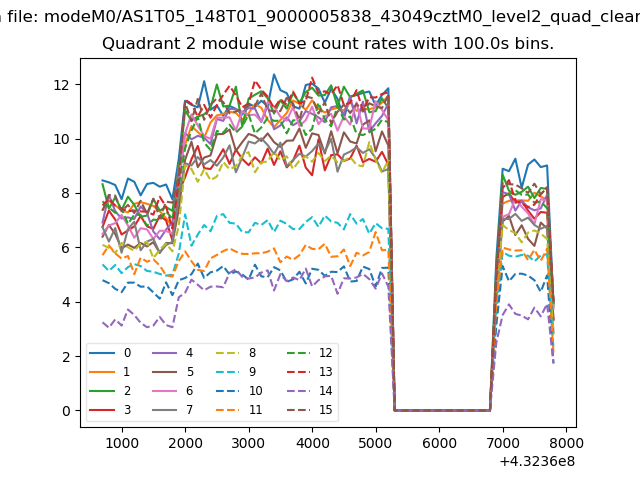
| Module-wise count rates for Quadrant B Data is divided into 100 sec bins |
 |
 |
| Module-wise count rates for Quadrant C Data is divided into 100 sec bins |
 |
 |
| Module-wise count rates for Quadrant D Data is divided into 100 sec bins |
 |
 |
| Parameter | Plot |
|---|---|
| CZT HV Monitor | 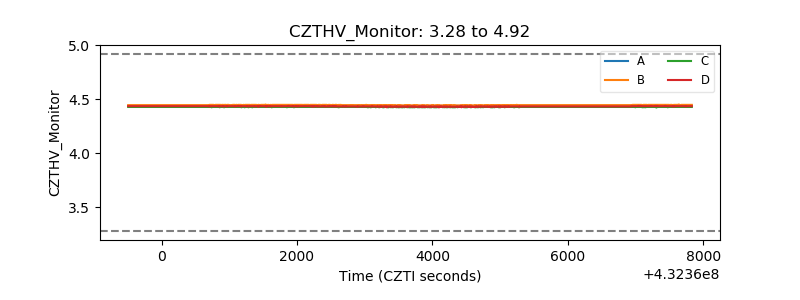 |
| D_VDD | 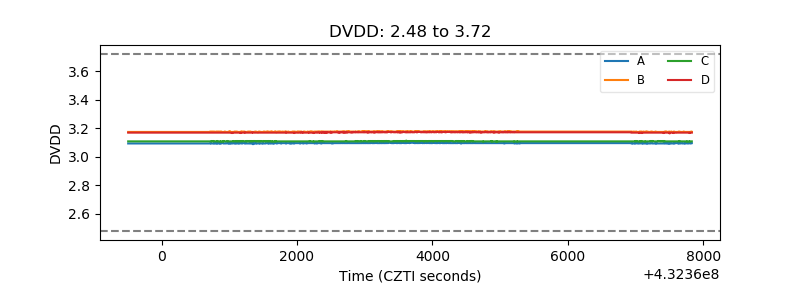 |
| Temperature 1 | 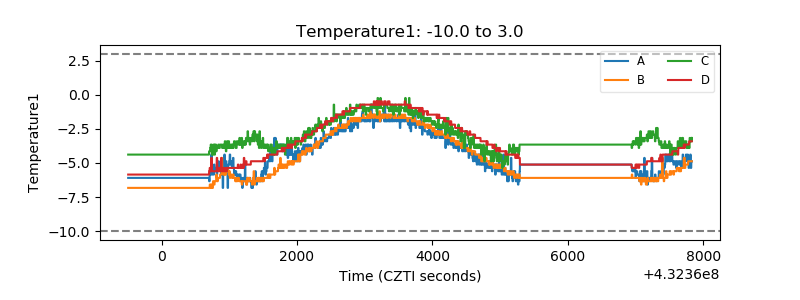 |
| Veto HV Monitor | 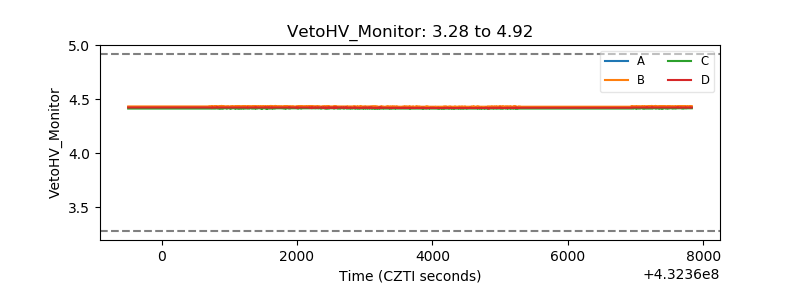 |
| Veto LLD | 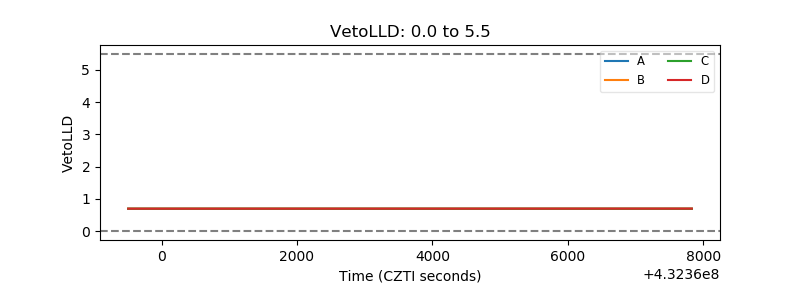 |
| Alpha Counter | 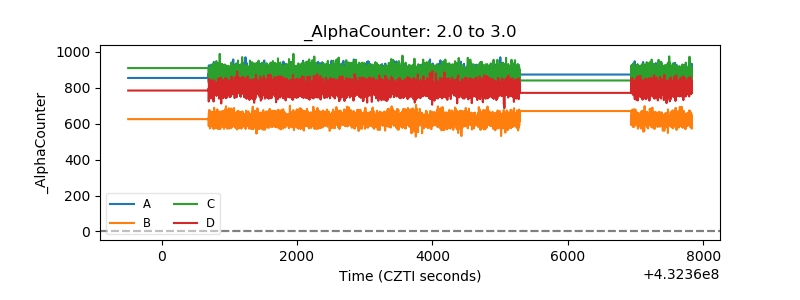 |
| _CPM_Rate |  |
| CZT Counter | 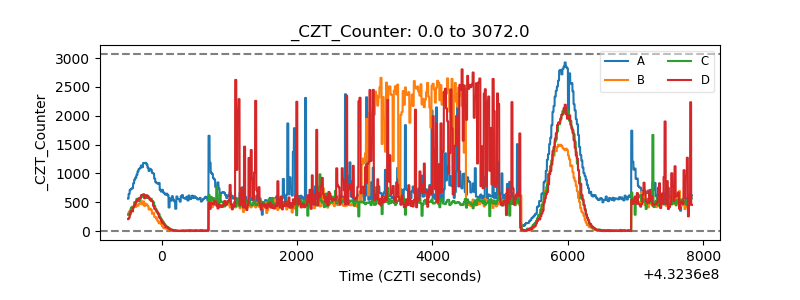 |
| +2.5 Volts monitor |  |
| +5 Volts monitor | 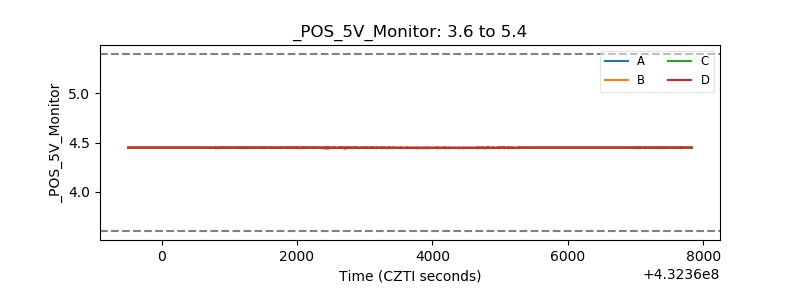 |
| _ROLL_ROT | 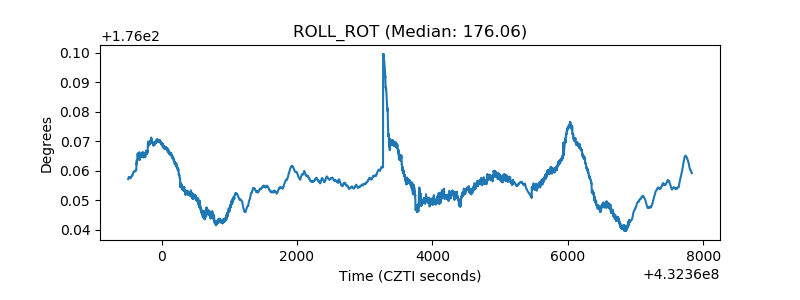 |
| _Roll_DEC | 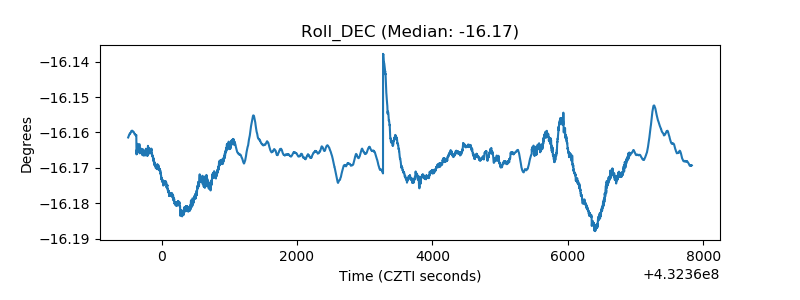 |
| _Roll_RA | 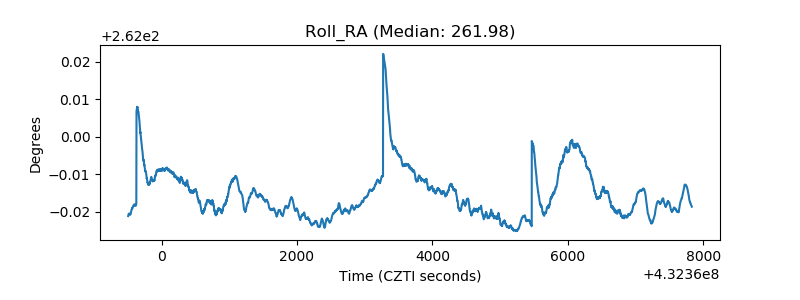 |
| Veto Counter | 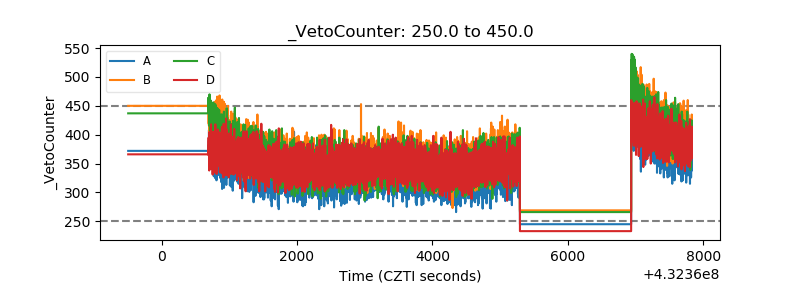 |