| Param | Original file | Final file |
|---|---|---|
| Filename | modeM0/AS1T05_148T01_9000005838_43051cztM0_level2.fits | modeM0/AS1T05_148T01_9000005838_43051cztM0_level2_quad_clean.evt |
| Size (bytes) | 460,535,040 | 107,095,680 |
| Size | 439.2 MB | 102.1 MB |
| Events in quadrant A | 4,003,997 | 788,357 |
| Events in quadrant B | 4,829,650 | 681,042 |
| Events in quadrant C | 2,795,599 | 766,045 |
| Events in quadrant D | 5,002,741 | 633,070 |
| Mode M9 | |||
|---|---|---|---|
| Quadrant | BADHDUFLAG | Total packets | Discarded packets |
| A | 0 | 26 | 0 |
| B | 0 | 27 | 0 |
| C | 0 | 27 | 0 |
| D | 0 | 27 | 0 |
| Mode SS | |||
|---|---|---|---|
| Quadrant | BADHDUFLAG | Total packets | Discarded packets |
| A | 0 | 110 | 0 |
| B | 0 | 110 | 0 |
| C | 0 | 110 | 0 |
| D | 0 | 110 | 0 |
| Mode M0 | |||
|---|---|---|---|
| Quadrant | BADHDUFLAG | Total packets | Discarded packets |
| A | 0 | 15553 | 2 |
| B | 0 | 17512 | 2 |
| C | 0 | 11106 | 2 |
| D | 0 | 18447 | 2 |
| Quadrant | Total seconds | Saturated seconds | Saturation percentage |
|---|---|---|---|
| A | 5349 | 78 | 1.458216% |
| B | 5349 | 872 | 16.302113% |
| C | 5349 | 10 | 0.186951% |
| D | 5349 | 542 | 10.132735% |
Noise dominated data is calculated using 1-second bins in cleaned event files. If a bin has >2000 counts, and if more than 50% of those come from <1% of pixels, then it is considered to be noise-dominated and hence unusable.
| Quadrant | # 1 sec bins | Bins with >0 counts | Bins with >2000 counts | High rate bins dominated by noise | Noise dominated (total time) | Noise dominated (detector-on time) | Marked lightcurve |
|---|---|---|---|---|---|---|---|
| A | 7142 | 5350 | 29 | 29 | 0.41% | 0.54% | 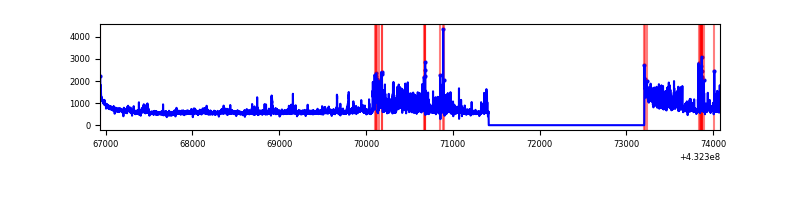 |
| B | 7142 | 5350 | 726 | 726 | 10.17% | 13.57% | 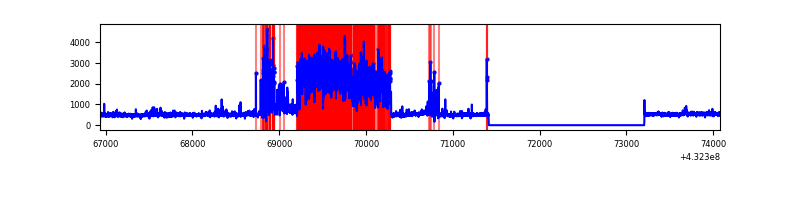 |
| C | 7142 | 5350 | 2 | 2 | 0.03% | 0.04% | 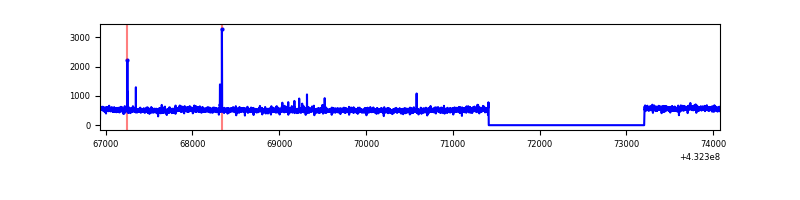 |
| D | 7142 | 5350 | 515 | 515 | 7.21% | 9.63% | 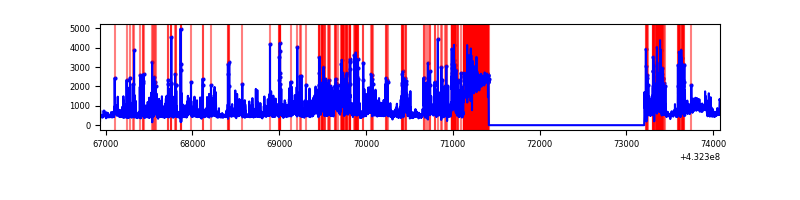 |
Top three noisy pixels from each quadrant. If the there are fewer than three noisy pixels in the level2.evt file, extra rows are filled as -1
| Pixel properties | Quadrant properties | ||||||
|---|---|---|---|---|---|---|---|
| Quadrant | DetID | PixID | Counts | Sigma | Mean | Median | Sigma |
| A | 15 | 222 | 662840 | 4483.96 | 670 | 660 | 147.7 |
| A | 10 | 83 | 595488 | 4027.89 | 670 | 660 | 147.7 |
| A | 15 | 237 | 80886 | 543.25 | 670 | 660 | 147.7 |
| B | 0 | 186 | 1999806 | 15495.43 | 624 | 611 | 129.0 |
| B | 0 | 229 | 278963 | 2157.46 | 624 | 611 | 129.0 |
| B | 4 | 171 | 47526 | 363.63 | 624 | 611 | 129.0 |
| C | 15 | 214 | 239390 | 1470.18 | 648 | 654 | 162.4 |
| C | 12 | 249 | 22087 | 131.99 | 648 | 654 | 162.4 |
| C | 14 | 254 | 4457 | 23.42 | 648 | 654 | 162.4 |
| D | 1 | 52 | 1278059 | 7818.22 | 625 | 607 | 163.4 |
| D | 2 | 16 | 612987 | 3747.87 | 625 | 607 | 163.4 |
| D | 13 | 249 | 360932 | 2205.25 | 625 | 607 | 163.4 |
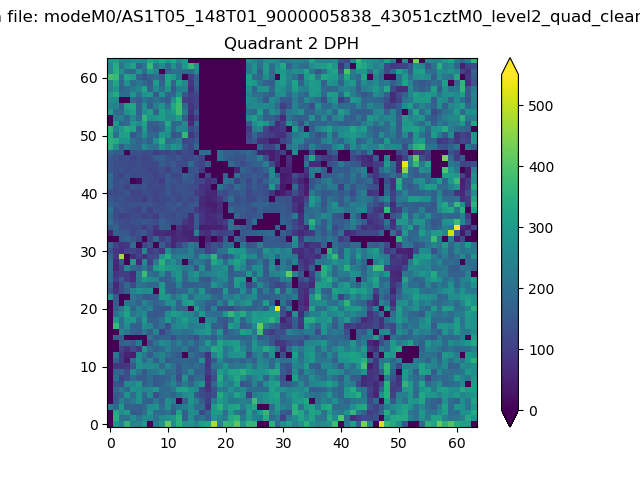
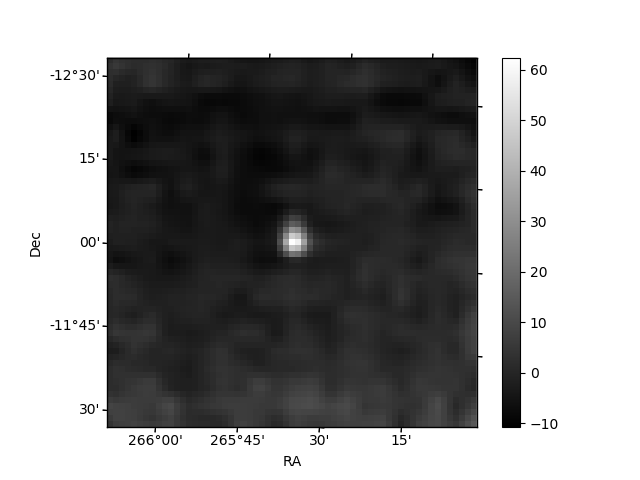
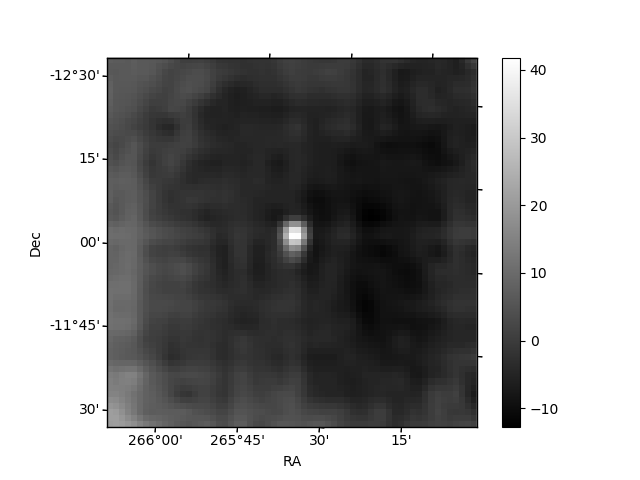
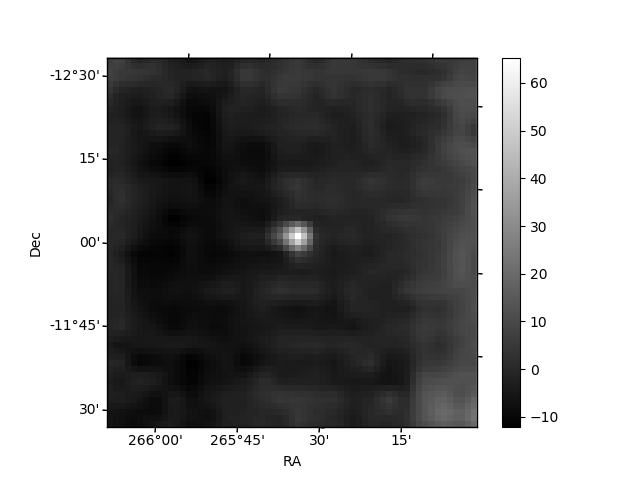
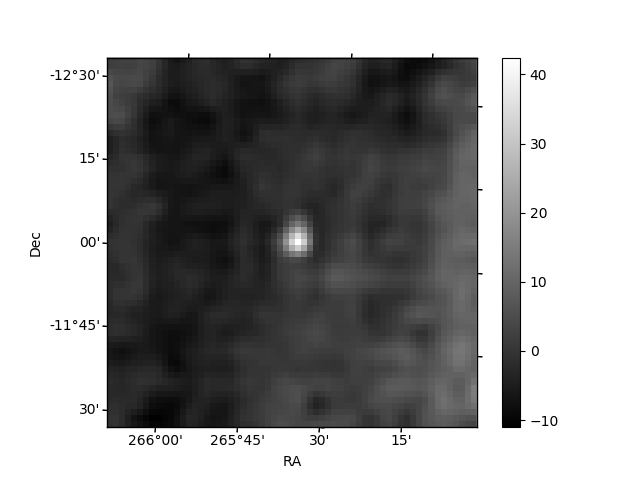
Histogram calculated using DETX and DETY for each event in the final _common_clean file
| Quadrant A | 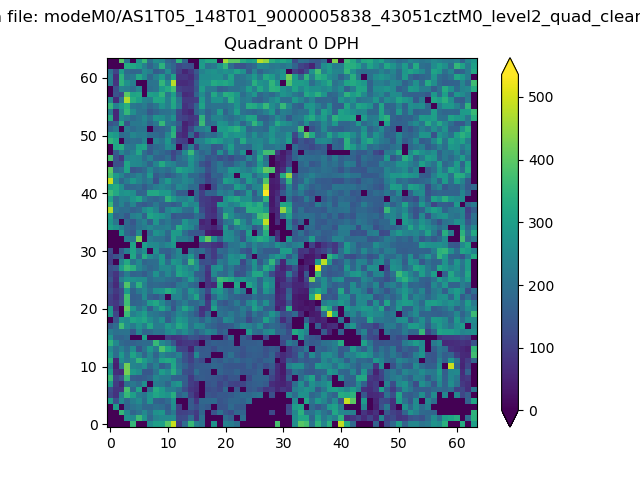 |
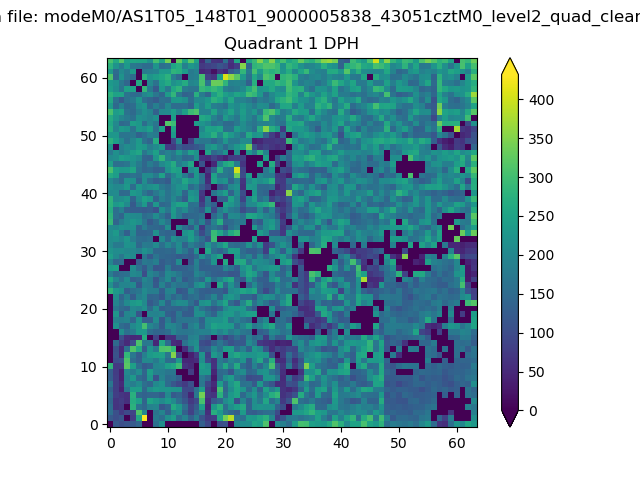 |
Quadrant B |
|---|---|---|---|
| Quadrant D | 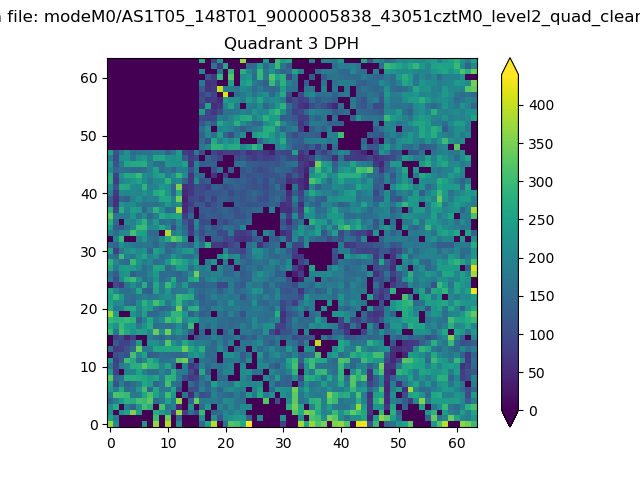 |
 |
Quadrant C |
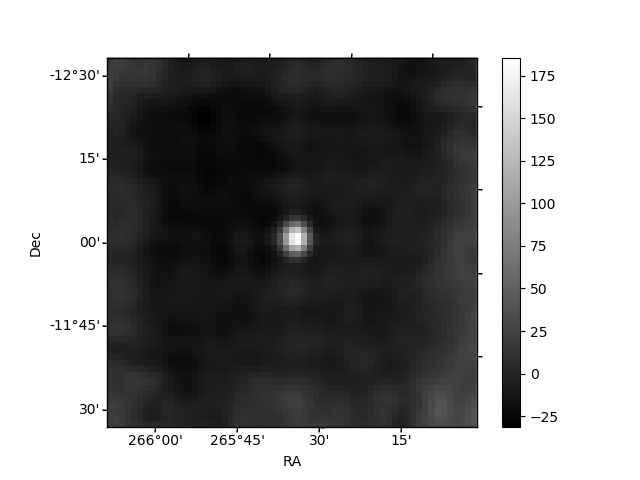
| Plot type | Count rate plots | Images |
|---|---|---|
| Comparison with Poisson distribution Blue bars denote a histogram of data divided into 1 sec bins. Red curve is a Poisson curve with rate = median count rate of data. |
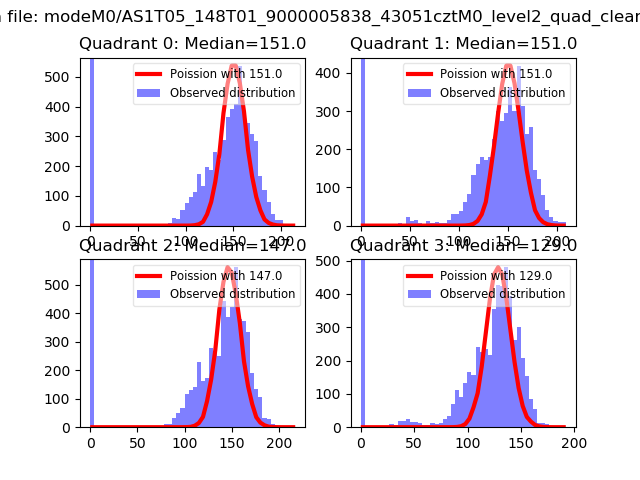 |
 |
| Quadrant-wise count rates Data is divided into 100 sec bins |
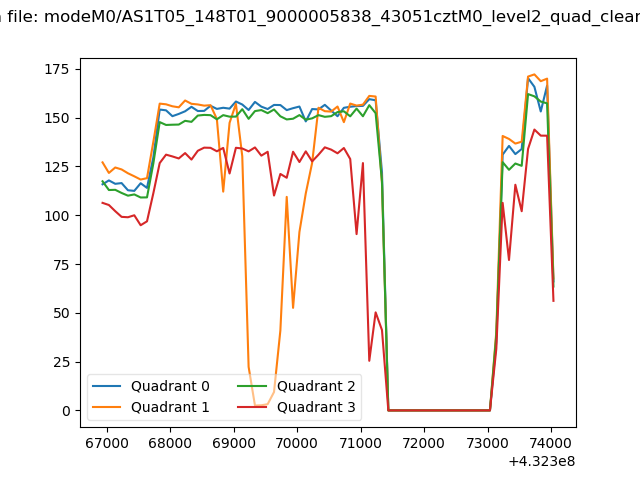 |
|
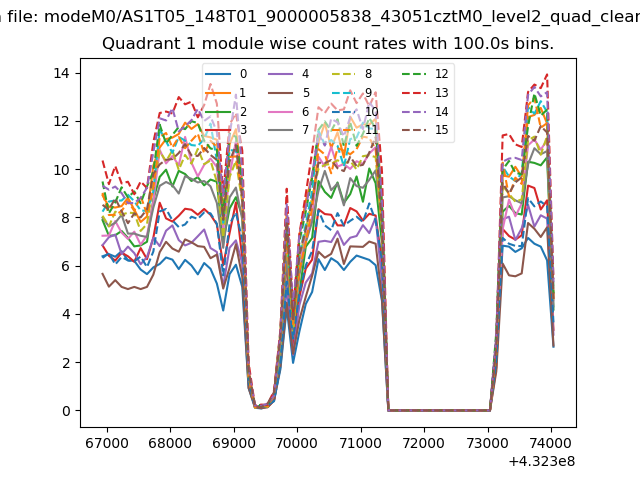
| Module-wise count rates for Quadrant A Data is divided into 100 sec bins |
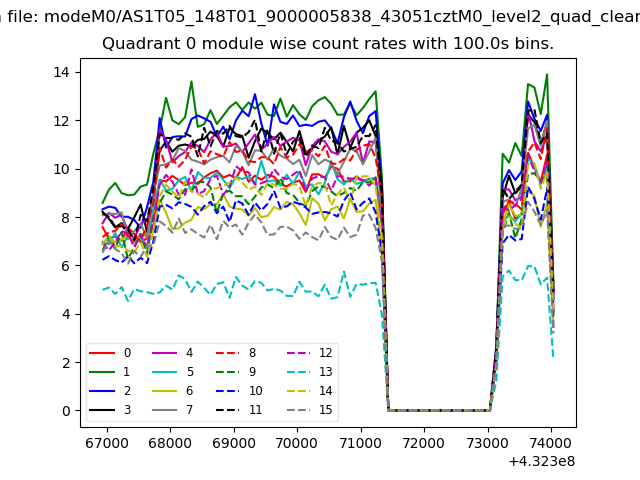 |
 |
| Module-wise count rates for Quadrant B Data is divided into 100 sec bins |
 |
 |
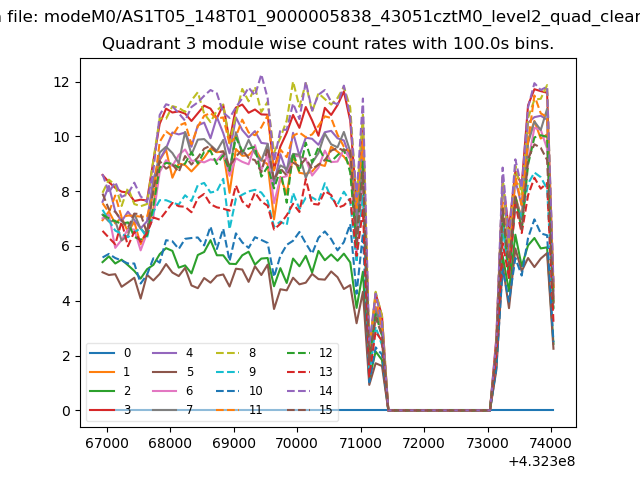
| Module-wise count rates for Quadrant C Data is divided into 100 sec bins |
 |
 |
| Module-wise count rates for Quadrant D Data is divided into 100 sec bins |
 |
 |
| Parameter | Plot |
|---|---|
| CZT HV Monitor |  |
| D_VDD | 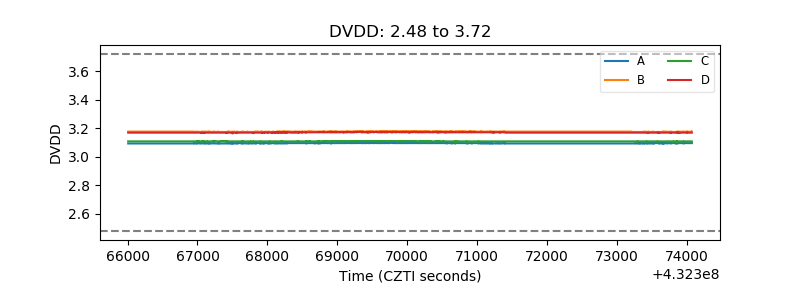 |
| Temperature 1 | 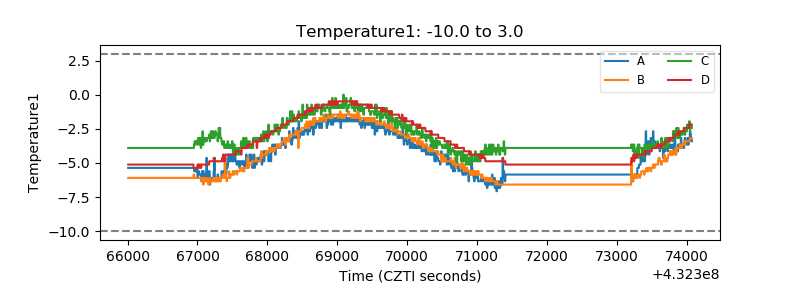 |
| Veto HV Monitor | 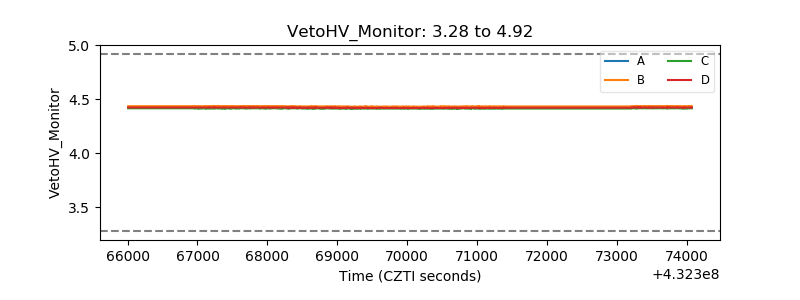 |
| Veto LLD | 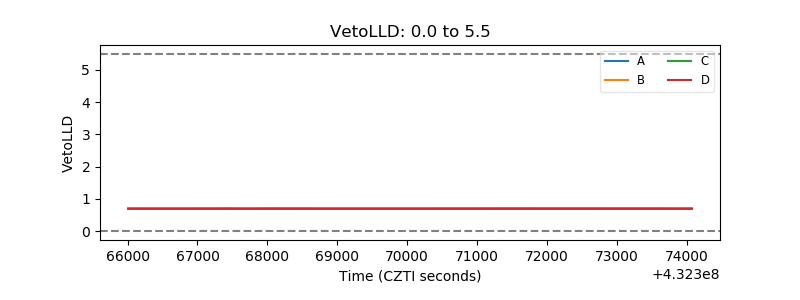 |
| Alpha Counter | 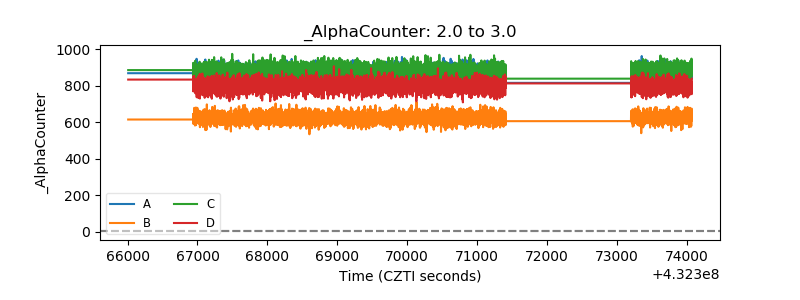 |
| _CPM_Rate |  |
| CZT Counter | 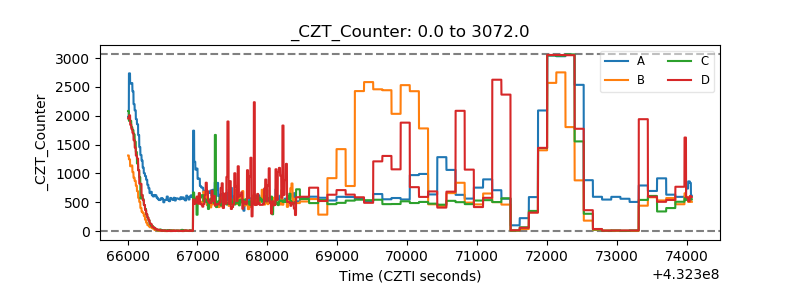 |
| +2.5 Volts monitor |  |
| +5 Volts monitor | 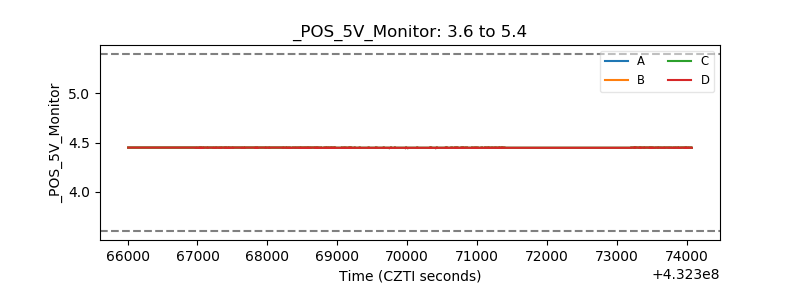 |
| _ROLL_ROT | 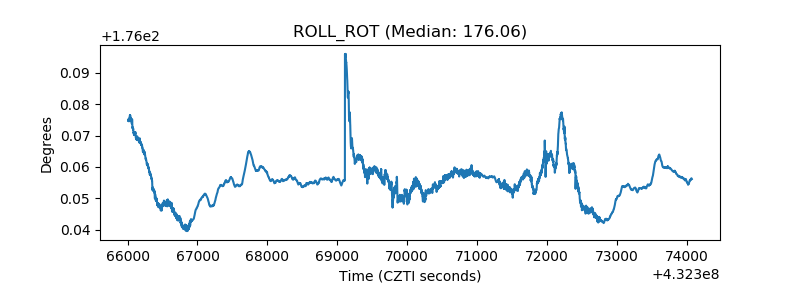 |
| _Roll_DEC | 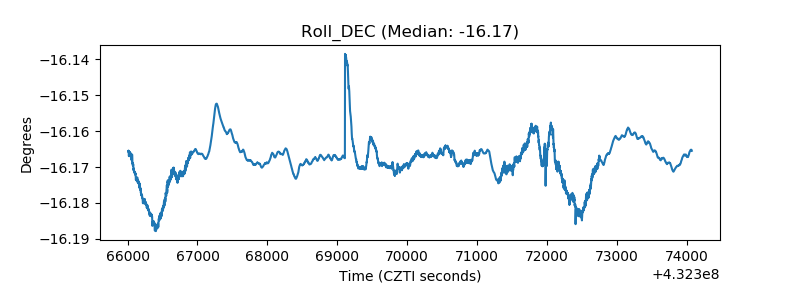 |
| _Roll_RA | 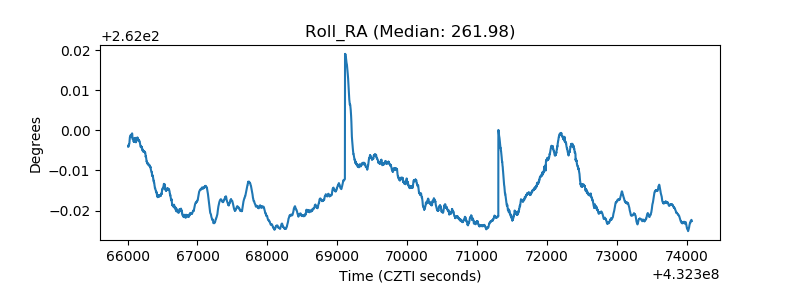 |
| Veto Counter | 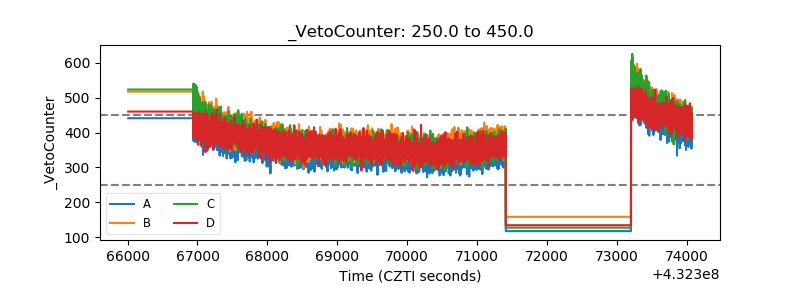 |