| Param | Original file | Final file |
|---|---|---|
| Filename | modeM0/AS1T05_148T01_9000005838_43052cztM0_level2.fits | modeM0/AS1T05_148T01_9000005838_43052cztM0_level2_quad_clean.evt |
| Size (bytes) | 500,500,800 | 107,118,720 |
| Size | 477.3 MB | 102.2 MB |
| Events in quadrant A | 4,416,511 | 799,082 |
| Events in quadrant B | 5,266,167 | 677,586 |
| Events in quadrant C | 2,840,515 | 802,314 |
| Events in quadrant D | 5,600,961 | 601,057 |
| Mode M9 | |||
|---|---|---|---|
| Quadrant | BADHDUFLAG | Total packets | Discarded packets |
| A | 0 | 27 | 0 |
| B | 0 | 28 | 0 |
| C | 0 | 28 | 0 |
| D | 0 | 28 | 0 |
| Mode SS | |||
|---|---|---|---|
| Quadrant | BADHDUFLAG | Total packets | Discarded packets |
| A | 0 | 108 | 0 |
| B | 0 | 108 | 0 |
| C | 0 | 108 | 0 |
| D | 0 | 108 | 0 |
| Mode M0 | |||
|---|---|---|---|
| Quadrant | BADHDUFLAG | Total packets | Discarded packets |
| A | 0 | 17050 | 9 |
| B | 0 | 18807 | 2 |
| C | 0 | 11383 | 2 |
| D | 0 | 20017 | 2 |
| Quadrant | Total seconds | Saturated seconds | Saturation percentage |
|---|---|---|---|
| A | 5188 | 285 | 5.493446% |
| B | 5188 | 1147 | 22.108712% |
| C | 5188 | 7 | 0.134927% |
| D | 5188 | 1000 | 19.275251% |
Noise dominated data is calculated using 1-second bins in cleaned event files. If a bin has >2000 counts, and if more than 50% of those come from <1% of pixels, then it is considered to be noise-dominated and hence unusable.
| Quadrant | # 1 sec bins | Bins with >0 counts | Bins with >2000 counts | High rate bins dominated by noise | Noise dominated (total time) | Noise dominated (detector-on time) | Marked lightcurve |
|---|---|---|---|---|---|---|---|
| A | 7101 | 5189 | 179 | 179 | 2.52% | 3.45% | 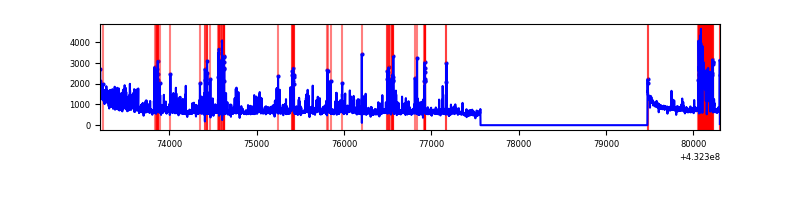 |
| B | 7101 | 5189 | 943 | 943 | 13.28% | 18.17% | 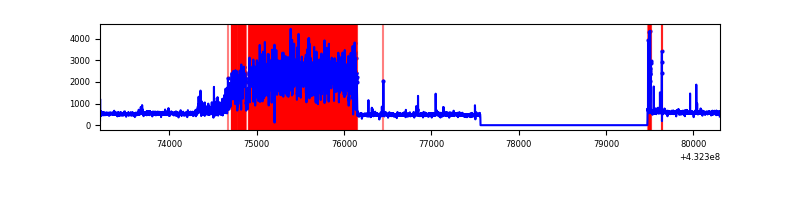 |
| C | 7101 | 5189 | 0 | 0 | 0.00% | 0.00% | 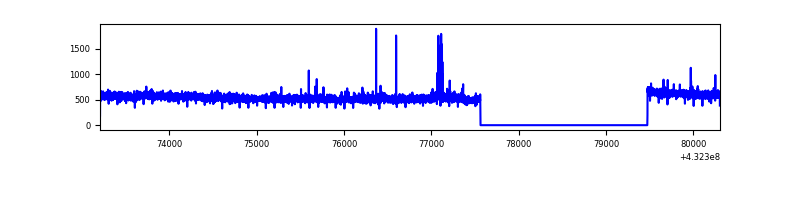 |
| D | 7101 | 5189 | 923 | 923 | 13.00% | 17.79% | 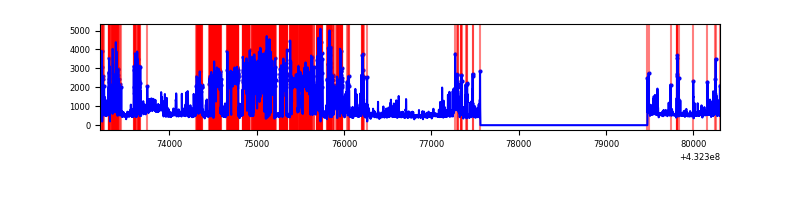 |
Top three noisy pixels from each quadrant. If the there are fewer than three noisy pixels in the level2.evt file, extra rows are filled as -1
| Pixel properties | Quadrant properties | ||||||
|---|---|---|---|---|---|---|---|
| Quadrant | DetID | PixID | Counts | Sigma | Mean | Median | Sigma |
| A | 15 | 222 | 675371 | 4583.77 | 660 | 650 | 147.2 |
| A | 10 | 83 | 579993 | 3935.81 | 660 | 650 | 147.2 |
| A | 15 | 237 | 531772 | 3608.22 | 660 | 650 | 147.2 |
| B | 0 | 186 | 2427802 | 18137.91 | 628 | 617 | 133.8 |
| B | 4 | 171 | 272611 | 2032.56 | 628 | 617 | 133.8 |
| B | 0 | 229 | 76006 | 563.37 | 628 | 617 | 133.8 |
| C | 15 | 214 | 232968 | 1401.49 | 656 | 662 | 165.8 |
| C | 14 | 254 | 46181 | 274.61 | 656 | 662 | 165.8 |
| C | 13 | 61 | 4434 | 22.76 | 656 | 662 | 165.8 |
| D | 2 | 16 | 1601178 | 9954.1 | 608 | 590 | 160.8 |
| D | 1 | 52 | 1043428 | 6485.44 | 608 | 590 | 160.8 |
| D | 13 | 249 | 291638 | 1810.04 | 608 | 590 | 160.8 |
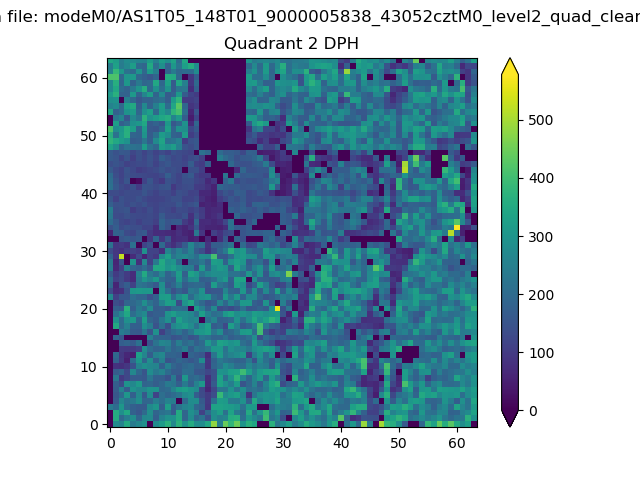
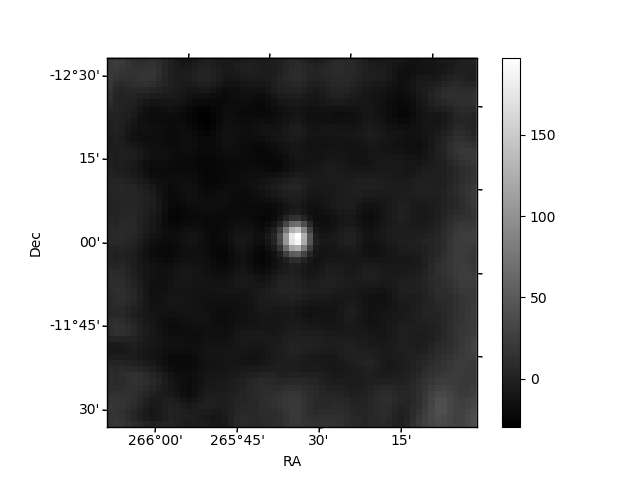
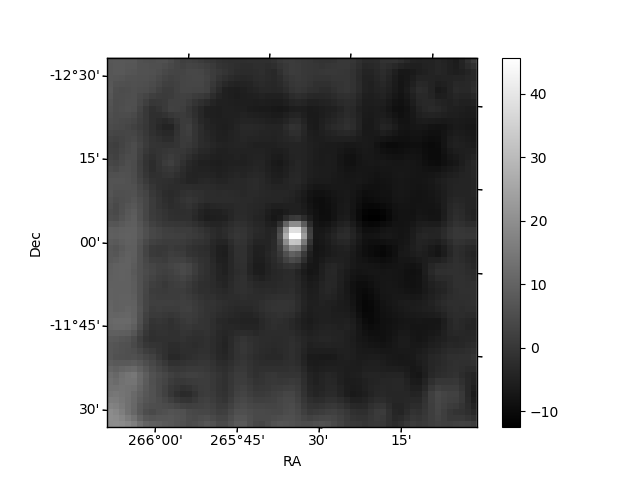
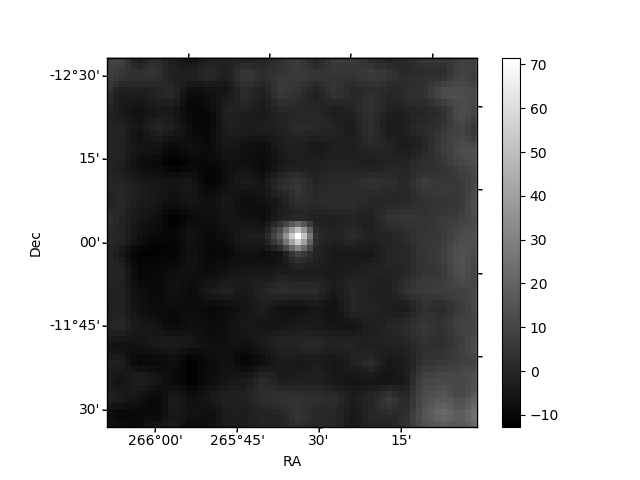
Histogram calculated using DETX and DETY for each event in the final _common_clean file
| Quadrant A | 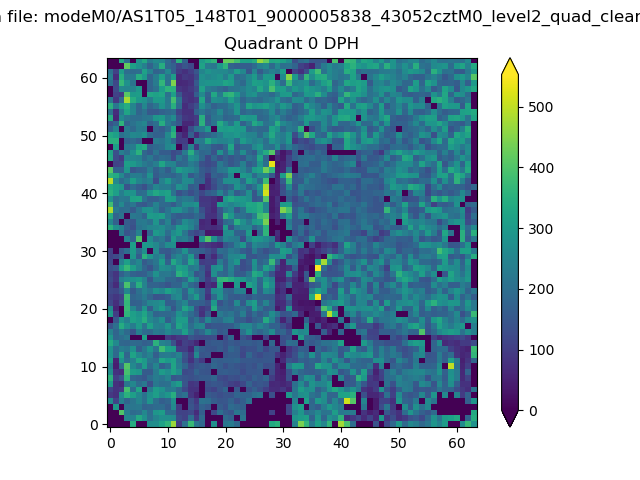 |
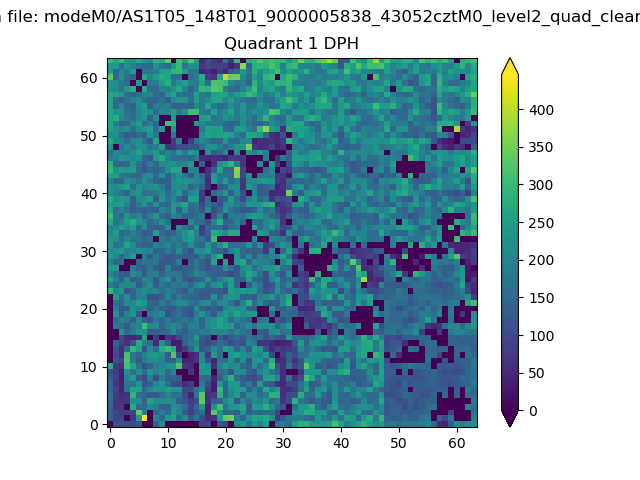 |
Quadrant B |
|---|---|---|---|
| Quadrant D | 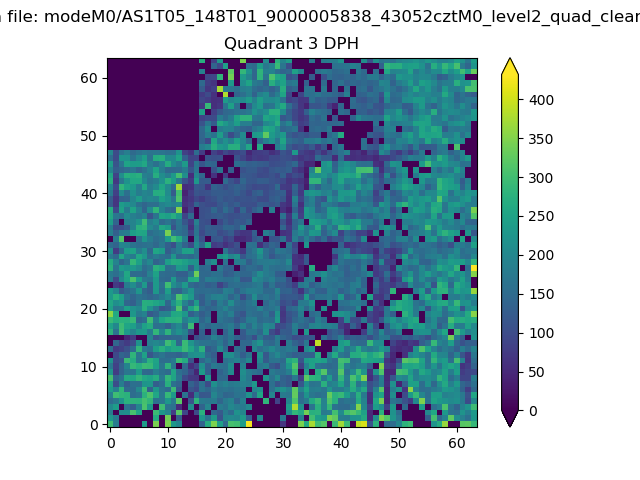 |
 |
Quadrant C |
| Plot type | Count rate plots | Images |
|---|---|---|
| Comparison with Poisson distribution Blue bars denote a histogram of data divided into 1 sec bins. Red curve is a Poisson curve with rate = median count rate of data. |
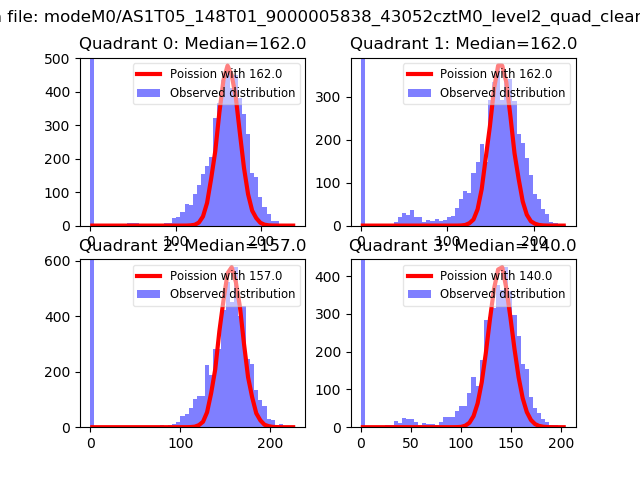 |
 |
| Quadrant-wise count rates Data is divided into 100 sec bins |
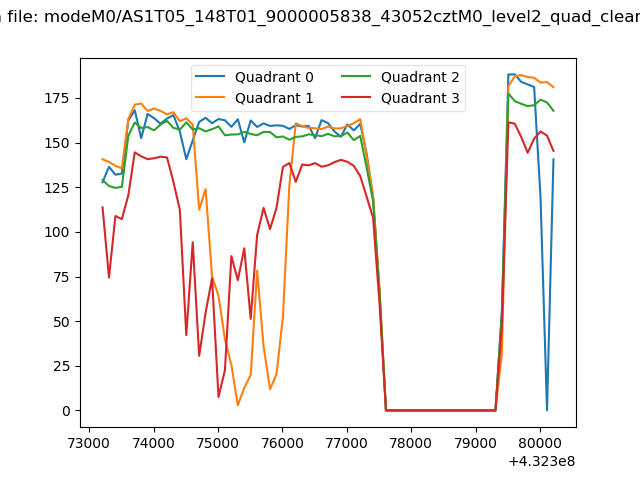 |
|
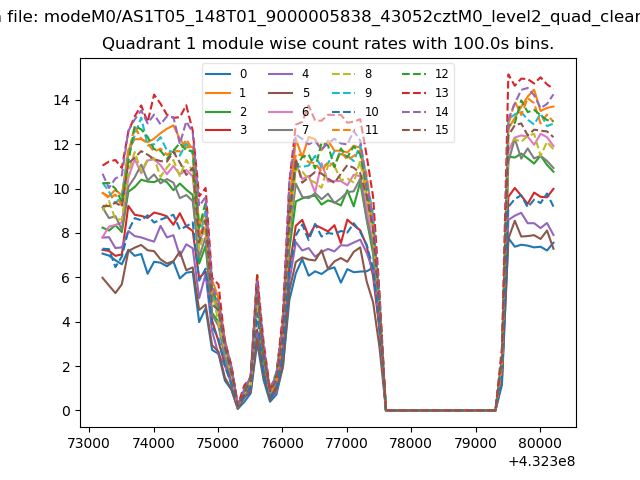
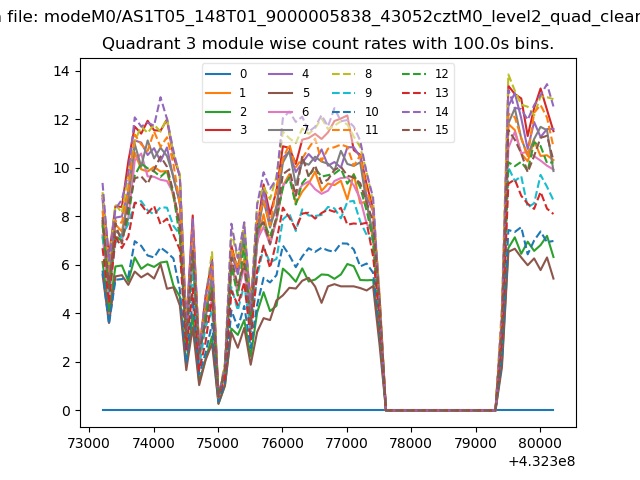
| Module-wise count rates for Quadrant A Data is divided into 100 sec bins |
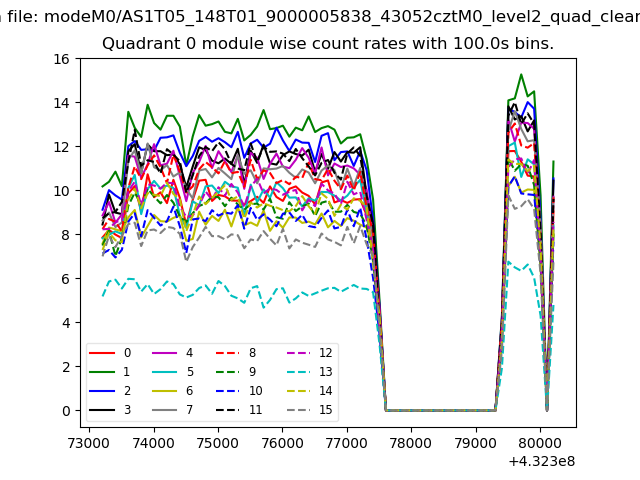 |
 |
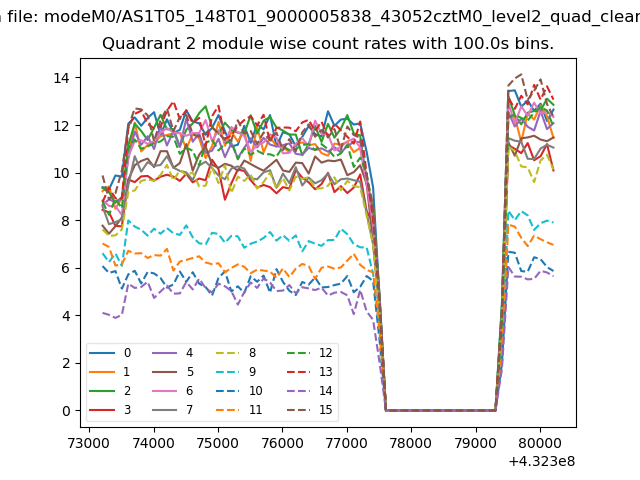
| Module-wise count rates for Quadrant B Data is divided into 100 sec bins |
 |
 |
| Module-wise count rates for Quadrant C Data is divided into 100 sec bins |
 |
 |
| Module-wise count rates for Quadrant D Data is divided into 100 sec bins |
 |
 |
| Parameter | Plot |
|---|---|
| CZT HV Monitor | 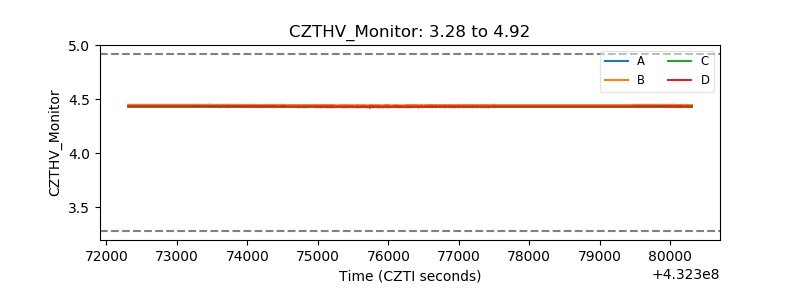 |
| D_VDD | 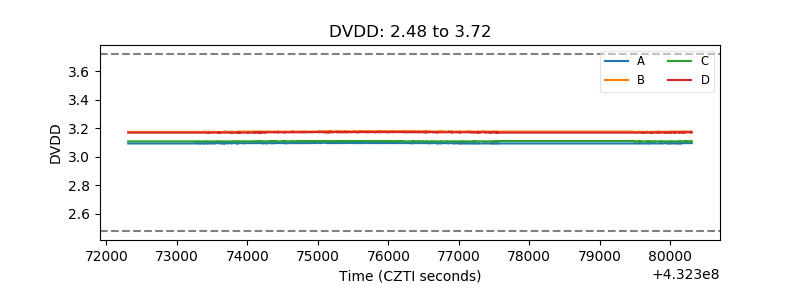 |
| Temperature 1 | 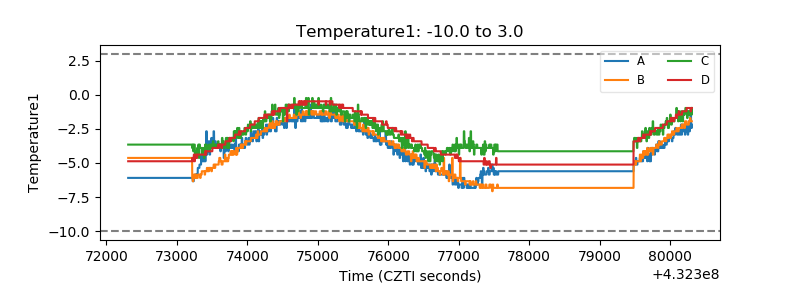 |
| Veto HV Monitor | 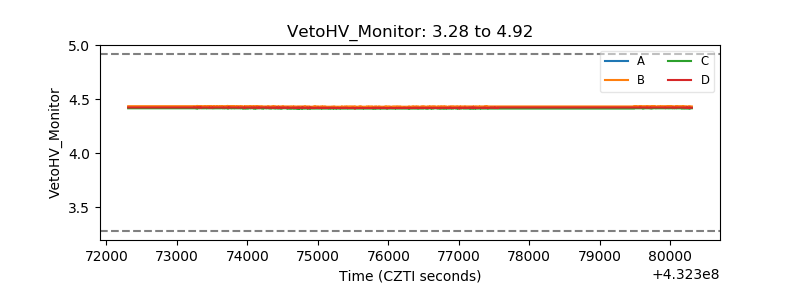 |
| Veto LLD | 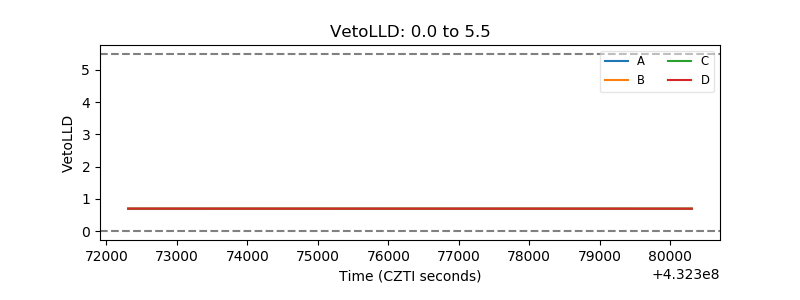 |
| Alpha Counter | 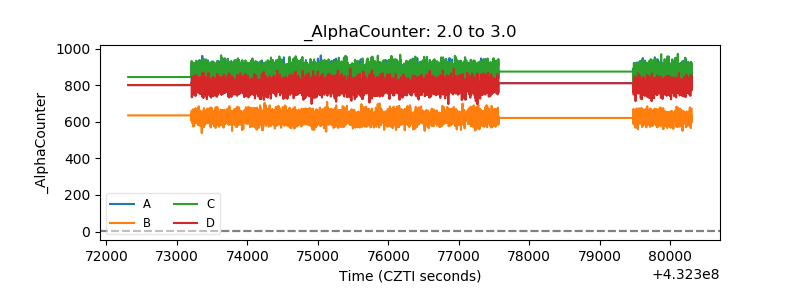 |
| _CPM_Rate | 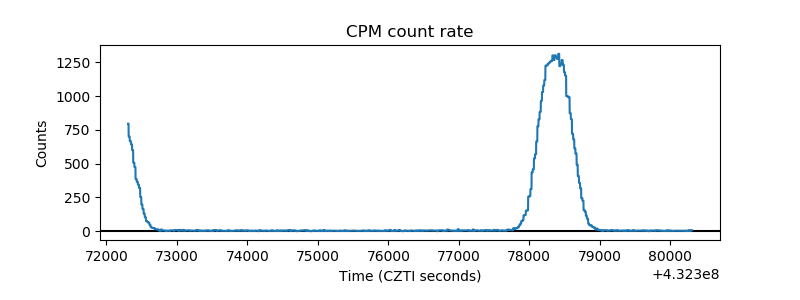 |
| CZT Counter | 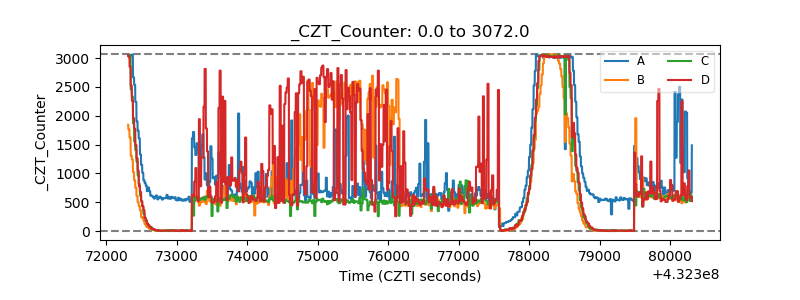 |
| +2.5 Volts monitor |  |
| +5 Volts monitor |  |
| _ROLL_ROT | 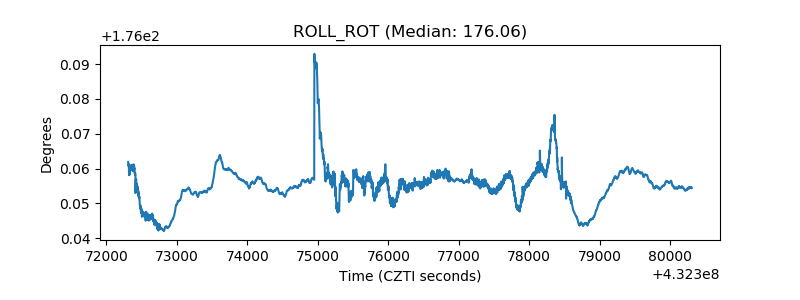 |
| _Roll_DEC | 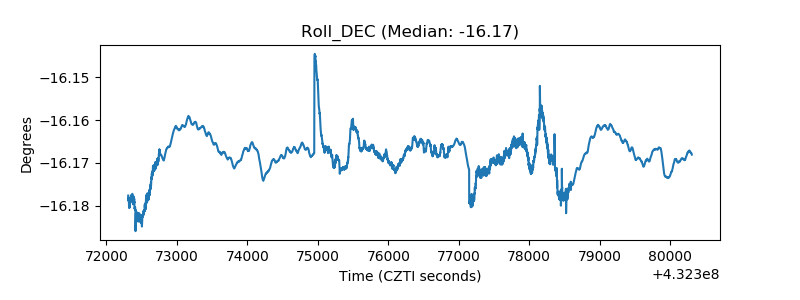 |
| _Roll_RA | 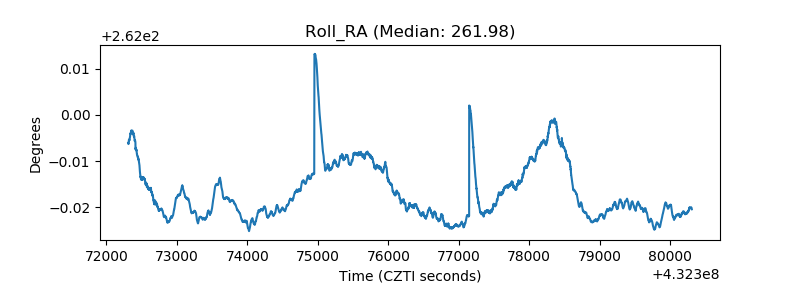 |
| Veto Counter | 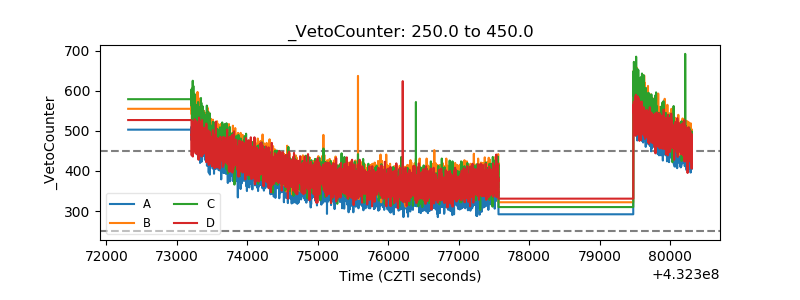 |