| Param | Original file | Final file |
|---|---|---|
| Filename | modeM0/AS1T05_148T01_9000005838_43053cztM0_level2.fits | modeM0/AS1T05_148T01_9000005838_43053cztM0_level2_quad_clean.evt |
| Size (bytes) | 538,629,120 | 102,309,120 |
| Size | 513.7 MB | 97.6 MB |
| Events in quadrant A | 3,743,298 | 812,019 |
| Events in quadrant B | 6,238,833 | 576,485 |
| Events in quadrant C | 2,787,098 | 807,314 |
| Events in quadrant D | 6,776,270 | 548,127 |
| Mode M9 | |||
|---|---|---|---|
| Quadrant | BADHDUFLAG | Total packets | Discarded packets |
| A | 0 | 30 | 0 |
| B | 0 | 31 | 0 |
| C | 0 | 31 | 0 |
| D | 0 | 31 | 0 |
| Mode SS | |||
|---|---|---|---|
| Quadrant | BADHDUFLAG | Total packets | Discarded packets |
| A | 0 | 104 | 0 |
| B | 0 | 104 | 0 |
| C | 0 | 104 | 0 |
| D | 0 | 104 | 0 |
| Mode M0 | |||
|---|---|---|---|
| Quadrant | BADHDUFLAG | Total packets | Discarded packets |
| A | 0 | 14602 | 2 |
| B | 0 | 21866 | 2 |
| C | 0 | 11364 | 2 |
| D | 0 | 23554 | 4 |
| Quadrant | Total seconds | Saturated seconds | Saturation percentage |
|---|---|---|---|
| A | 5054 | 211 | 4.174911% |
| B | 5054 | 1689 | 33.419074% |
| C | 5054 | 5 | 0.098932% |
| D | 5053 | 1508 | 29.843657% |
Noise dominated data is calculated using 1-second bins in cleaned event files. If a bin has >2000 counts, and if more than 50% of those come from <1% of pixels, then it is considered to be noise-dominated and hence unusable.
| Quadrant | # 1 sec bins | Bins with >0 counts | Bins with >2000 counts | High rate bins dominated by noise | Noise dominated (total time) | Noise dominated (detector-on time) | Marked lightcurve |
|---|---|---|---|---|---|---|---|
| A | 7087 | 5055 | 128 | 128 | 1.81% | 2.53% | 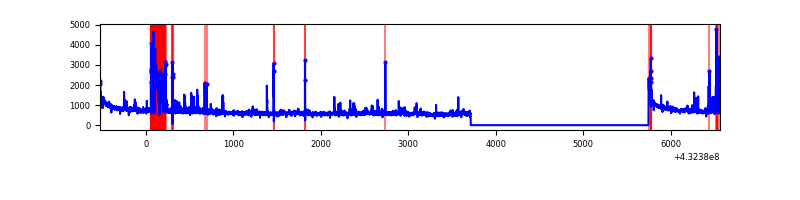 |
| B | 7087 | 5055 | 1358 | 1358 | 19.16% | 26.86% | 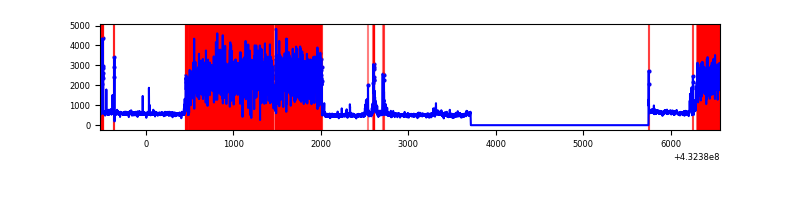 |
| C | 7087 | 5055 | 1 | 1 | 0.01% | 0.02% | 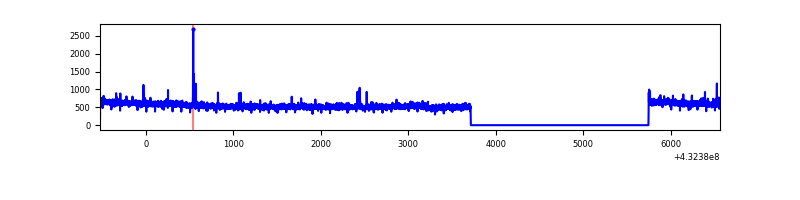 |
| D | 7086 | 5054 | 1517 | 1517 | 21.41% | 30.02% | 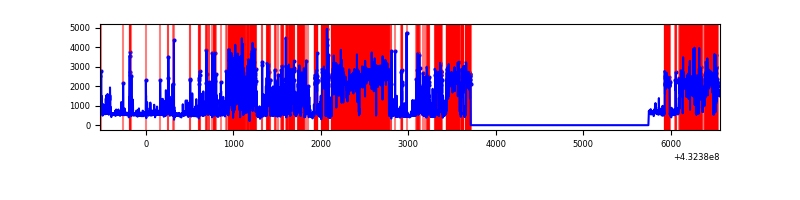 |
Top three noisy pixels from each quadrant. If the there are fewer than three noisy pixels in the level2.evt file, extra rows are filled as -1
| Pixel properties | Quadrant properties | ||||||
|---|---|---|---|---|---|---|---|
| Quadrant | DetID | PixID | Counts | Sigma | Mean | Median | Sigma |
| A | 10 | 83 | 564686 | 3859.35 | 659 | 649 | 146.1 |
| A | 15 | 237 | 462784 | 3162.1 | 659 | 649 | 146.1 |
| A | 12 | 189 | 87838 | 596.58 | 659 | 649 | 146.1 |
| B | 0 | 186 | 3281801 | 27185.02 | 574 | 563 | 120.7 |
| B | 0 | 229 | 365863 | 3026.51 | 574 | 563 | 120.7 |
| B | 4 | 171 | 237912 | 1966.43 | 574 | 563 | 120.7 |
| C | 15 | 214 | 221729 | 1343.66 | 648 | 654 | 164.5 |
| C | 14 | 254 | 26288 | 155.8 | 648 | 654 | 164.5 |
| C | 7 | 220 | 6740 | 36.99 | 648 | 654 | 164.5 |
| D | 2 | 16 | 2658393 | 16675.72 | 596 | 576 | 159.4 |
| D | 1 | 52 | 1101101 | 6904.93 | 596 | 576 | 159.4 |
| D | 13 | 249 | 622071 | 3899.39 | 596 | 576 | 159.4 |
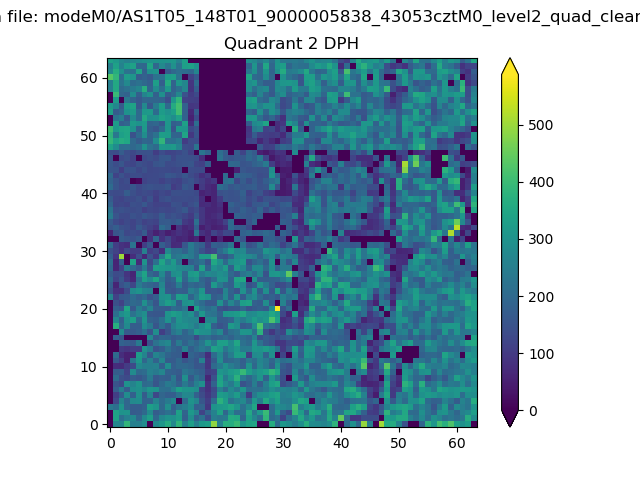
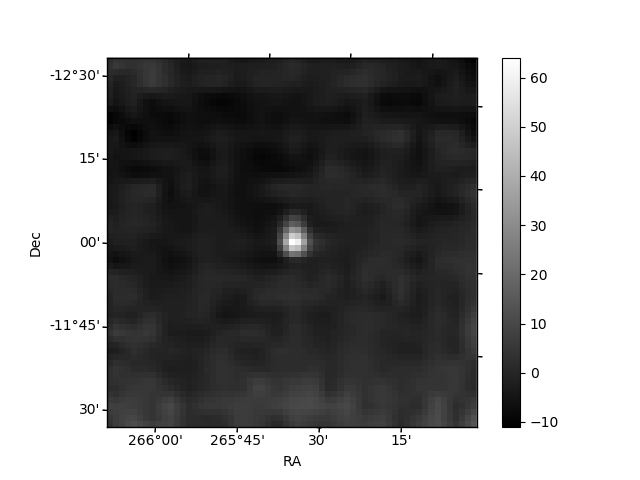
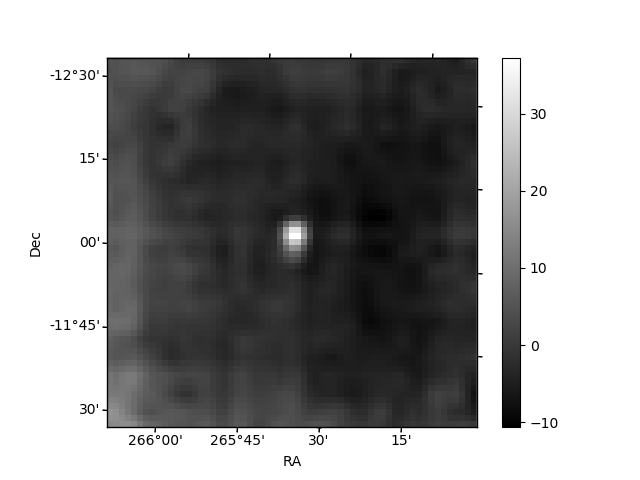
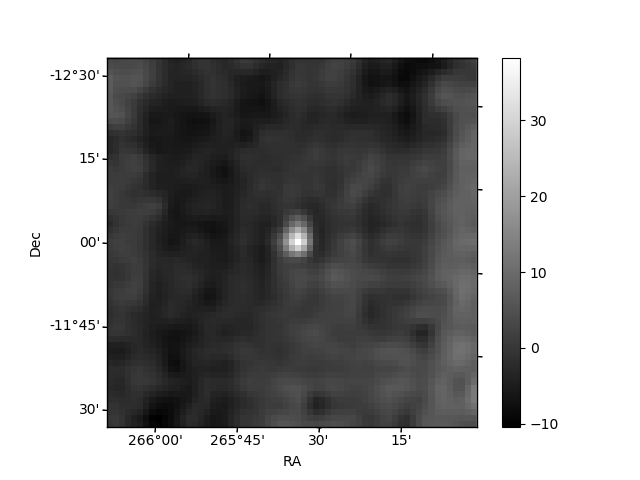
Histogram calculated using DETX and DETY for each event in the final _common_clean file
| Quadrant A | 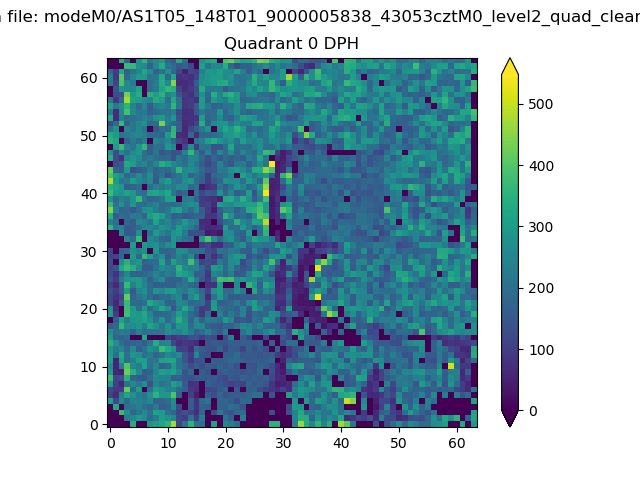 |
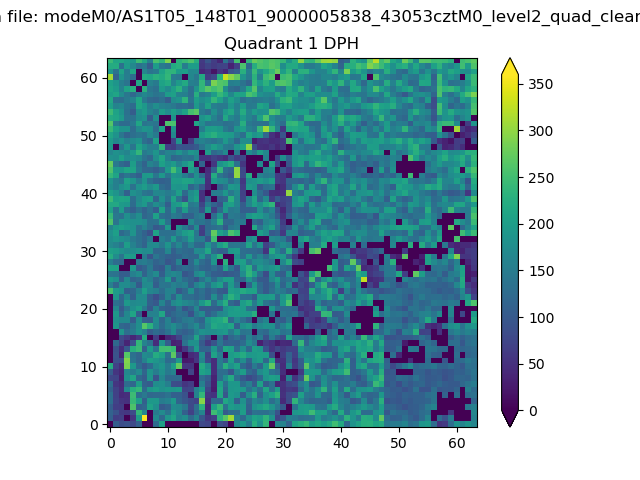 |
Quadrant B |
|---|---|---|---|
| Quadrant D | 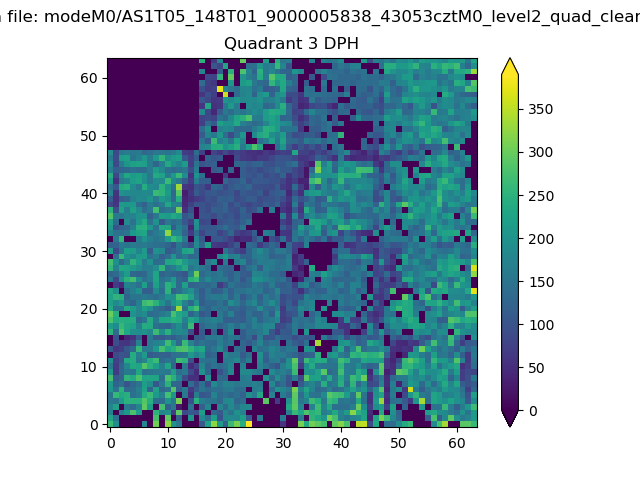 |
 |
Quadrant C |
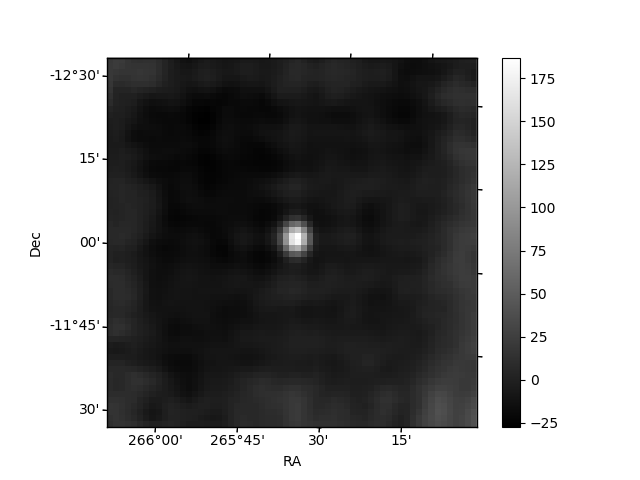
| Plot type | Count rate plots | Images |
|---|---|---|
| Comparison with Poisson distribution Blue bars denote a histogram of data divided into 1 sec bins. Red curve is a Poisson curve with rate = median count rate of data. |
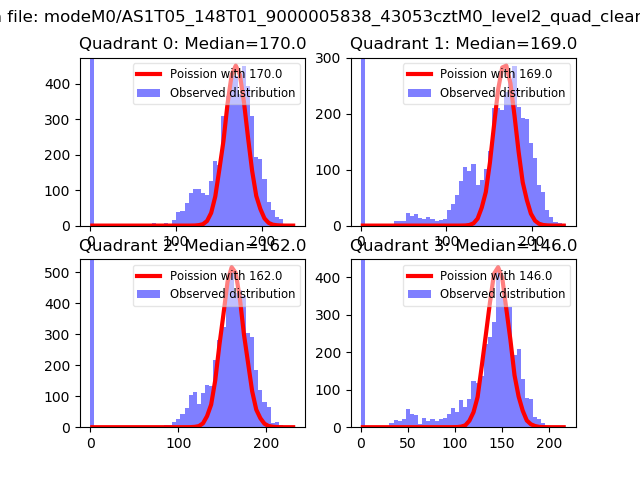 |
 |
| Quadrant-wise count rates Data is divided into 100 sec bins |
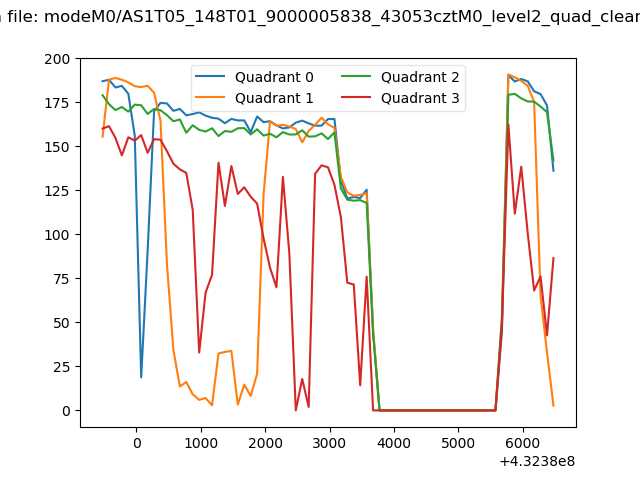 |
|
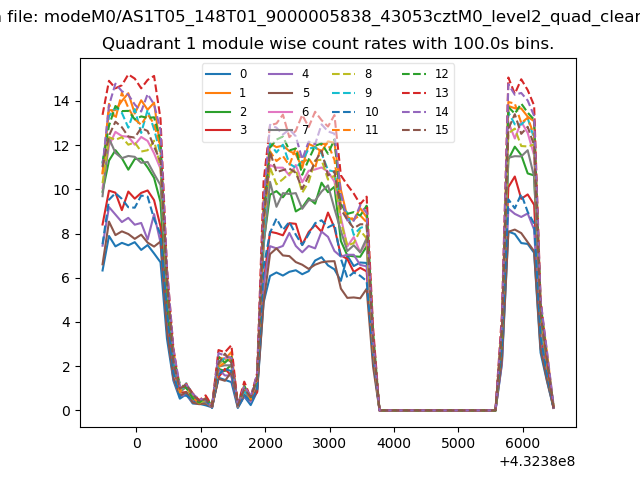
| Module-wise count rates for Quadrant A Data is divided into 100 sec bins |
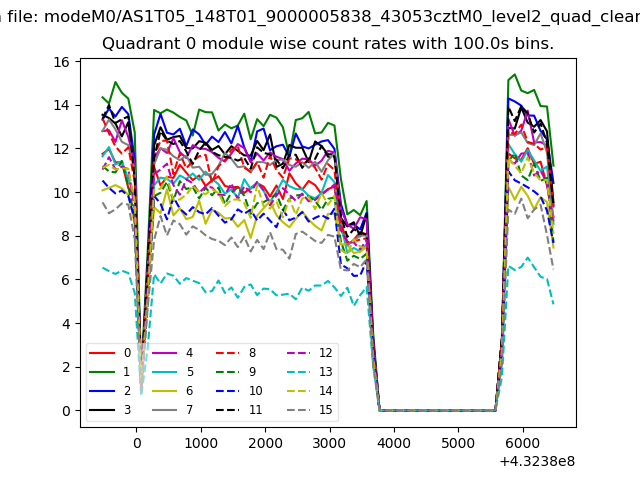 |
 |
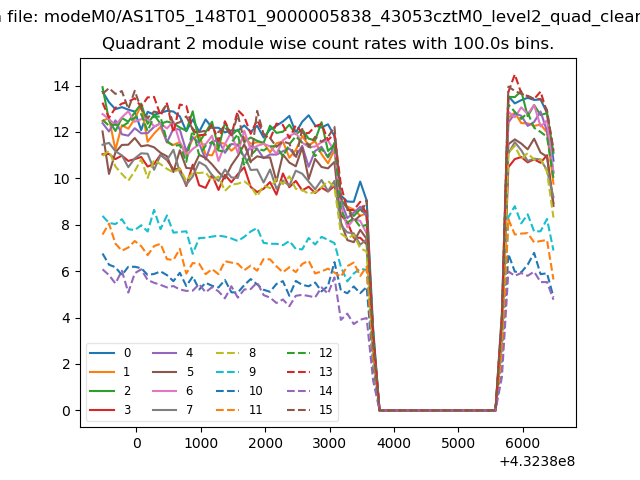
| Module-wise count rates for Quadrant B Data is divided into 100 sec bins |
 |
 |
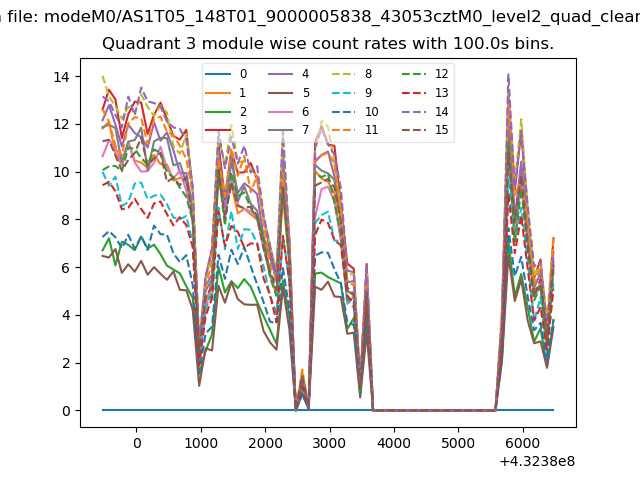
| Module-wise count rates for Quadrant C Data is divided into 100 sec bins |
 |
 |
| Module-wise count rates for Quadrant D Data is divided into 100 sec bins |
 |
 |
| Parameter | Plot |
|---|---|
| CZT HV Monitor | 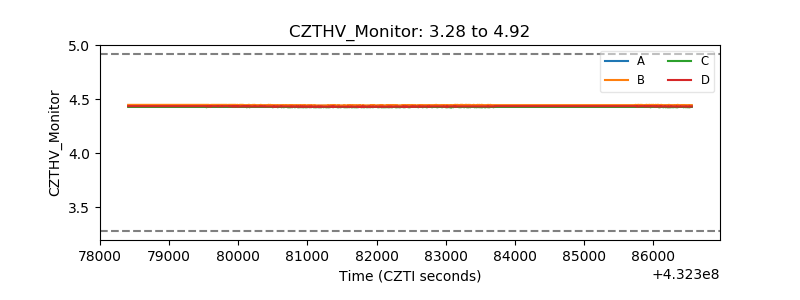 |
| D_VDD | 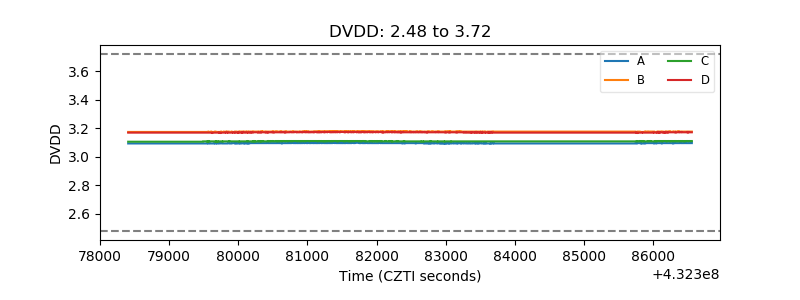 |
| Temperature 1 | 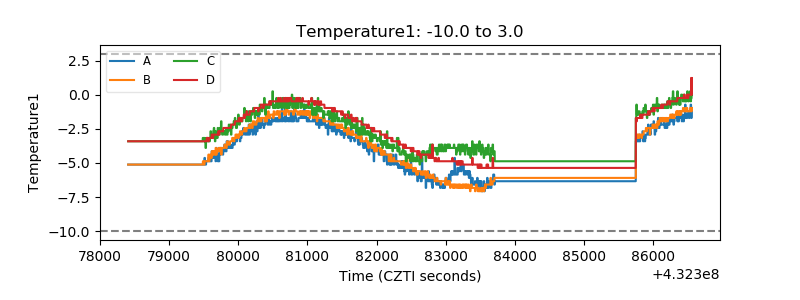 |
| Veto HV Monitor | 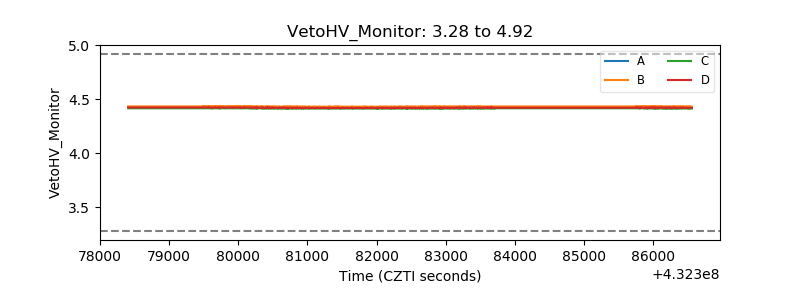 |
| Veto LLD | 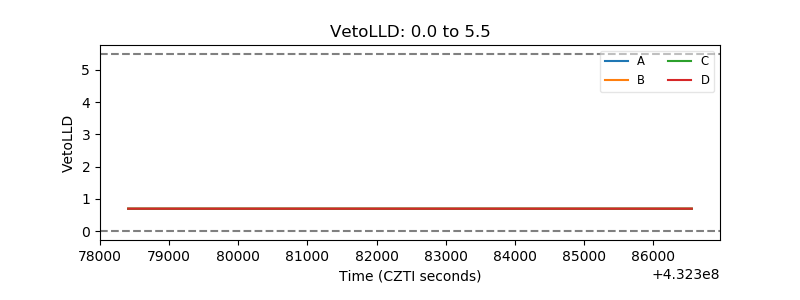 |
| Alpha Counter | 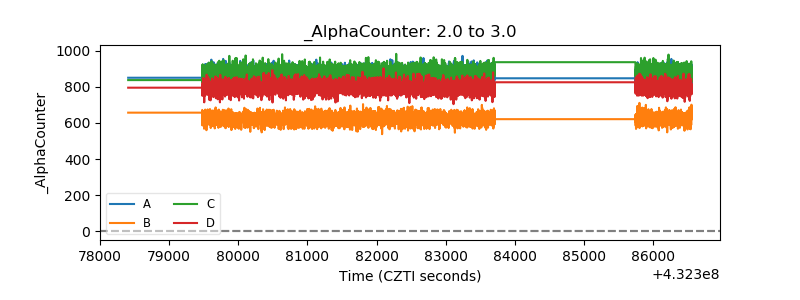 |
| _CPM_Rate | 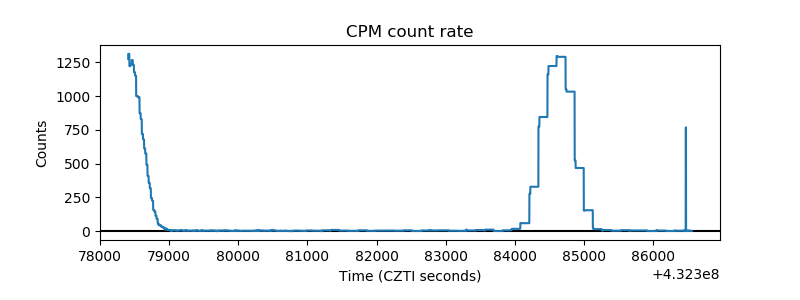 |
| CZT Counter | 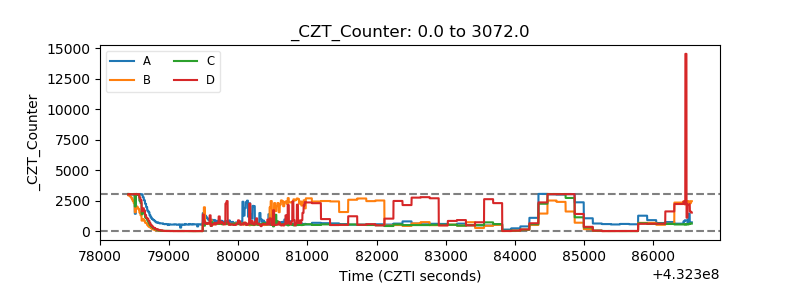 |
| +2.5 Volts monitor |  |
| +5 Volts monitor | 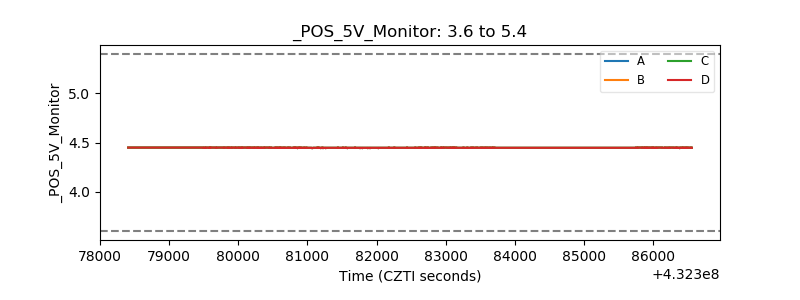 |
| _ROLL_ROT | 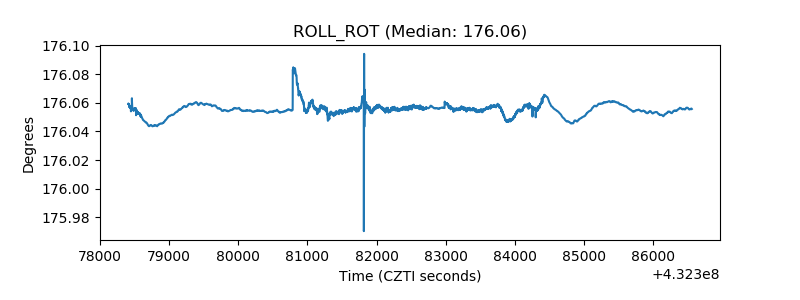 |
| _Roll_DEC | 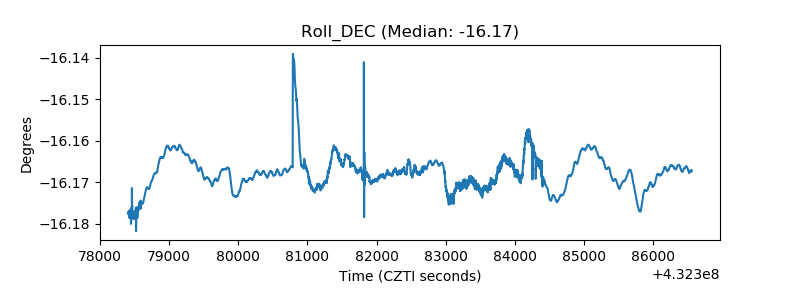 |
| _Roll_RA | 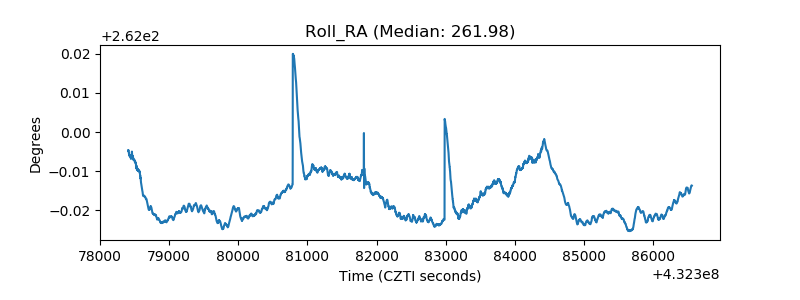 |
| Veto Counter | 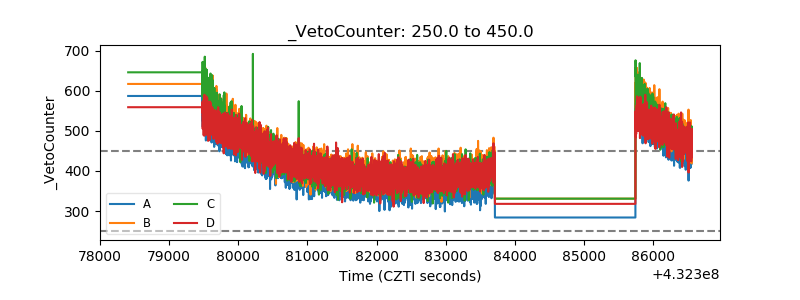 |