| Param | Original file | Final file |
|---|---|---|
| Filename | modeM0/AS1T05_148T01_9000005838_43054cztM0_level2.fits | modeM0/AS1T05_148T01_9000005838_43054cztM0_level2_quad_clean.evt |
| Size (bytes) | 324,982,080 | 46,607,040 |
| Size | 309.9 MB | 44.4 MB |
| Events in quadrant A | 1,804,057 | 420,228 |
| Events in quadrant B | 4,251,193 | 211,402 |
| Events in quadrant C | 1,441,153 | 403,122 |
| Events in quadrant D | 4,342,730 | 201,818 |
| Mode M9 | |||
|---|---|---|---|
| Quadrant | BADHDUFLAG | Total packets | Discarded packets |
| A | 0 | 5 | 0 |
| B | 0 | 6 | 0 |
| C | 0 | 6 | 0 |
| D | 0 | 6 | 0 |
| Mode SS | |||
|---|---|---|---|
| Quadrant | BADHDUFLAG | Total packets | Discarded packets |
| A | 0 | 48 | 0 |
| B | 0 | 48 | 0 |
| C | 0 | 48 | 0 |
| D | 0 | 48 | 0 |
| Mode M0 | |||
|---|---|---|---|
| Quadrant | BADHDUFLAG | Total packets | Discarded packets |
| A | 0 | 7266 | 1 |
| B | 0 | 14349 | 1 |
| C | 0 | 5822 | 1 |
| D | 0 | 14612 | 1 |
| Quadrant | Total seconds | Saturated seconds | Saturation percentage |
|---|---|---|---|
| A | 2436 | 44 | 1.806240% |
| B | 2436 | 1351 | 55.459770% |
| C | 2436 | 5 | 0.205255% |
| D | 2436 | 1217 | 49.958949% |
Noise dominated data is calculated using 1-second bins in cleaned event files. If a bin has >2000 counts, and if more than 50% of those come from <1% of pixels, then it is considered to be noise-dominated and hence unusable.
| Quadrant | # 1 sec bins | Bins with >0 counts | Bins with >2000 counts | High rate bins dominated by noise | Noise dominated (total time) | Noise dominated (detector-on time) | Marked lightcurve |
|---|---|---|---|---|---|---|---|
| A | 2436 | 2436 | 21 | 21 | 0.86% | 0.86% | 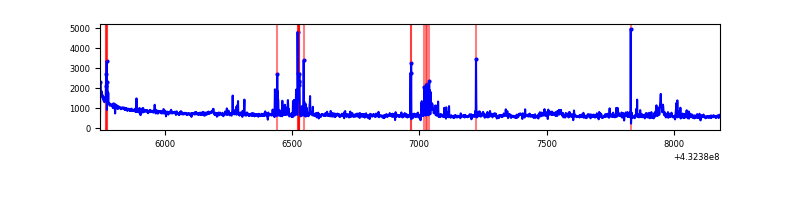 |
| B | 2436 | 2436 | 1113 | 1113 | 45.69% | 45.69% | 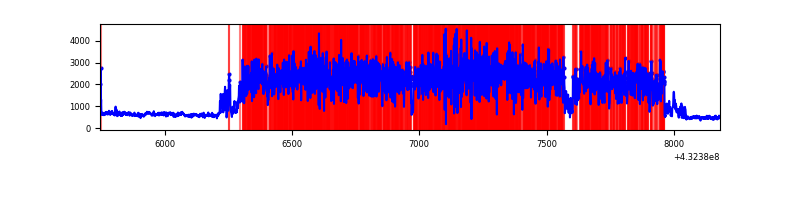 |
| C | 2436 | 2436 | 7 | 7 | 0.29% | 0.29% | 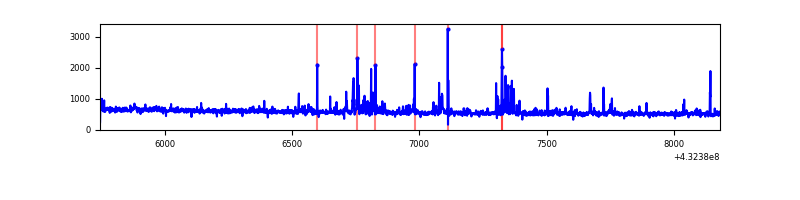 |
| D | 2436 | 2436 | 1133 | 1133 | 46.51% | 46.51% | 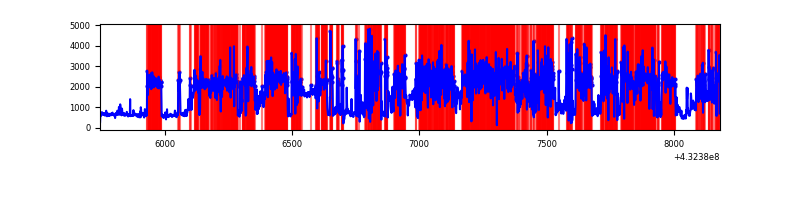 |
Top three noisy pixels from each quadrant. If the there are fewer than three noisy pixels in the level2.evt file, extra rows are filled as -1
| Pixel properties | Quadrant properties | ||||||
|---|---|---|---|---|---|---|---|
| Quadrant | DetID | PixID | Counts | Sigma | Mean | Median | Sigma |
| A | 10 | 83 | 301334 | 3974.77 | 329 | 323 | 75.7 |
| A | 15 | 237 | 136807 | 1802.23 | 329 | 323 | 75.7 |
| A | 12 | 189 | 51694 | 678.33 | 329 | 323 | 75.7 |
| B | 0 | 186 | 2897756 | 51299.11 | 258 | 252 | 56.5 |
| B | 0 | 229 | 153052 | 2705.26 | 258 | 252 | 56.5 |
| B | 4 | 171 | 130203 | 2300.73 | 258 | 252 | 56.5 |
| C | 15 | 214 | 108814 | 1329.51 | 312 | 314 | 81.6 |
| C | 15 | 111 | 83822 | 1023.27 | 312 | 314 | 81.6 |
| C | 14 | 254 | 21246 | 256.49 | 312 | 314 | 81.6 |
| D | 1 | 52 | 1538337 | 22123.75 | 253 | 245 | 69.5 |
| D | 2 | 16 | 1314951 | 18910.59 | 253 | 245 | 69.5 |
| D | 10 | 118 | 272230 | 3912.2 | 253 | 245 | 69.5 |
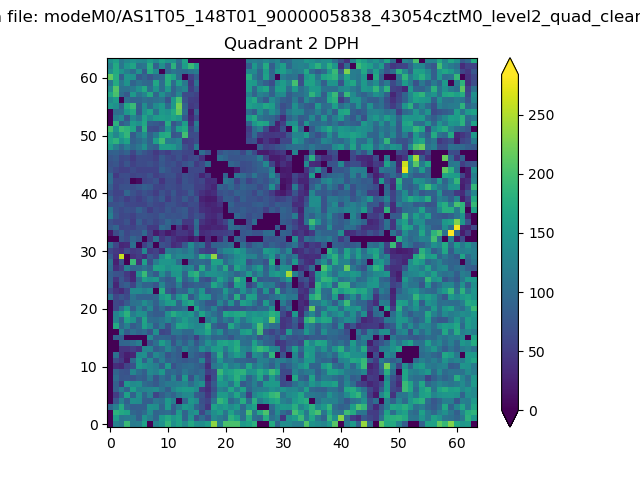
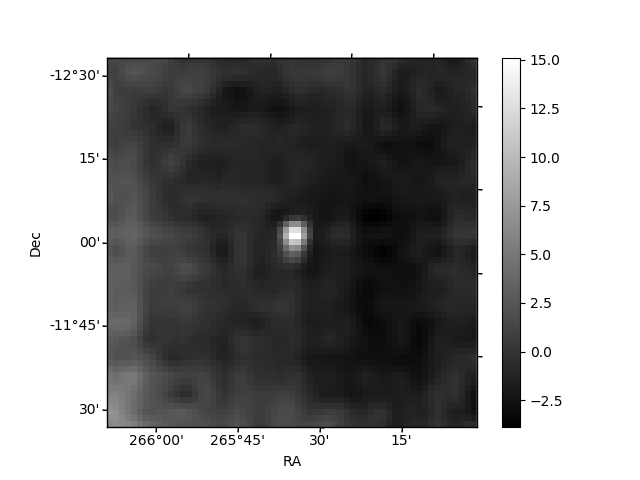
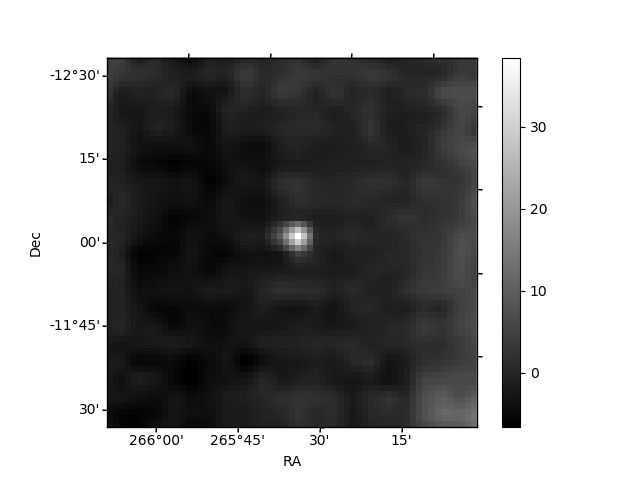
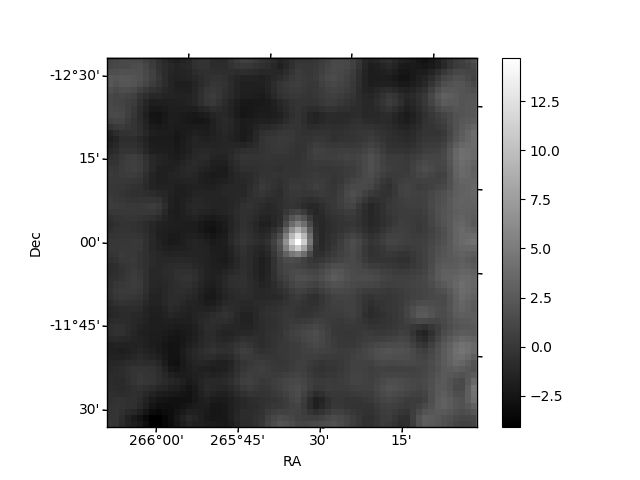
Histogram calculated using DETX and DETY for each event in the final _common_clean file
| Quadrant A |  |
 |
Quadrant B |
|---|---|---|---|
| Quadrant D | 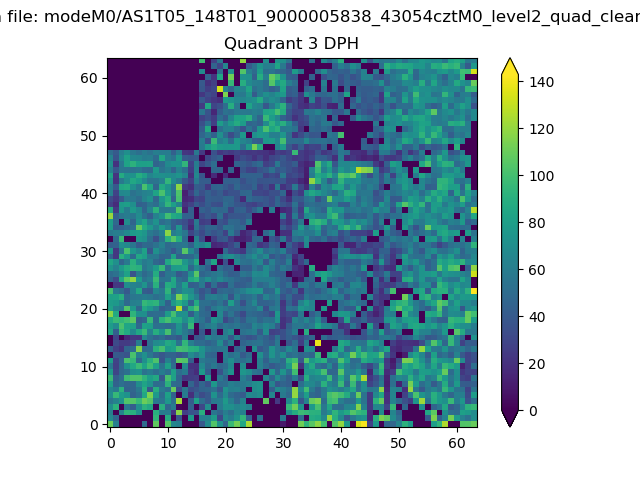 |
 |
Quadrant C |
| Plot type | Count rate plots | Images |
|---|---|---|
| Comparison with Poisson distribution Blue bars denote a histogram of data divided into 1 sec bins. Red curve is a Poisson curve with rate = median count rate of data. |
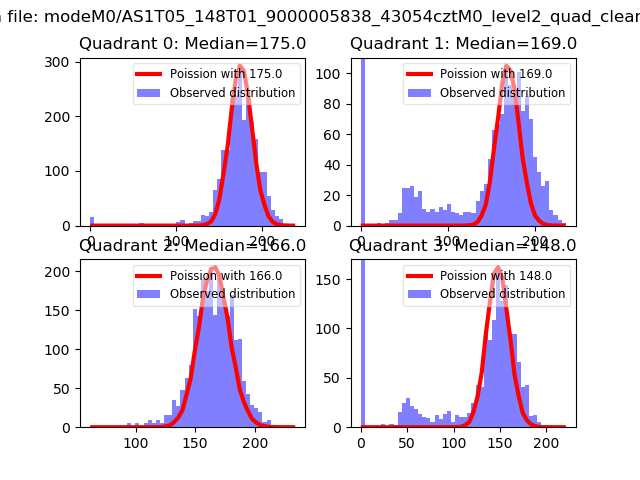 |
 |
| Quadrant-wise count rates Data is divided into 100 sec bins |
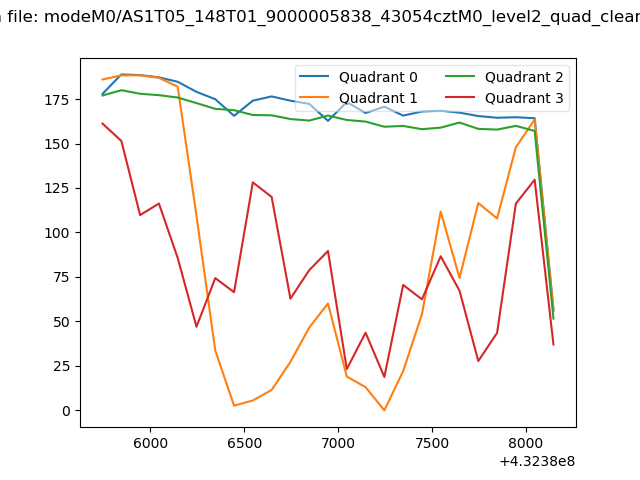 |
|
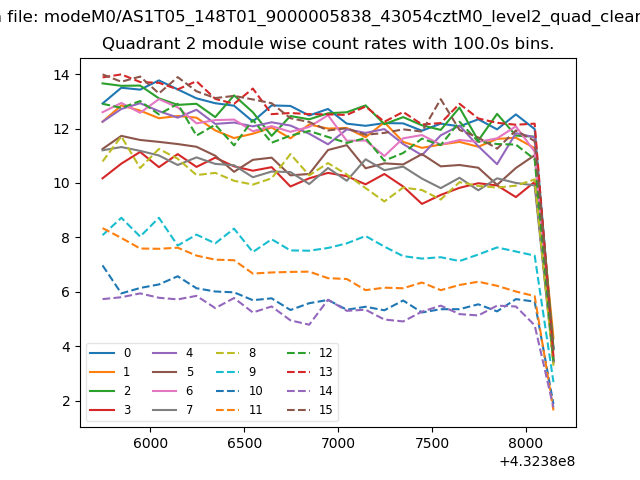
| Module-wise count rates for Quadrant A Data is divided into 100 sec bins |
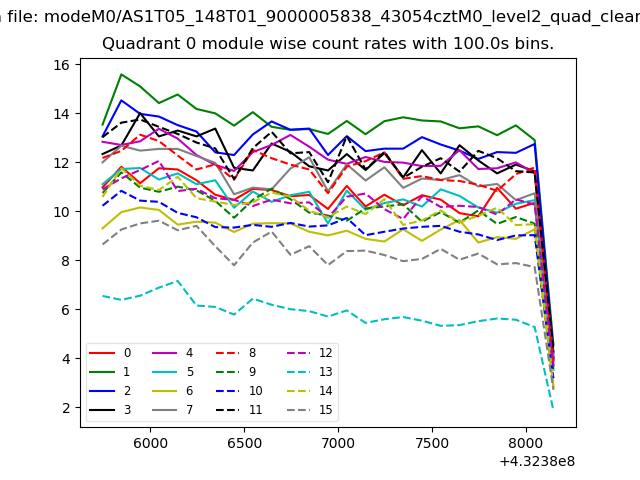 |
 |
| Module-wise count rates for Quadrant B Data is divided into 100 sec bins |
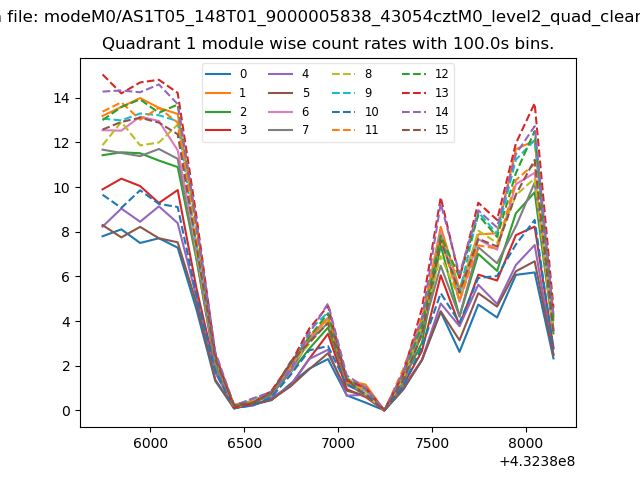 |
 |
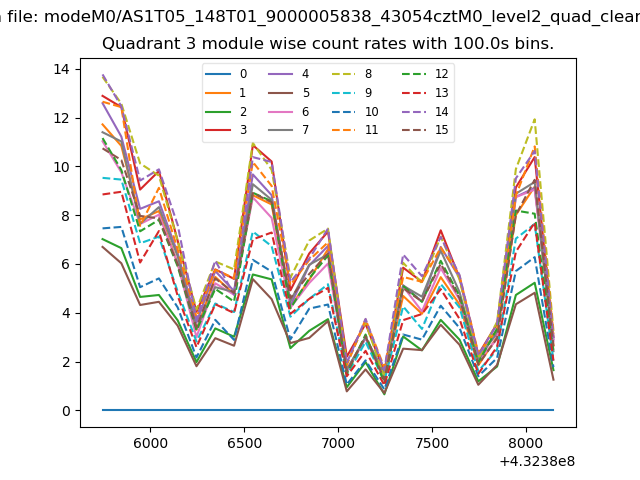
| Module-wise count rates for Quadrant C Data is divided into 100 sec bins |
 |
 |
| Module-wise count rates for Quadrant D Data is divided into 100 sec bins |
 |
 |
| Parameter | Plot |
|---|---|
| CZT HV Monitor | 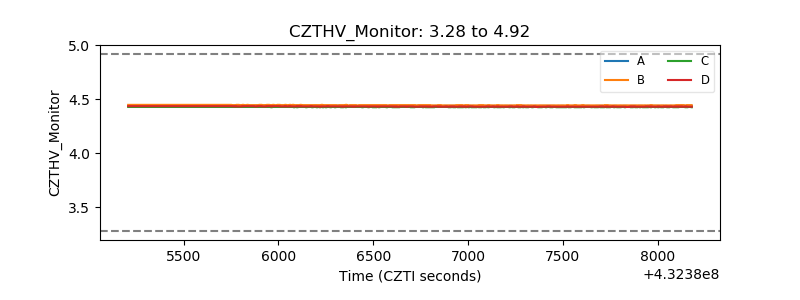 |
| D_VDD | 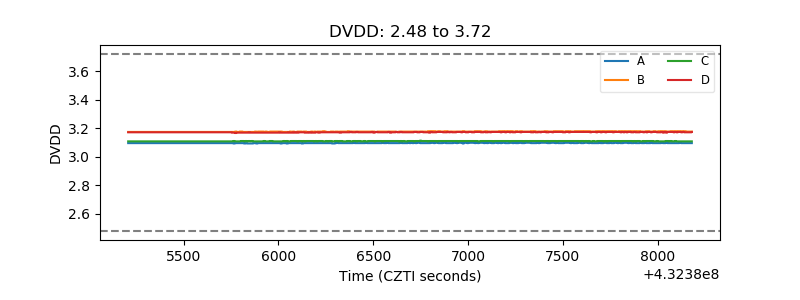 |
| Temperature 1 | 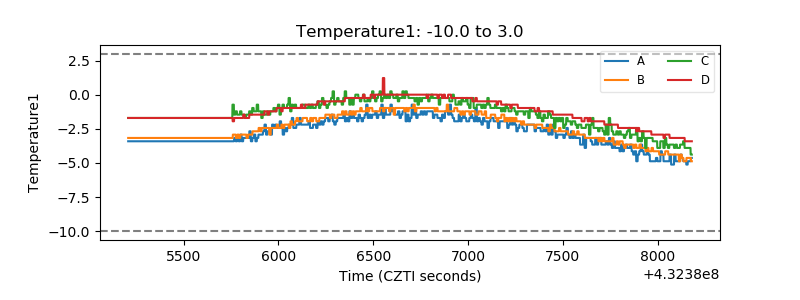 |
| Veto HV Monitor | 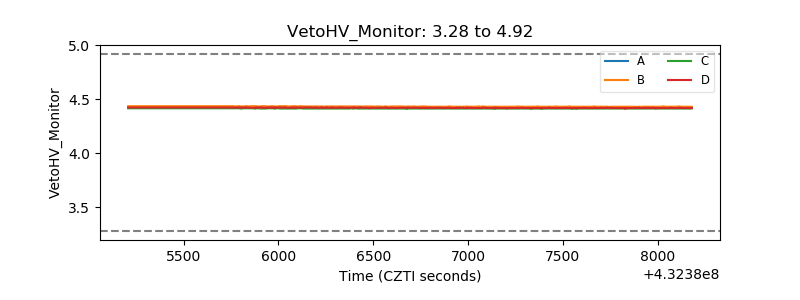 |
| Veto LLD | 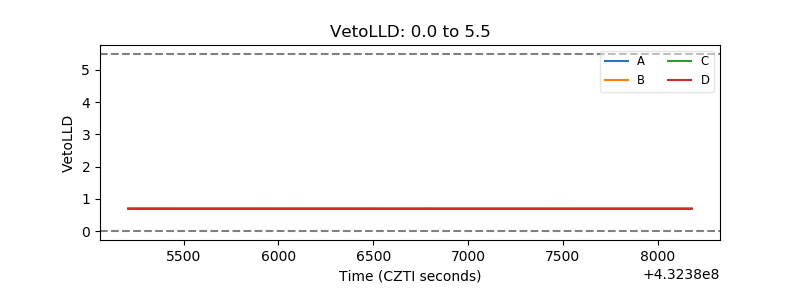 |
| Alpha Counter | 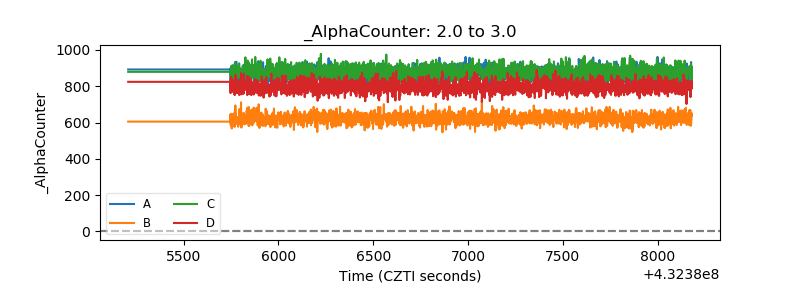 |
| _CPM_Rate |  |
| CZT Counter | 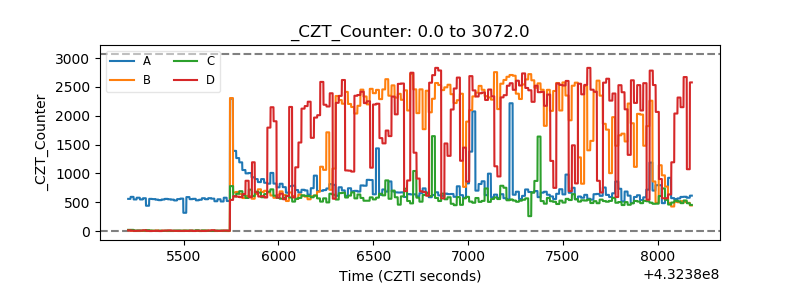 |
| +2.5 Volts monitor |  |
| +5 Volts monitor | 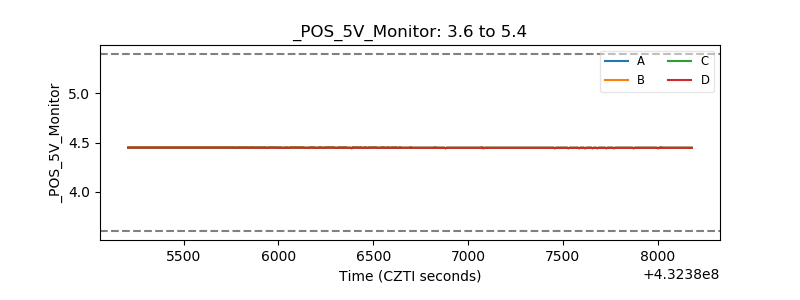 |
| _ROLL_ROT | 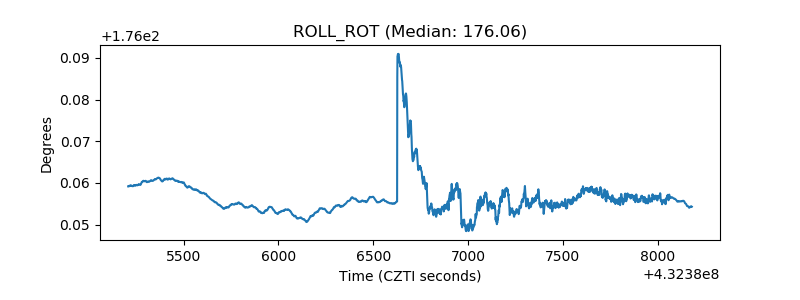 |
| _Roll_DEC | 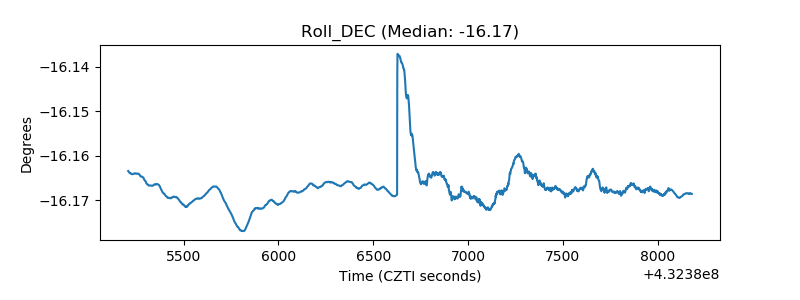 |
| _Roll_RA | 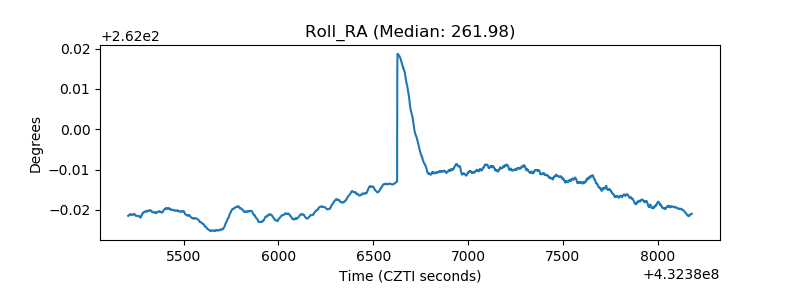 |
| Veto Counter | 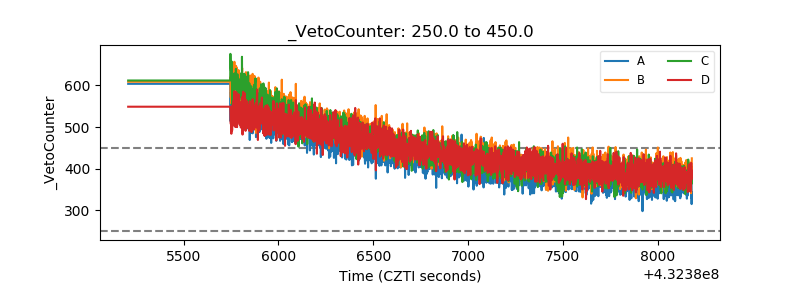 |