| Param | Original file | Final file |
|---|---|---|
| Filename | modeM0/AS1A09_006T08_9000005840_43055cztM0_level2.fits | modeM0/AS1A09_006T08_9000005840_43055cztM0_level2_quad_clean.evt |
| Size (bytes) | 489,821,760 | 87,013,440 |
| Size | 467.1 MB | 83.0 MB |
| Events in quadrant A | 3,569,211 | 645,332 |
| Events in quadrant B | 6,257,556 | 482,374 |
| Events in quadrant C | 2,540,796 | 627,860 |
| Events in quadrant D | 5,363,212 | 517,825 |
| Mode SS | |||
|---|---|---|---|
| Quadrant | BADHDUFLAG | Total packets | Discarded packets |
| A | 0 | 104 | 0 |
| B | 0 | 104 | 0 |
| C | 0 | 104 | 0 |
| D | 0 | 104 | 0 |
| Mode M9 | |||
|---|---|---|---|
| Quadrant | BADHDUFLAG | Total packets | Discarded packets |
| A | 0 | 26 | 0 |
| B | 0 | 27 | 0 |
| C | 0 | 27 | 0 |
| D | 0 | 27 | 0 |
| Mode M0 | |||
|---|---|---|---|
| Quadrant | BADHDUFLAG | Total packets | Discarded packets |
| A | 0 | 13882 | 2 |
| B | 0 | 22015 | 2 |
| C | 0 | 10632 | 2 |
| D | 0 | 19367 | 2 |
| Quadrant | Total seconds | Saturated seconds | Saturation percentage |
|---|---|---|---|
| A | 5158 | 131 | 2.539744% |
| B | 5158 | 1448 | 28.072896% |
| C | 5158 | 3 | 0.058162% |
| D | 5158 | 720 | 13.958899% |
Noise dominated data is calculated using 1-second bins in cleaned event files. If a bin has >2000 counts, and if more than 50% of those come from <1% of pixels, then it is considered to be noise-dominated and hence unusable.
| Quadrant | # 1 sec bins | Bins with >0 counts | Bins with >2000 counts | High rate bins dominated by noise | Noise dominated (total time) | Noise dominated (detector-on time) | Marked lightcurve |
|---|---|---|---|---|---|---|---|
| A | 7280 | 5159 | 137 | 137 | 1.88% | 2.66% | 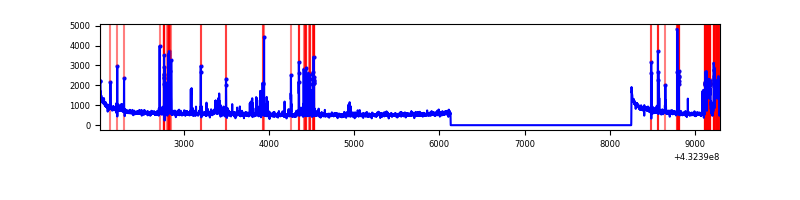 |
| B | 7280 | 5159 | 1274 | 1274 | 17.50% | 24.69% | 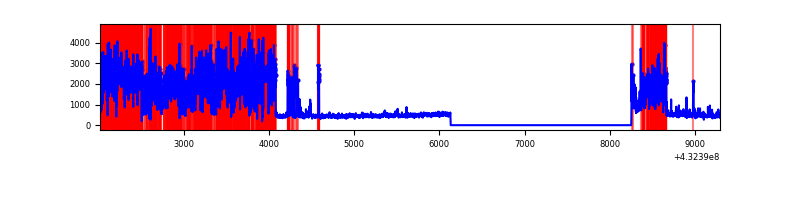 |
| C | 7280 | 5159 | 2 | 2 | 0.03% | 0.04% | 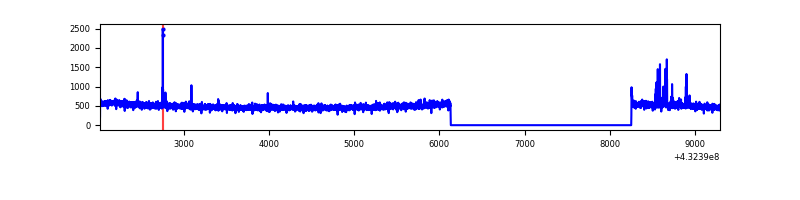 |
| D | 7280 | 5159 | 663 | 663 | 9.11% | 12.85% | 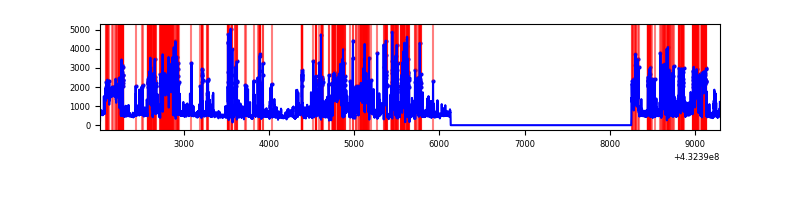 |
Top three noisy pixels from each quadrant. If the there are fewer than three noisy pixels in the level2.evt file, extra rows are filled as -1
| Pixel properties | Quadrant properties | ||||||
|---|---|---|---|---|---|---|---|
| Quadrant | DetID | PixID | Counts | Sigma | Mean | Median | Sigma |
| A | 10 | 83 | 621302 | 4995.86 | 596 | 583 | 124.2 |
| A | 15 | 237 | 505380 | 4062.86 | 596 | 583 | 124.2 |
| A | 12 | 189 | 119696 | 958.68 | 596 | 583 | 124.2 |
| B | 0 | 186 | 2677071 | 26392.12 | 517 | 503 | 101.4 |
| B | 0 | 229 | 1353620 | 13342.32 | 517 | 503 | 101.4 |
| B | 4 | 171 | 136728 | 1343.24 | 517 | 503 | 101.4 |
| C | 15 | 214 | 229677 | 1675.06 | 575 | 578 | 136.8 |
| C | 15 | 111 | 36341 | 261.48 | 575 | 578 | 136.8 |
| C | 14 | 254 | 11504 | 79.89 | 575 | 578 | 136.8 |
| D | 1 | 52 | 1276036 | 9292.18 | 550 | 533 | 137.3 |
| D | 2 | 16 | 1221754 | 8896.73 | 550 | 533 | 137.3 |
| D | 10 | 118 | 211908 | 1539.89 | 550 | 533 | 137.3 |
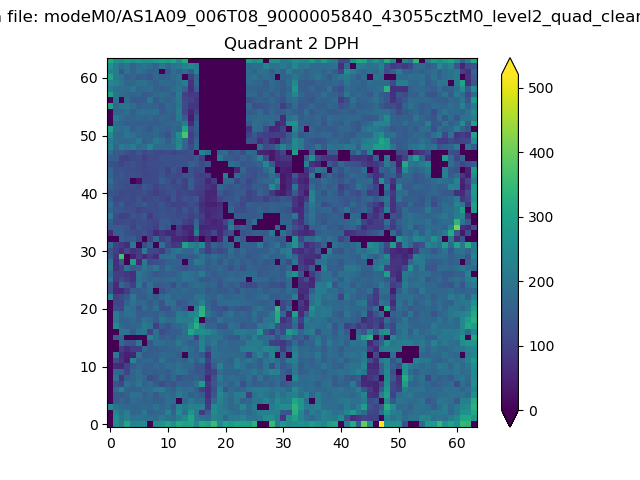
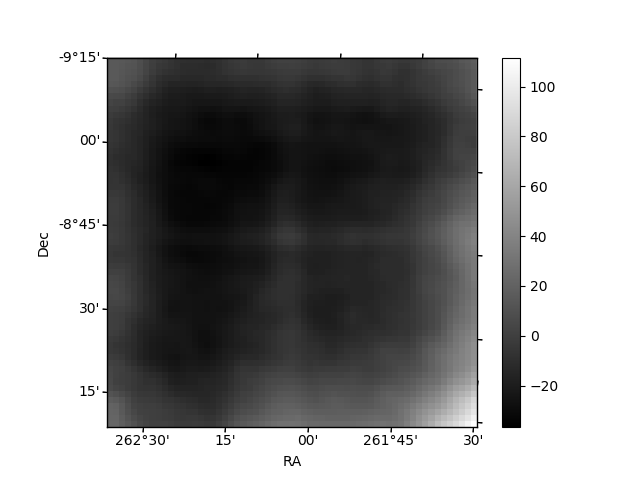
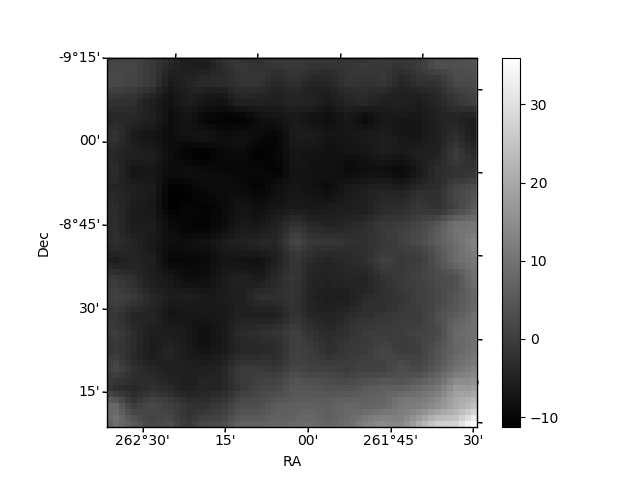
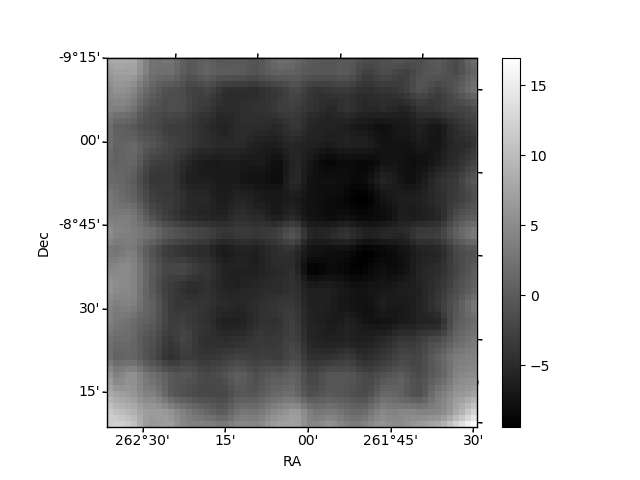
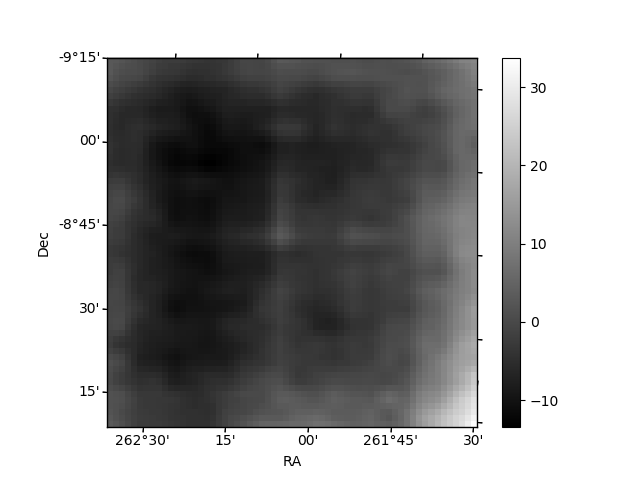
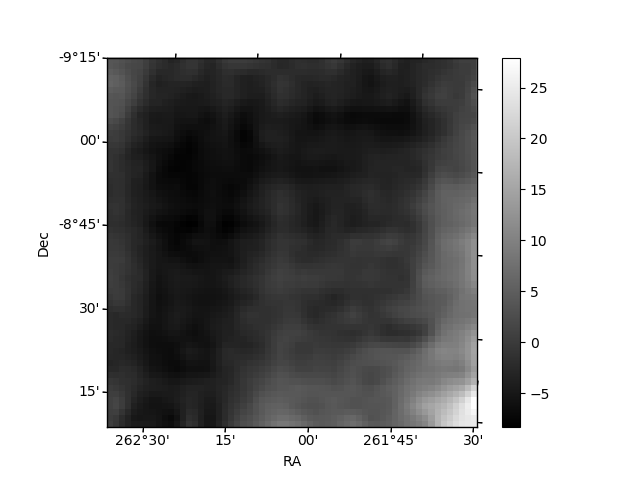
Histogram calculated using DETX and DETY for each event in the final _common_clean file
| Quadrant A | 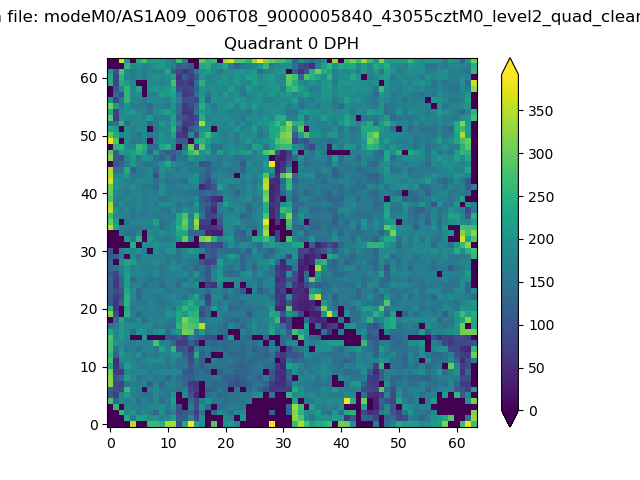 |
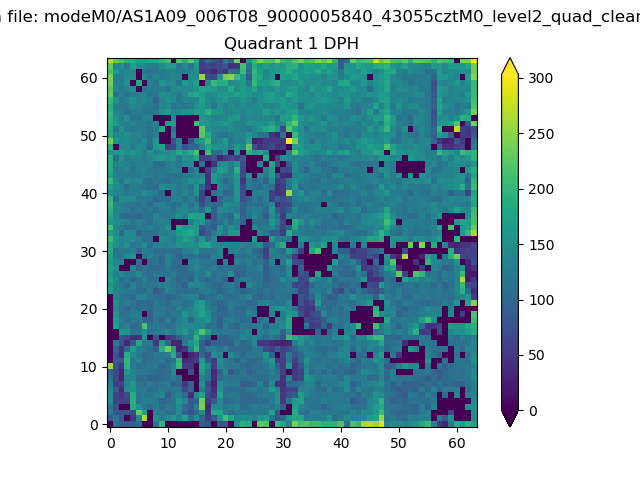 |
Quadrant B |
|---|---|---|---|
| Quadrant D | 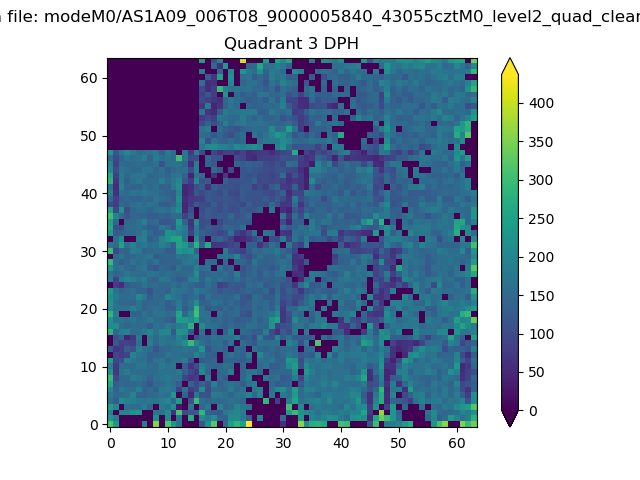 |
 |
Quadrant C |
| Plot type | Count rate plots | Images |
|---|---|---|
| Comparison with Poisson distribution Blue bars denote a histogram of data divided into 1 sec bins. Red curve is a Poisson curve with rate = median count rate of data. |
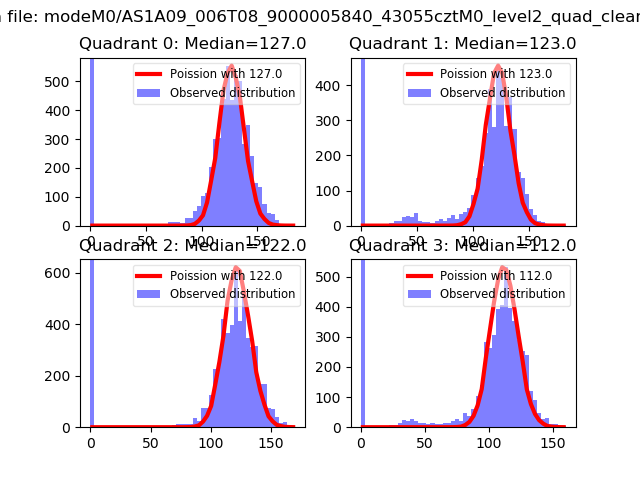 |
 |
| Quadrant-wise count rates Data is divided into 100 sec bins |
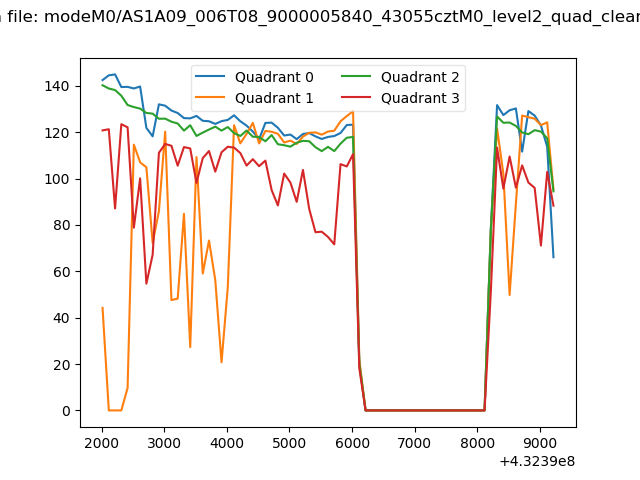 |
|
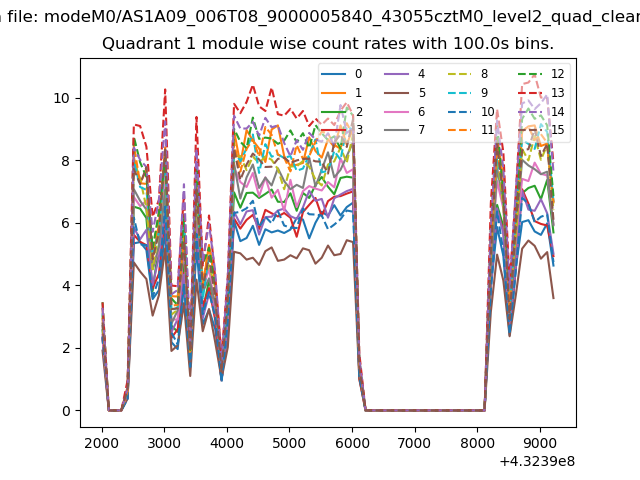
| Module-wise count rates for Quadrant A Data is divided into 100 sec bins |
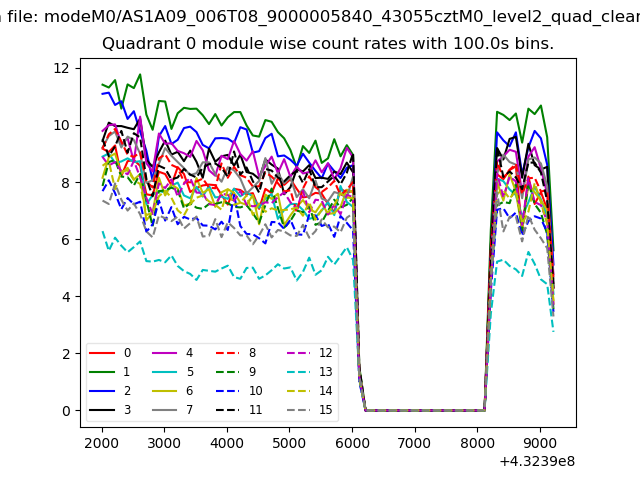 |
 |
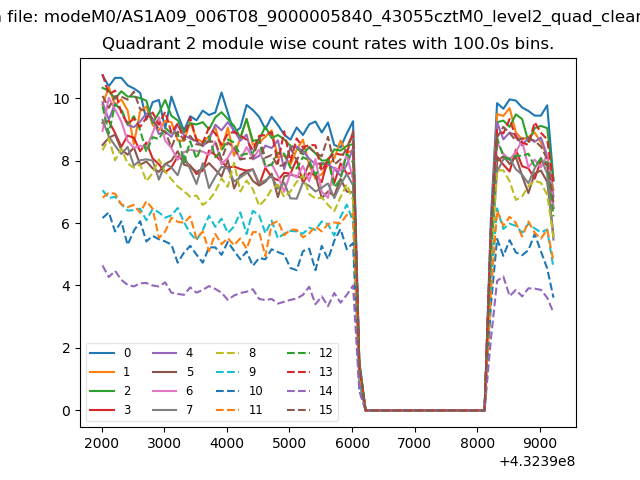
| Module-wise count rates for Quadrant B Data is divided into 100 sec bins |
 |
 |
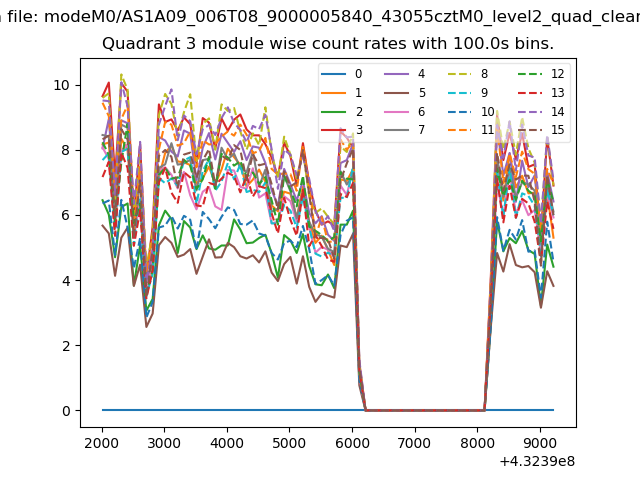
| Module-wise count rates for Quadrant C Data is divided into 100 sec bins |
 |
 |
| Module-wise count rates for Quadrant D Data is divided into 100 sec bins |
 |
 |
| Parameter | Plot |
|---|---|
| CZT HV Monitor |  |
| D_VDD | 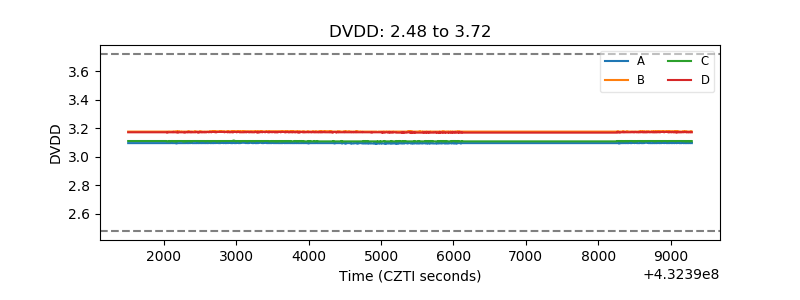 |
| Temperature 1 | 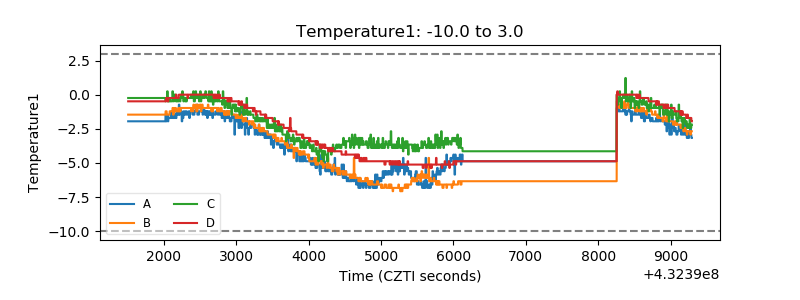 |
| Veto HV Monitor | 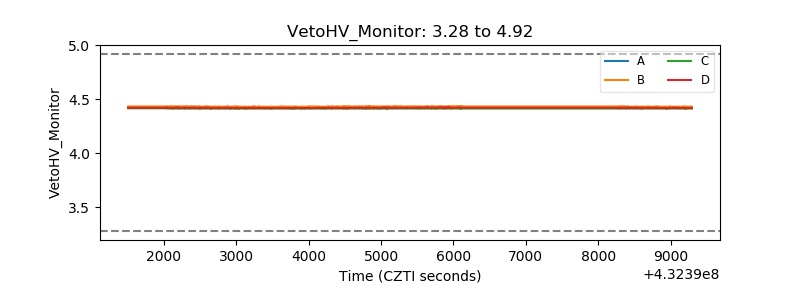 |
| Veto LLD | 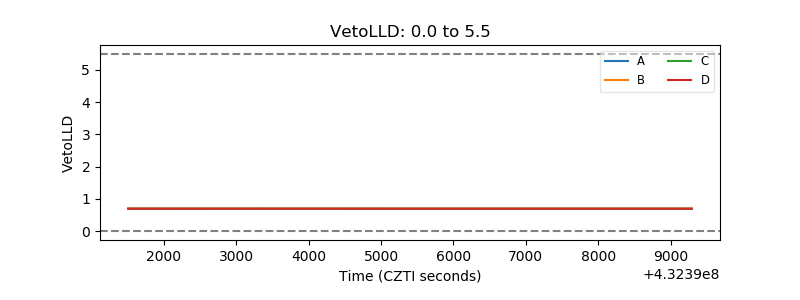 |
| Alpha Counter | 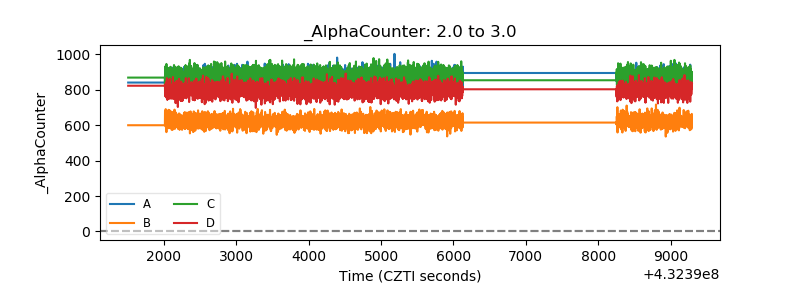 |
| _CPM_Rate | 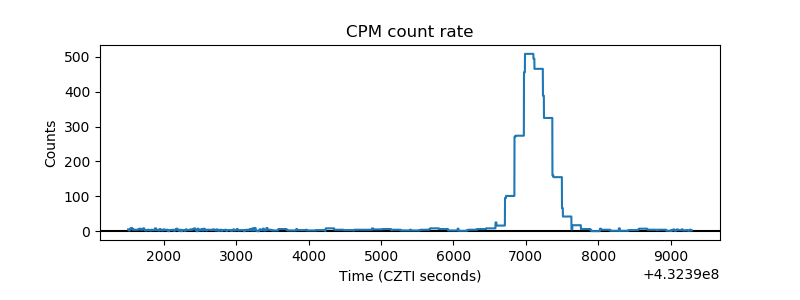 |
| CZT Counter | 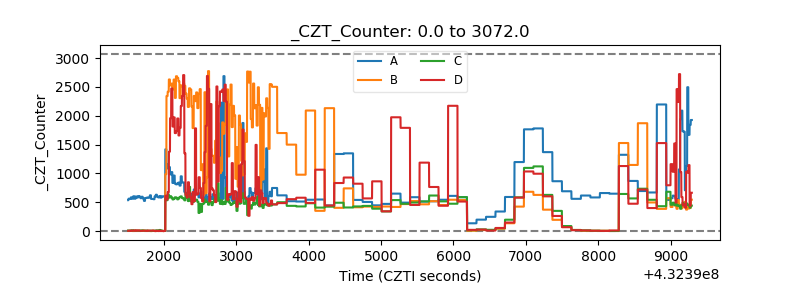 |
| +2.5 Volts monitor | 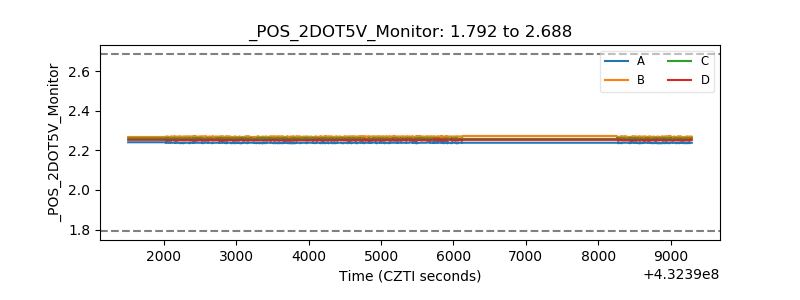 |
| +5 Volts monitor | 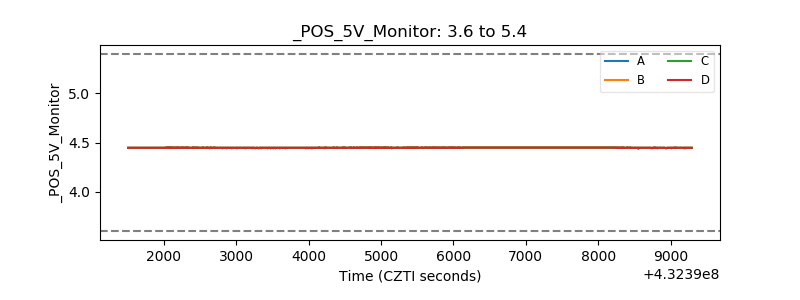 |
| _ROLL_ROT | 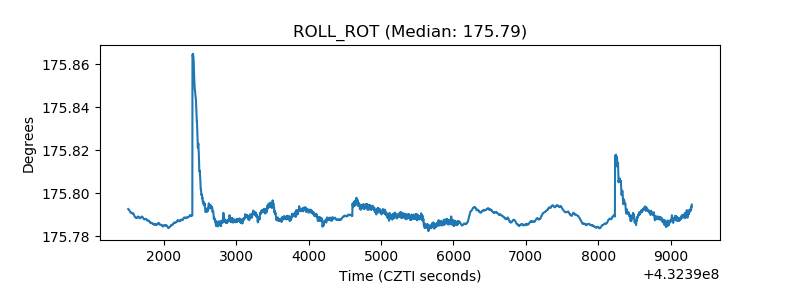 |
| _Roll_DEC | 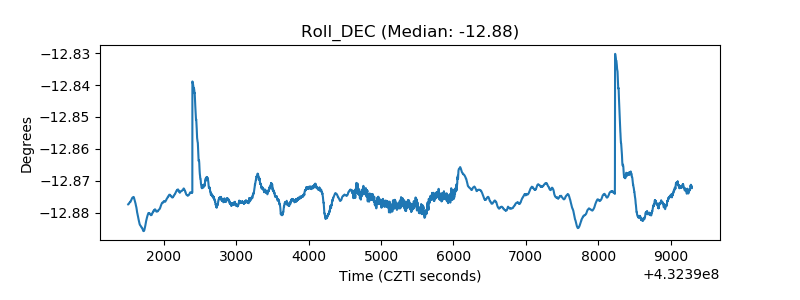 |
| _Roll_RA | 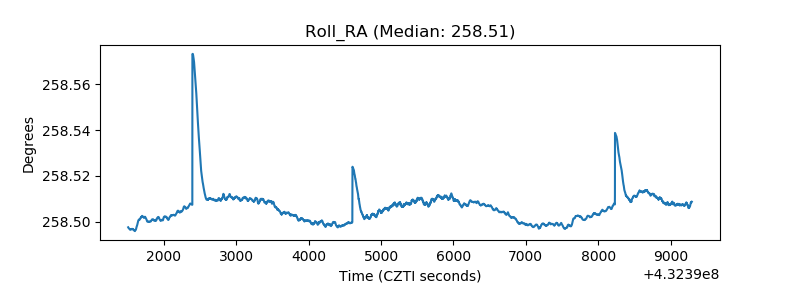 |
| Veto Counter | 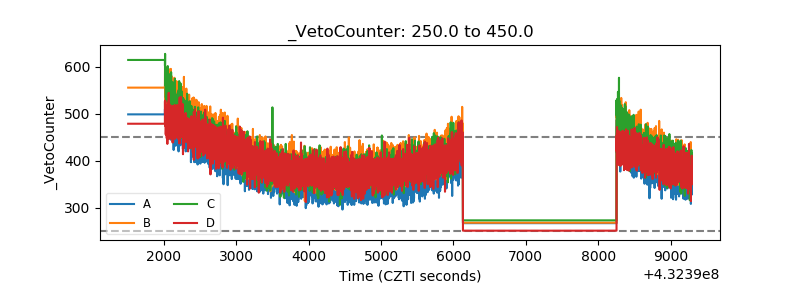 |