| Param | Original file | Final file |
|---|---|---|
| Filename | modeM0/AS1A09_006T08_9000005840_43057cztM0_level2.fits | modeM0/AS1A09_006T08_9000005840_43057cztM0_level2_quad_clean.evt |
| Size (bytes) | 428,636,160 | 79,905,600 |
| Size | 408.8 MB | 76.2 MB |
| Events in quadrant A | 3,069,797 | 563,798 |
| Events in quadrant B | 2,845,877 | 561,453 |
| Events in quadrant C | 2,329,370 | 547,489 |
| Events in quadrant D | 7,235,425 | 398,555 |
| Mode SS | |||
|---|---|---|---|
| Quadrant | BADHDUFLAG | Total packets | Discarded packets |
| A | 0 | 100 | 0 |
| B | 0 | 100 | 0 |
| C | 0 | 100 | 0 |
| D | 0 | 100 | 0 |
| Mode M9 | |||
|---|---|---|---|
| Quadrant | BADHDUFLAG | Total packets | Discarded packets |
| A | 0 | 30 | 0 |
| B | 0 | 31 | 0 |
| C | 0 | 31 | 0 |
| D | 0 | 31 | 0 |
| Mode M0 | |||
|---|---|---|---|
| Quadrant | BADHDUFLAG | Total packets | Discarded packets |
| A | 0 | 12266 | 2 |
| B | 0 | 11848 | 2 |
| C | 0 | 10062 | 2 |
| D | 0 | 24947 | 2 |
| Quadrant | Total seconds | Saturated seconds | Saturation percentage |
|---|---|---|---|
| A | 4966 | 77 | 1.550544% |
| B | 4966 | 154 | 3.101087% |
| C | 4966 | 2 | 0.040274% |
| D | 4966 | 1260 | 25.372533% |
Noise dominated data is calculated using 1-second bins in cleaned event files. If a bin has >2000 counts, and if more than 50% of those come from <1% of pixels, then it is considered to be noise-dominated and hence unusable.
| Quadrant | # 1 sec bins | Bins with >0 counts | Bins with >2000 counts | High rate bins dominated by noise | Noise dominated (total time) | Noise dominated (detector-on time) | Marked lightcurve |
|---|---|---|---|---|---|---|---|
| A | 6759 | 4967 | 58 | 58 | 0.86% | 1.17% | 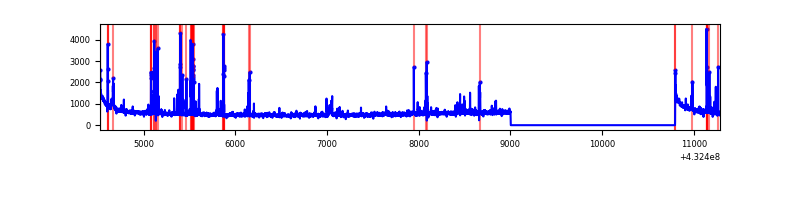 |
| B | 6759 | 4967 | 104 | 104 | 1.54% | 2.09% | 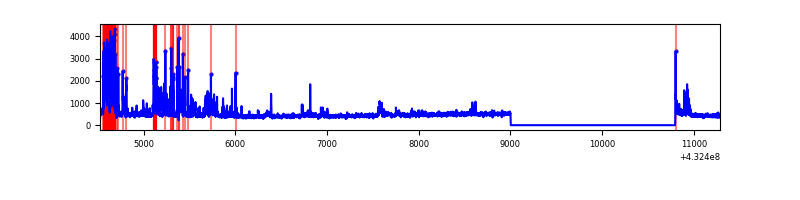 |
| C | 6759 | 4967 | 0 | 0 | 0.00% | 0.00% | 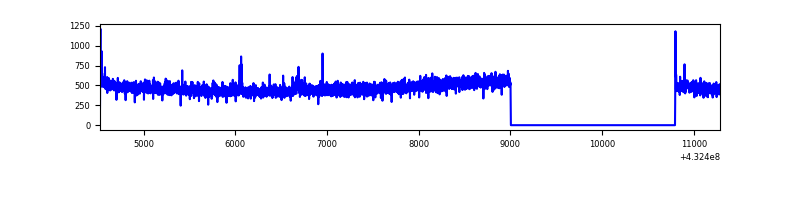 |
| D | 6759 | 4967 | 1276 | 1276 | 18.88% | 25.69% | 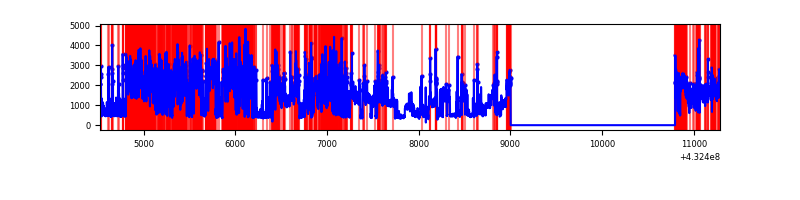 |
Top three noisy pixels from each quadrant. If the there are fewer than three noisy pixels in the level2.evt file, extra rows are filled as -1
| Pixel properties | Quadrant properties | ||||||
|---|---|---|---|---|---|---|---|
| Quadrant | DetID | PixID | Counts | Sigma | Mean | Median | Sigma |
| A | 10 | 83 | 572312 | 4970.66 | 546 | 535 | 115.0 |
| A | 15 | 237 | 259868 | 2254.47 | 546 | 535 | 115.0 |
| A | 12 | 189 | 87516 | 756.16 | 546 | 535 | 115.0 |
| B | 5 | 255 | 383624 | 3588.0 | 536 | 521 | 106.8 |
| B | 4 | 171 | 195361 | 1824.8 | 536 | 521 | 106.8 |
| B | 0 | 229 | 105118 | 979.62 | 536 | 521 | 106.8 |
| C | 15 | 214 | 218897 | 1712.85 | 533 | 536 | 127.5 |
| C | 3 | 233 | 11333 | 84.69 | 533 | 536 | 127.5 |
| C | 7 | 220 | 10021 | 74.4 | 533 | 536 | 127.5 |
| D | 2 | 16 | 2949439 | 24490.13 | 484 | 469 | 120.4 |
| D | 1 | 52 | 1665125 | 13824.36 | 484 | 469 | 120.4 |
| D | 13 | 249 | 276115 | 2289.14 | 484 | 469 | 120.4 |
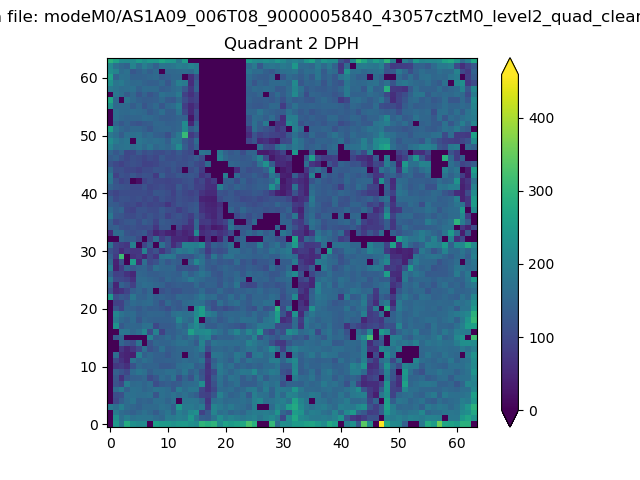
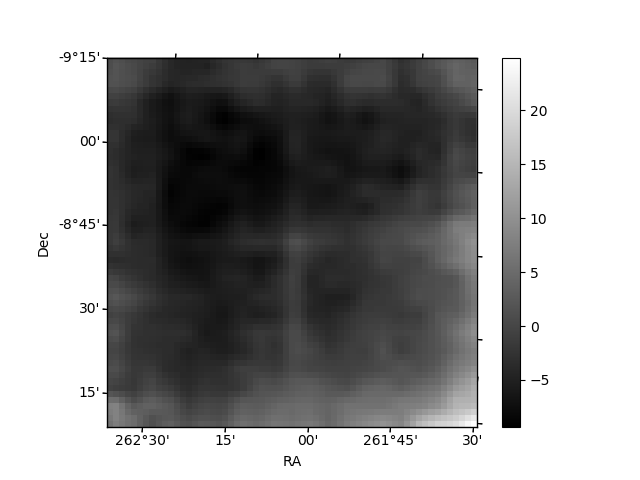
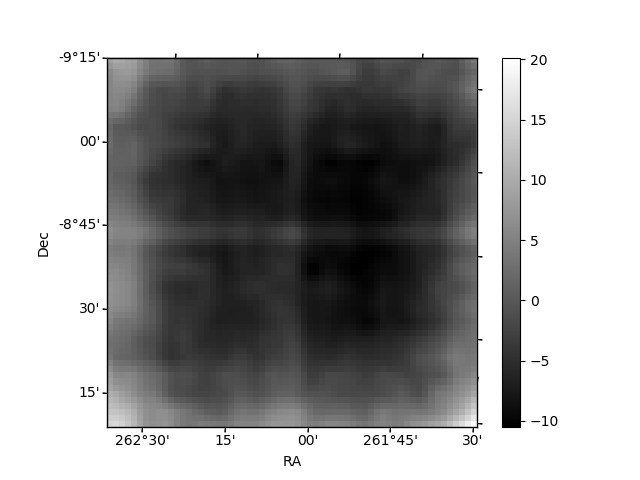
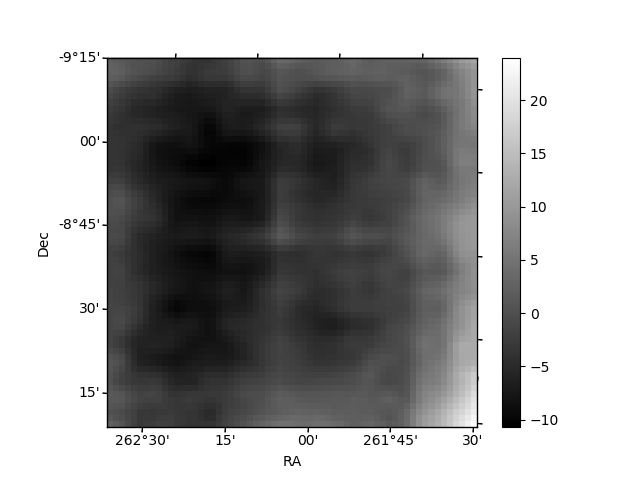
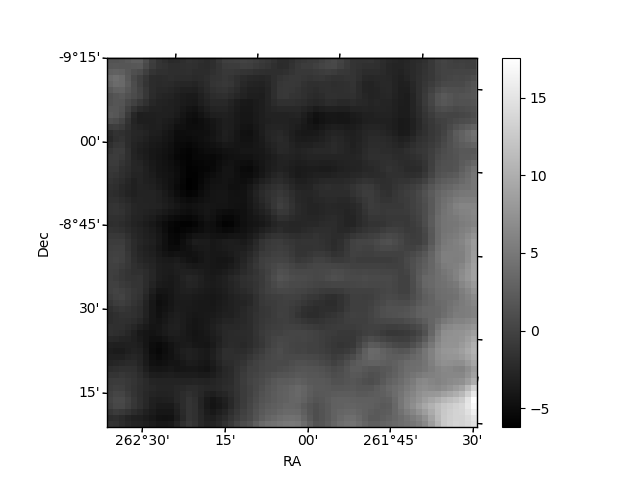
Histogram calculated using DETX and DETY for each event in the final _common_clean file
| Quadrant A | 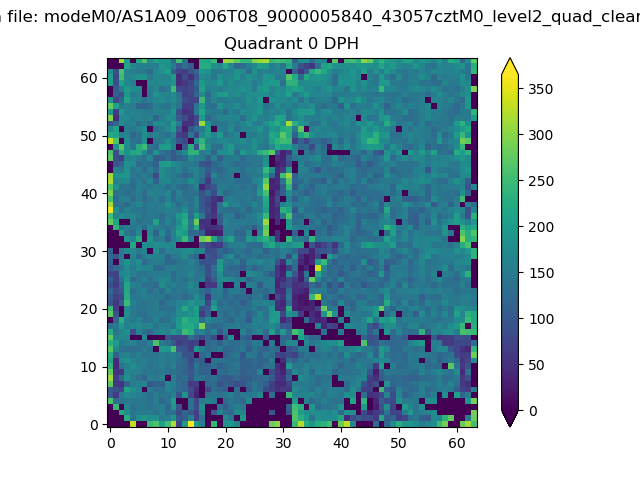 |
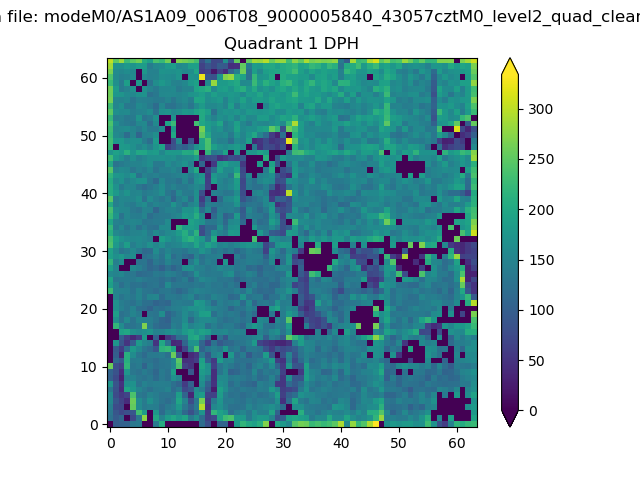 |
Quadrant B |
|---|---|---|---|
| Quadrant D | 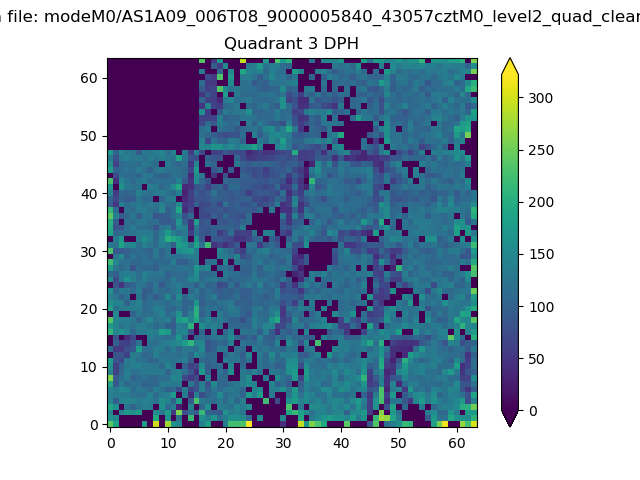 |
 |
Quadrant C |
| Plot type | Count rate plots | Images |
|---|---|---|
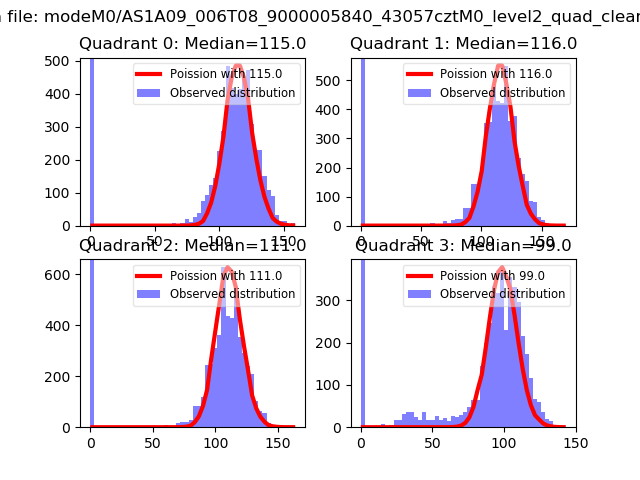
| Comparison with Poisson distribution Blue bars denote a histogram of data divided into 1 sec bins. Red curve is a Poisson curve with rate = median count rate of data. |
 |
 |
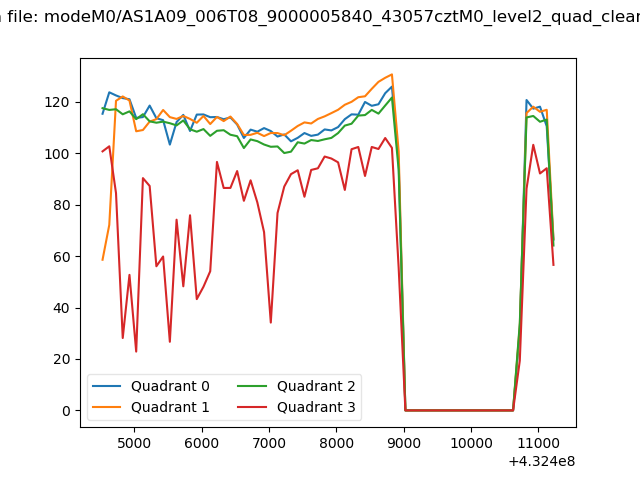
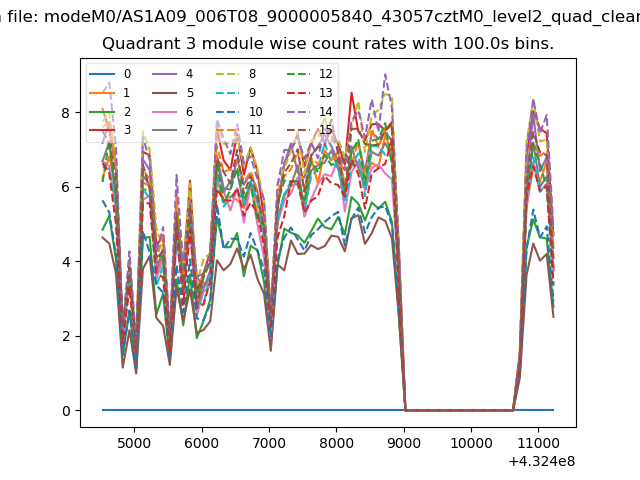
| Quadrant-wise count rates Data is divided into 100 sec bins |
 |
|
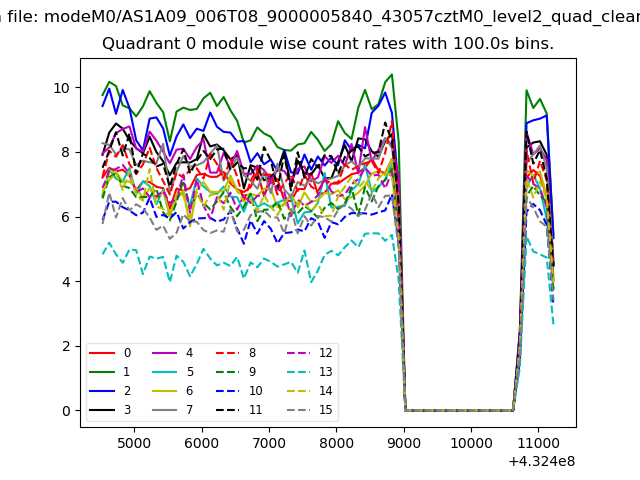
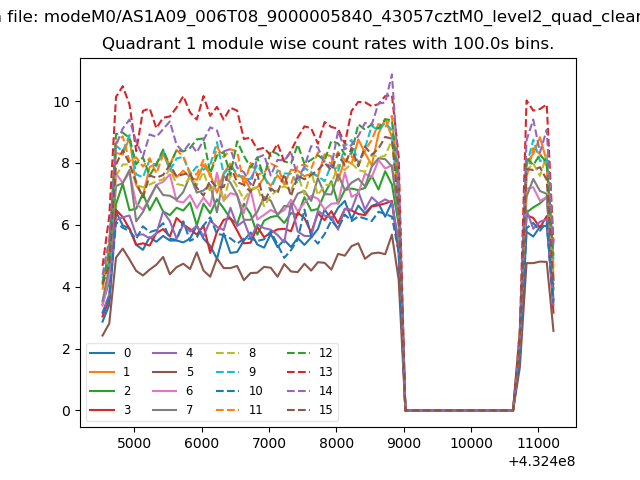
| Module-wise count rates for Quadrant A Data is divided into 100 sec bins |
 |
 |
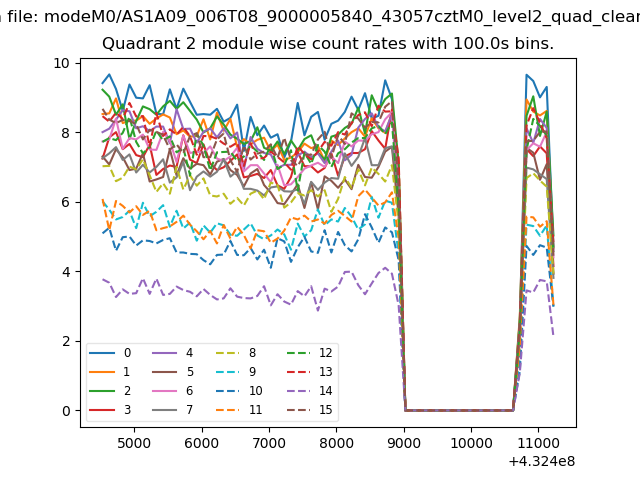
| Module-wise count rates for Quadrant B Data is divided into 100 sec bins |
 |
 |
| Module-wise count rates for Quadrant C Data is divided into 100 sec bins |
 |
 |
| Module-wise count rates for Quadrant D Data is divided into 100 sec bins |
 |
 |
| Parameter | Plot |
|---|---|
| CZT HV Monitor | 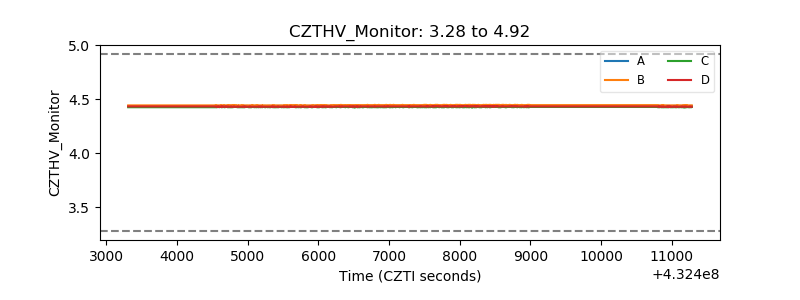 |
| D_VDD | 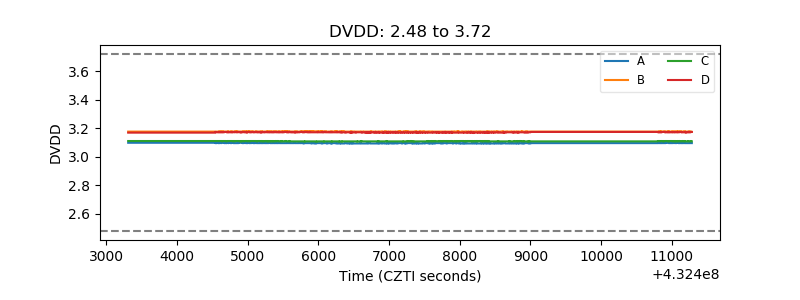 |
| Temperature 1 | 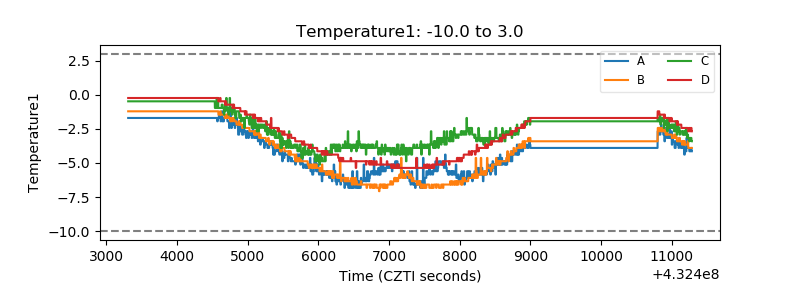 |
| Veto HV Monitor | 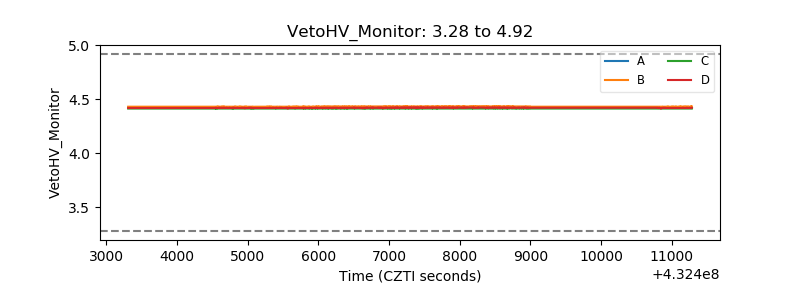 |
| Veto LLD | 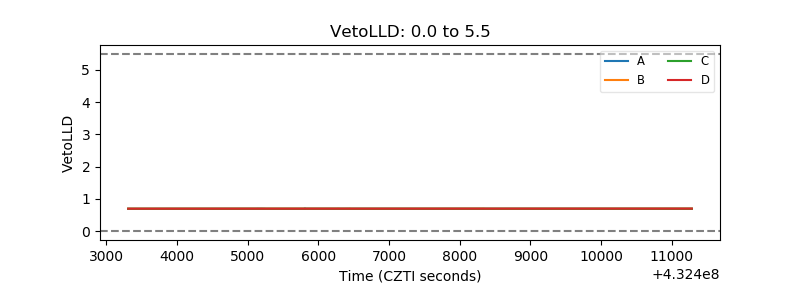 |
| Alpha Counter | 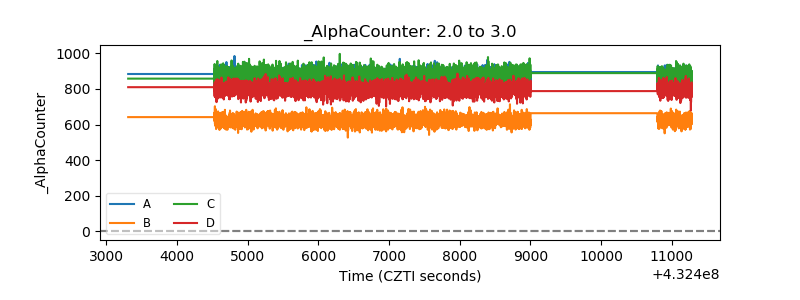 |
| _CPM_Rate | 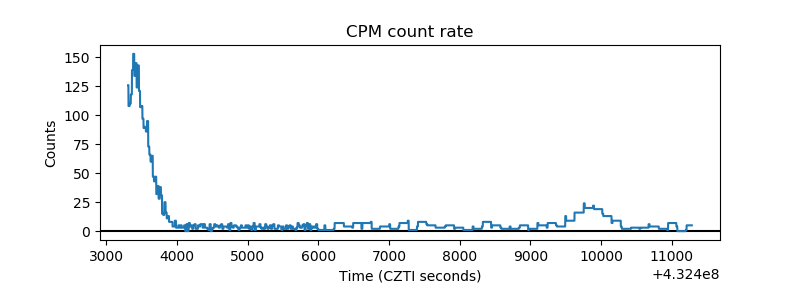 |
| CZT Counter | 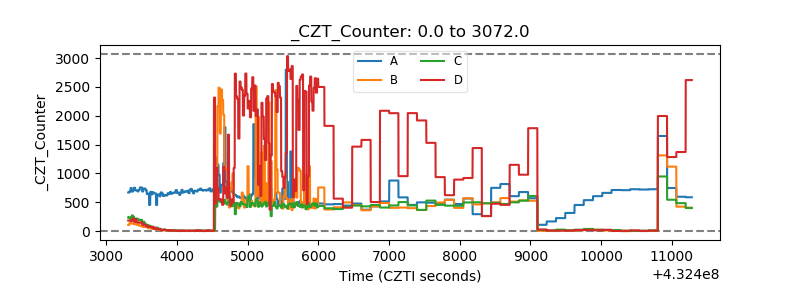 |
| +2.5 Volts monitor | 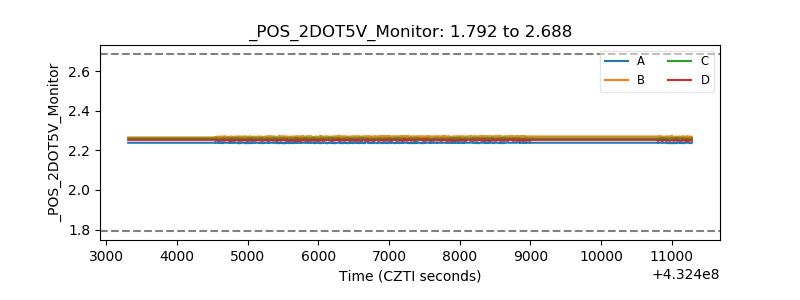 |
| +5 Volts monitor | 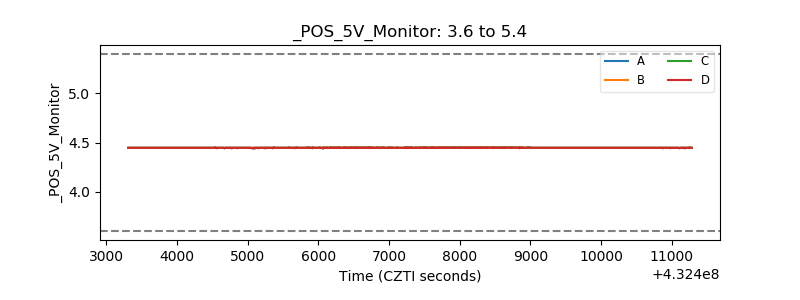 |
| _ROLL_ROT | 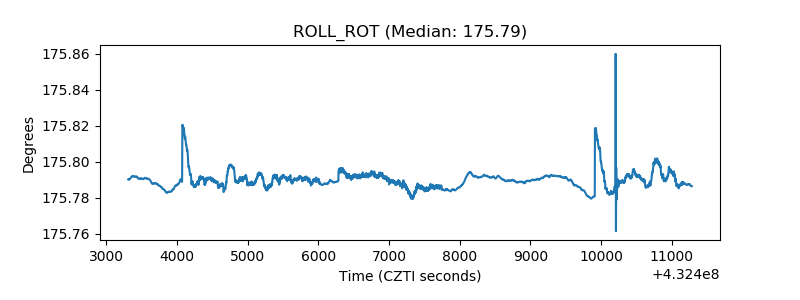 |
| _Roll_DEC | 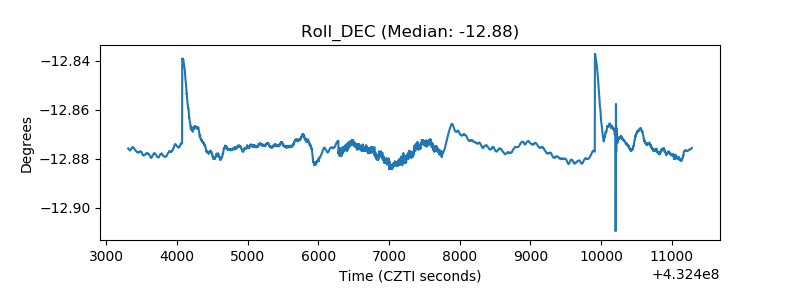 |
| _Roll_RA | 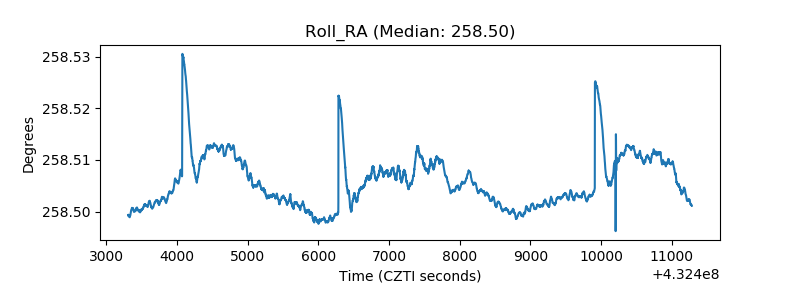 |
| Veto Counter | 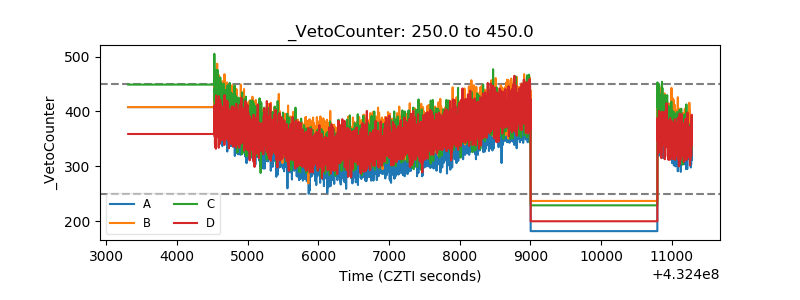 |