| Param | Original file | Final file |
|---|---|---|
| Filename | modeM0/AS1A09_006T08_9000005840_43058cztM0_level2.fits | modeM0/AS1A09_006T08_9000005840_43058cztM0_level2_quad_clean.evt |
| Size (bytes) | 47,790,720 | 8,441,280 |
| Size | 45.6 MB | 8.1 MB |
| Events in quadrant A | 400,620 | 56,531 |
| Events in quadrant B | 261,536 | 56,771 |
| Events in quadrant C | 233,795 | 55,037 |
| Events in quadrant D | 831,862 | 45,527 |
| Mode SS | |||
|---|---|---|---|
| Quadrant | BADHDUFLAG | Total packets | Discarded packets |
| A | 0 | 10 | 0 |
| B | 0 | 10 | 0 |
| C | 0 | 10 | 0 |
| D | 0 | 10 | 0 |
| Mode M9 | |||
|---|---|---|---|
| Quadrant | BADHDUFLAG | Total packets | Discarded packets |
| A | 0 | 7 | 0 |
| B | 0 | 8 | 0 |
| C | 0 | 8 | 0 |
| D | 0 | 8 | 0 |
| Mode M0 | |||
|---|---|---|---|
| Quadrant | BADHDUFLAG | Total packets | Discarded packets |
| A | 0 | 1549 | 1 |
| B | 0 | 1118 | 1 |
| C | 0 | 991 | 1 |
| D | 0 | 2809 | 1 |
| Quadrant | Total seconds | Saturated seconds | Saturation percentage |
|---|---|---|---|
| A | 489 | 15 | 3.067485% |
| B | 489 | 3 | 0.613497% |
| C | 489 | 1 | 0.204499% |
| D | 489 | 79 | 16.155419% |
Noise dominated data is calculated using 1-second bins in cleaned event files. If a bin has >2000 counts, and if more than 50% of those come from <1% of pixels, then it is considered to be noise-dominated and hence unusable.
| Quadrant | # 1 sec bins | Bins with >0 counts | Bins with >2000 counts | High rate bins dominated by noise | Noise dominated (total time) | Noise dominated (detector-on time) | Marked lightcurve |
|---|---|---|---|---|---|---|---|
| A | 489 | 489 | 10 | 10 | 2.04% | 2.04% | 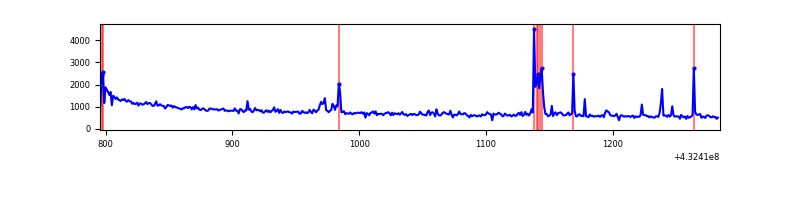 |
| B | 489 | 489 | 1 | 1 | 0.20% | 0.20% | 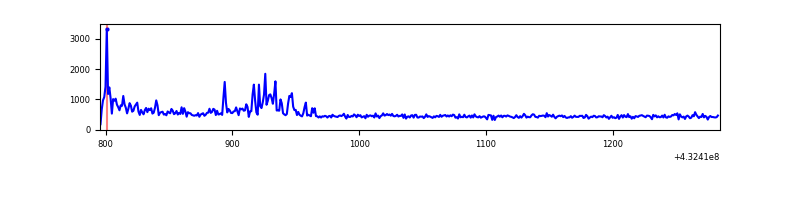 |
| C | 489 | 489 | 0 | 0 | 0.00% | 0.00% | 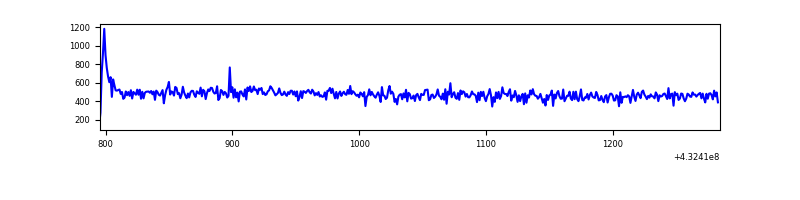 |
| D | 489 | 489 | 139 | 139 | 28.43% | 28.43% | 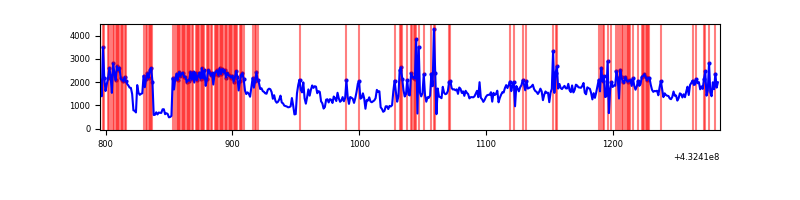 |
Top three noisy pixels from each quadrant. If the there are fewer than three noisy pixels in the level2.evt file, extra rows are filled as -1
| Pixel properties | Quadrant properties | ||||||
|---|---|---|---|---|---|---|---|
| Quadrant | DetID | PixID | Counts | Sigma | Mean | Median | Sigma |
| A | 10 | 83 | 140913 | 10419.88 | 53 | 52 | 13.5 |
| A | 12 | 189 | 25095 | 1852.5 | 53 | 52 | 13.5 |
| A | 15 | 237 | 17600 | 1298.07 | 53 | 52 | 13.5 |
| B | 5 | 255 | 29306 | 2247.83 | 53 | 52 | 13.0 |
| B | 4 | 171 | 18874 | 1446.25 | 53 | 52 | 13.0 |
| B | 0 | 186 | 2709 | 204.16 | 53 | 52 | 13.0 |
| C | 15 | 214 | 26197 | 1820.51 | 51 | 51 | 14.4 |
| C | 3 | 233 | 3250 | 222.74 | 51 | 51 | 14.4 |
| C | 1 | 16 | 1295 | 86.62 | 51 | 51 | 14.4 |
| D | 2 | 16 | 528368 | 36065.22 | 50 | 48 | 14.6 |
| D | 1 | 52 | 47536 | 3241.72 | 50 | 48 | 14.6 |
| D | 12 | 233 | 38523 | 2626.46 | 50 | 48 | 14.6 |
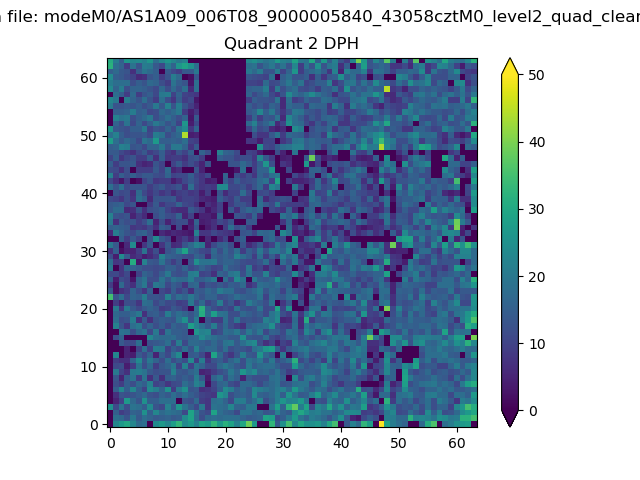
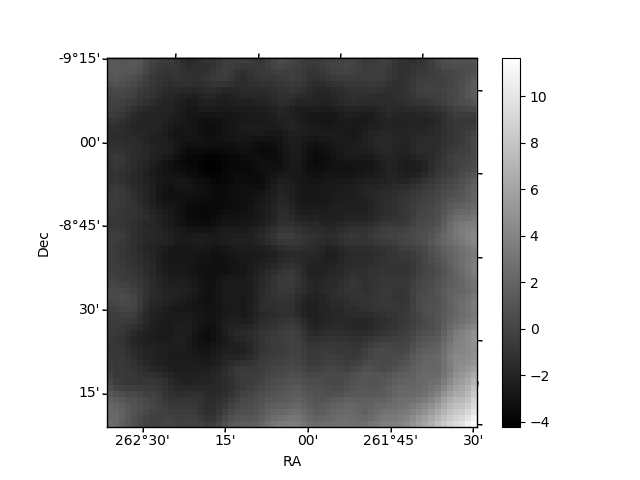
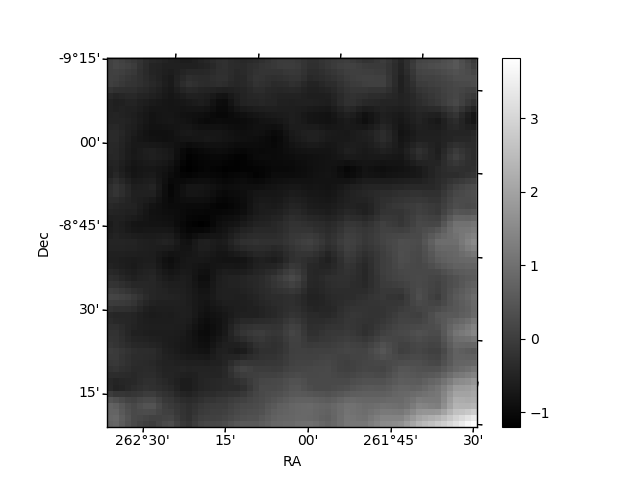
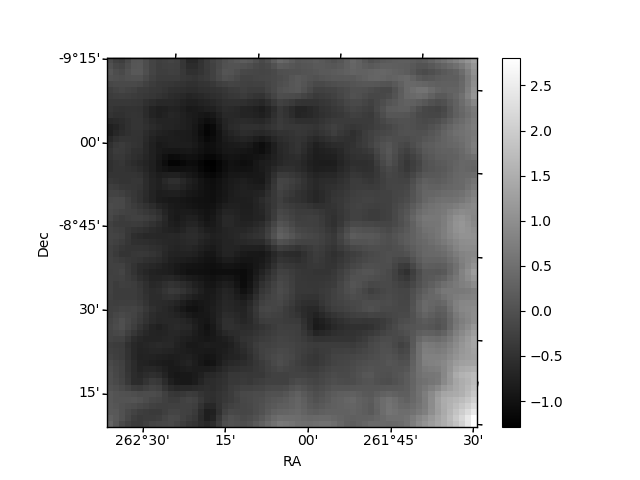
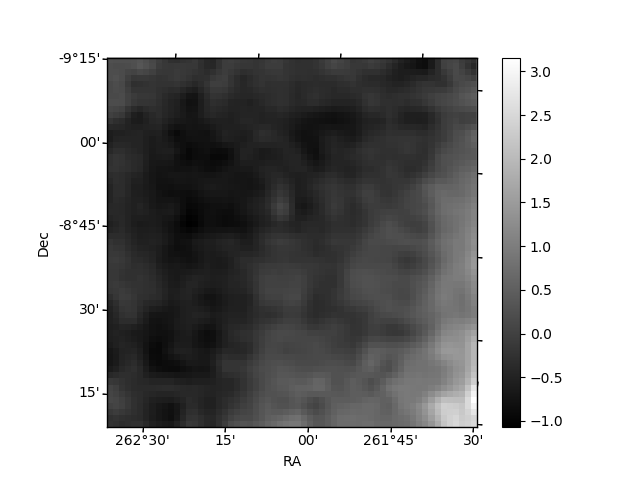
Histogram calculated using DETX and DETY for each event in the final _common_clean file
| Quadrant A | 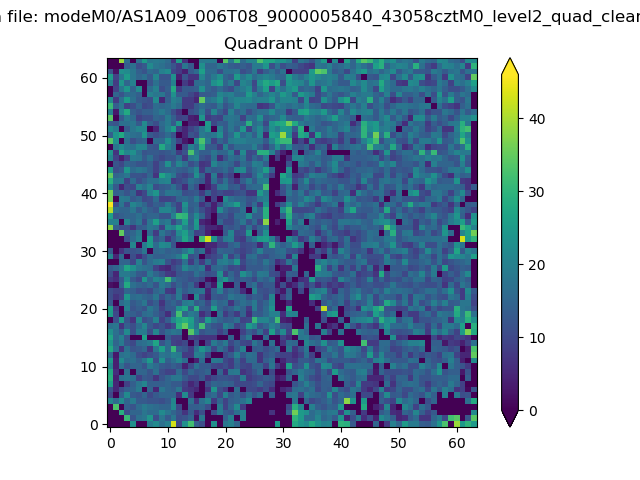 |
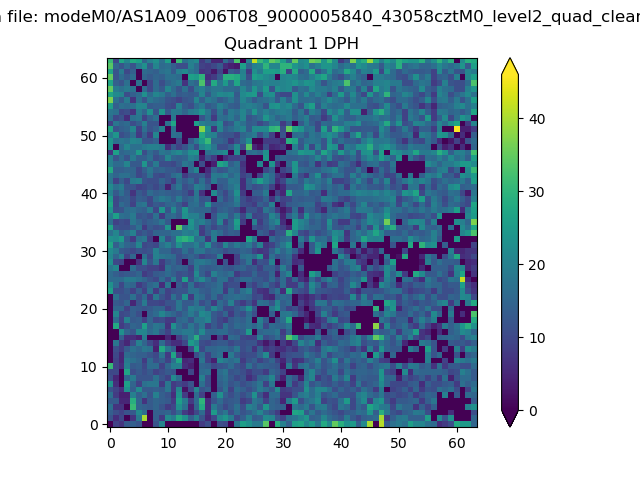 |
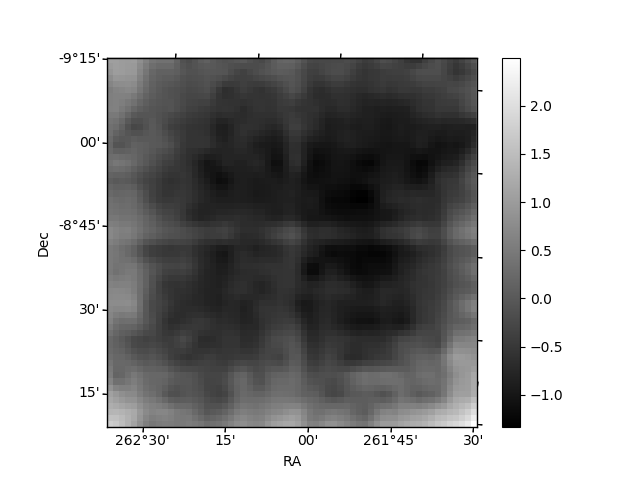
Quadrant B |
|---|---|---|---|
| Quadrant D | 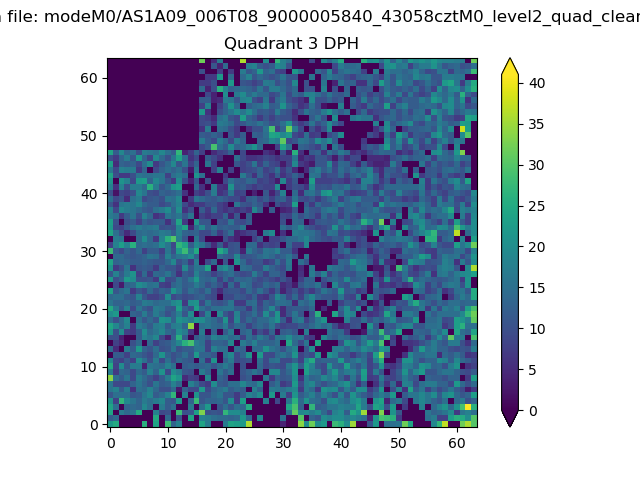 |
 |
Quadrant C |
| Plot type | Count rate plots | Images |
|---|---|---|
| Comparison with Poisson distribution Blue bars denote a histogram of data divided into 1 sec bins. Red curve is a Poisson curve with rate = median count rate of data. |
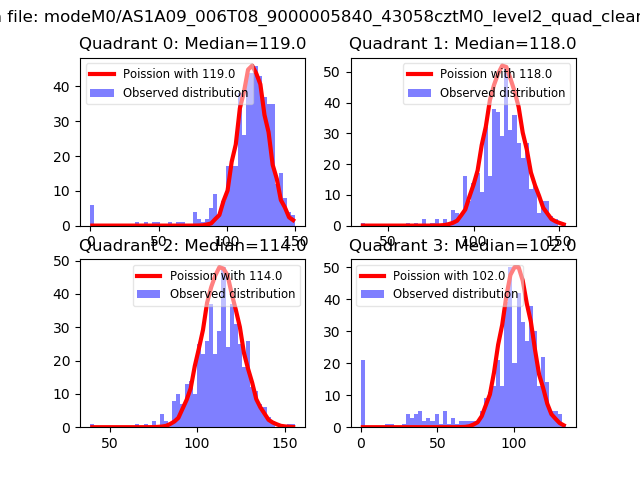 |
 |
| Quadrant-wise count rates Data is divided into 100 sec bins |
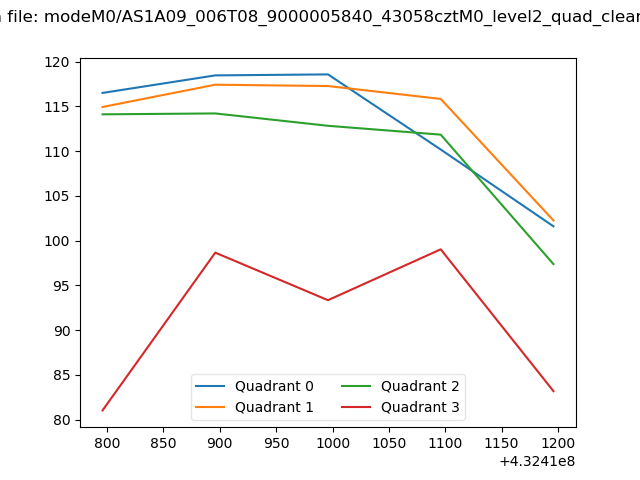 |
|
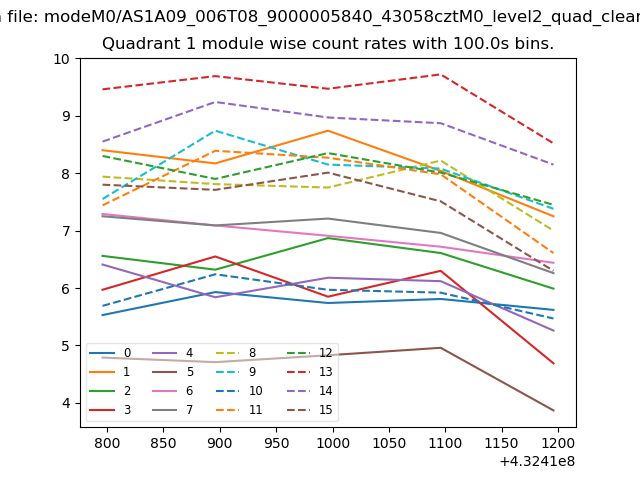
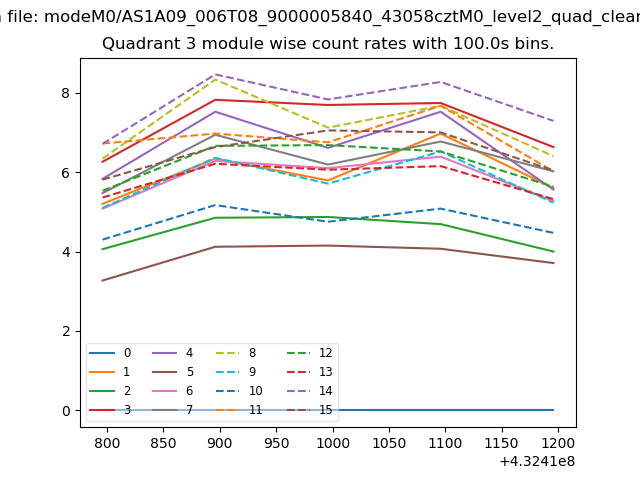
| Module-wise count rates for Quadrant A Data is divided into 100 sec bins |
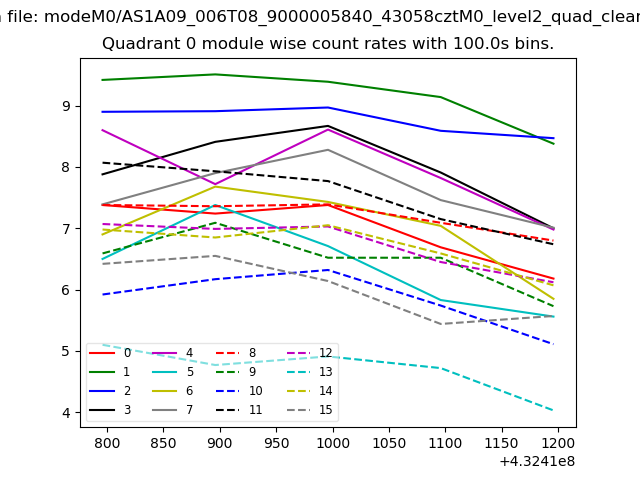 |
 |
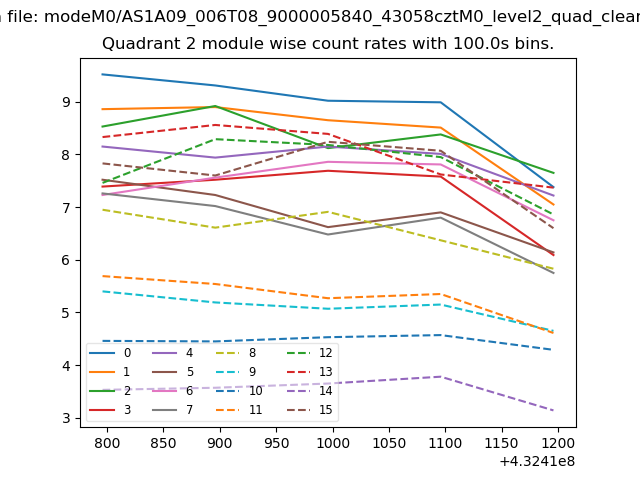
| Module-wise count rates for Quadrant B Data is divided into 100 sec bins |
 |
 |
| Module-wise count rates for Quadrant C Data is divided into 100 sec bins |
 |
 |
| Module-wise count rates for Quadrant D Data is divided into 100 sec bins |
 |
 |
| Parameter | Plot |
|---|---|
| CZT HV Monitor | 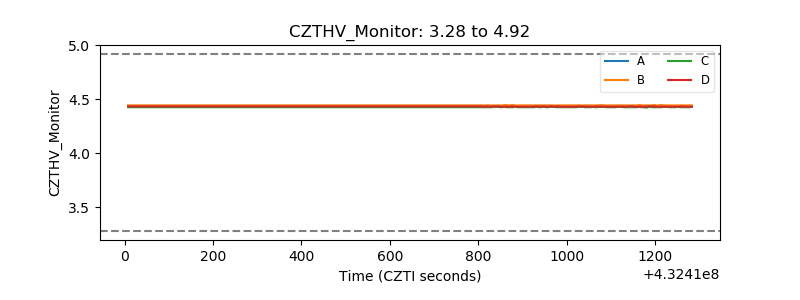 |
| D_VDD | 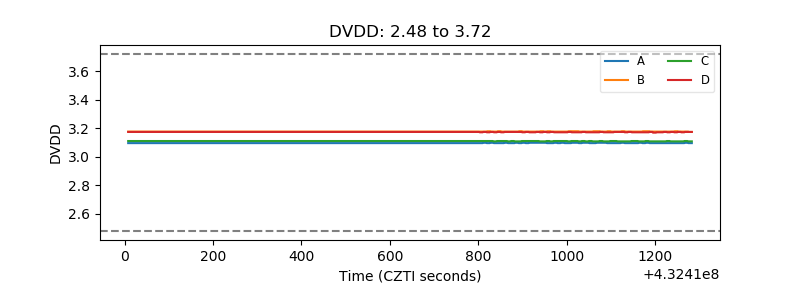 |
| Temperature 1 | 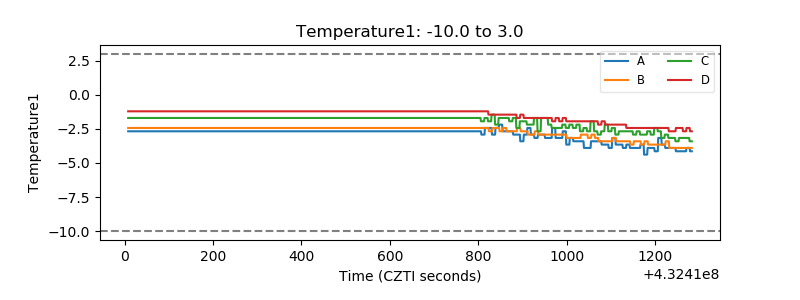 |
| Veto HV Monitor |  |
| Veto LLD | 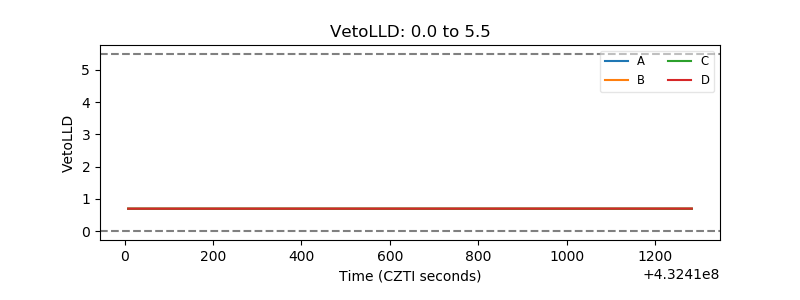 |
| Alpha Counter | 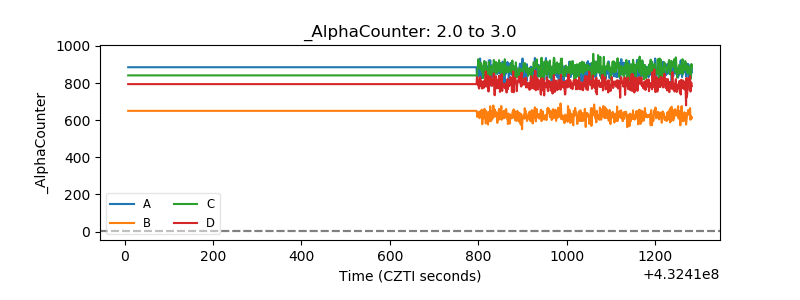 |
| _CPM_Rate | 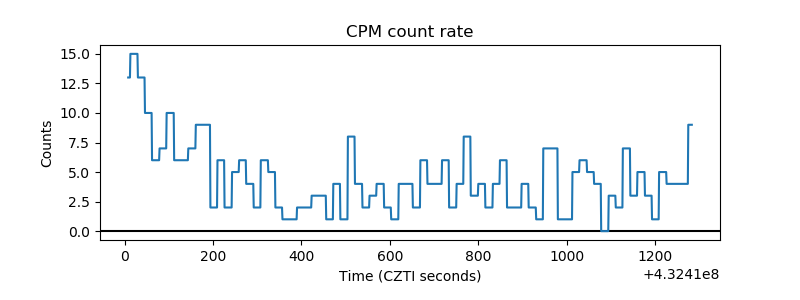 |
| CZT Counter | 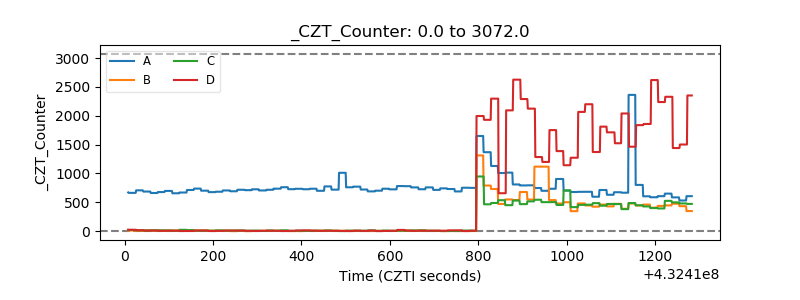 |
| +2.5 Volts monitor | 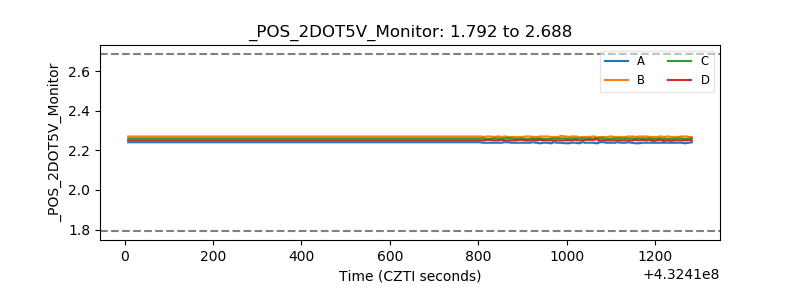 |
| +5 Volts monitor | 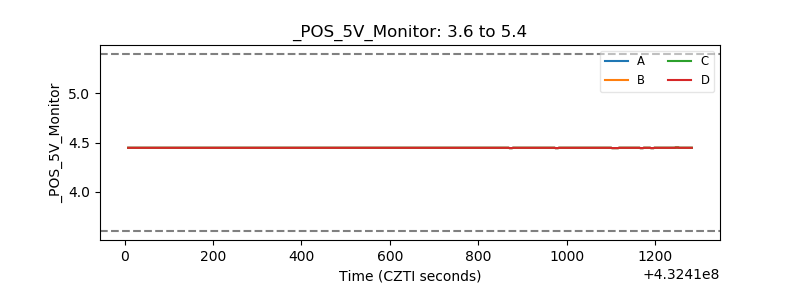 |
| _ROLL_ROT | 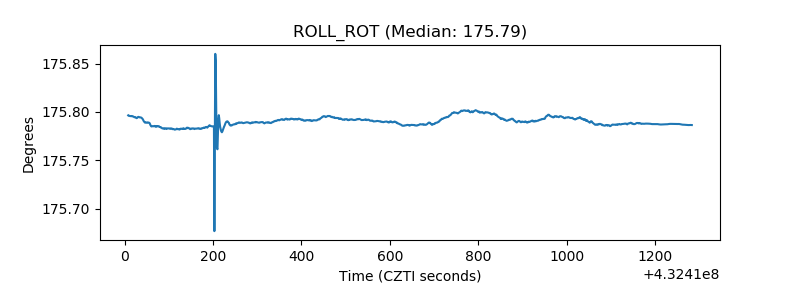 |
| _Roll_DEC | 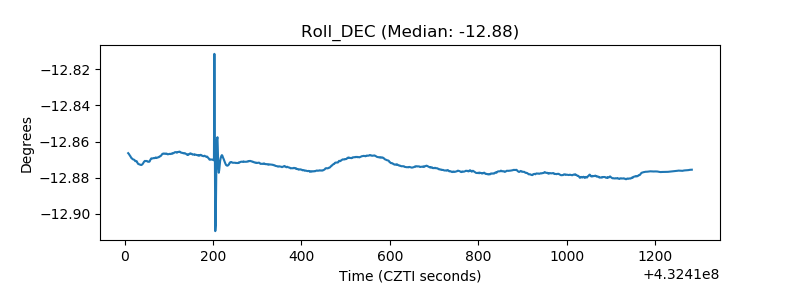 |
| _Roll_RA | 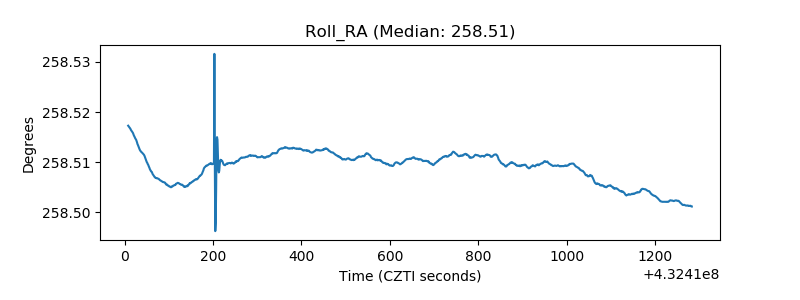 |
| Veto Counter | 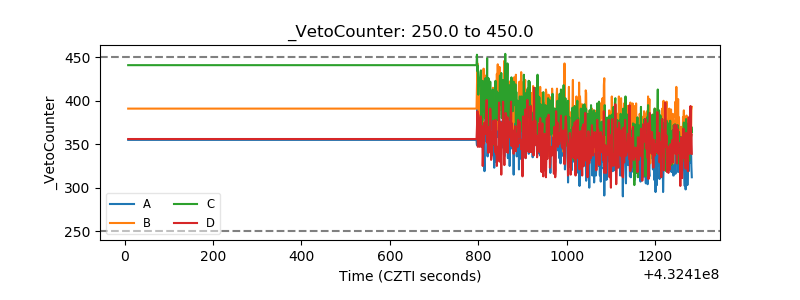 |