| Param | Original file | Final file |
|---|---|---|
| Filename | modeM0/AS1A09_006T09_9000005842_43058cztM0_level2.fits | modeM0/AS1A09_006T09_9000005842_43058cztM0_level2_quad_clean.evt |
| Size (bytes) | 282,358,080 | 73,863,360 |
| Size | 269.3 MB | 70.4 MB |
| Events in quadrant A | 2,453,019 | 491,070 |
| Events in quadrant B | 2,021,386 | 509,068 |
| Events in quadrant C | 2,094,374 | 491,385 |
| Events in quadrant D | 3,532,471 | 429,541 |
| Mode SS | |||
|---|---|---|---|
| Quadrant | BADHDUFLAG | Total packets | Discarded packets |
| A | 0 | 90 | 0 |
| B | 0 | 90 | 0 |
| C | 0 | 90 | 0 |
| D | 0 | 90 | 0 |
| Mode M0 | |||
|---|---|---|---|
| Quadrant | BADHDUFLAG | Total packets | Discarded packets |
| A | 0 | 10045 | 1 |
| B | 0 | 9234 | 1 |
| C | 0 | 9112 | 1 |
| D | 0 | 13559 | 2 |
| Mode M9 | |||
|---|---|---|---|
| Quadrant | BADHDUFLAG | Total packets | Discarded packets |
| A | 0 | 15 | 0 |
| B | 0 | 15 | 0 |
| C | 0 | 15 | 0 |
| D | 0 | 15 | 0 |
| Quadrant | Total seconds | Saturated seconds | Saturation percentage |
|---|---|---|---|
| A | 4494 | 26 | 0.578549% |
| B | 4494 | 3 | 0.066756% |
| C | 4494 | 4 | 0.089008% |
| D | 4493 | 292 | 6.498998% |
Noise dominated data is calculated using 1-second bins in cleaned event files. If a bin has >2000 counts, and if more than 50% of those come from <1% of pixels, then it is considered to be noise-dominated and hence unusable.
| Quadrant | # 1 sec bins | Bins with >0 counts | Bins with >2000 counts | High rate bins dominated by noise | Noise dominated (total time) | Noise dominated (detector-on time) | Marked lightcurve |
|---|---|---|---|---|---|---|---|
| A | 5956 | 4495 | 14 | 14 | 0.24% | 0.31% | 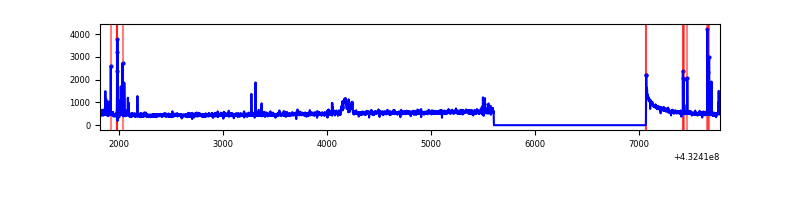 |
| B | 5956 | 4495 | 0 | 0 | 0.00% | 0.00% | 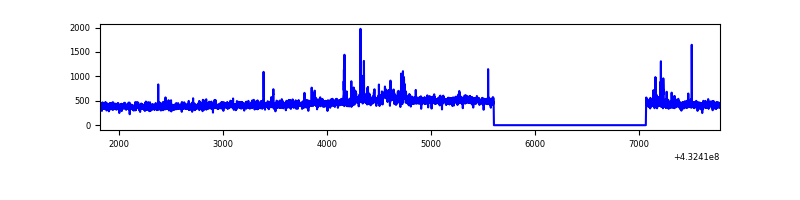 |
| C | 5956 | 4495 | 0 | 0 | 0.00% | 0.00% | 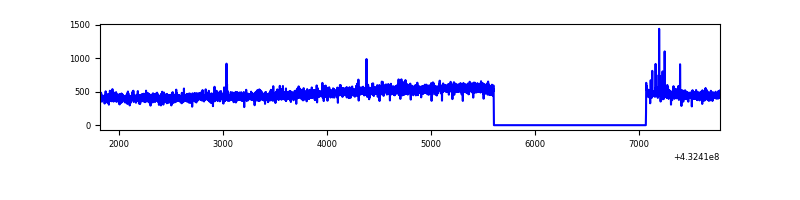 |
| D | 5955 | 4494 | 205 | 205 | 3.44% | 4.56% | 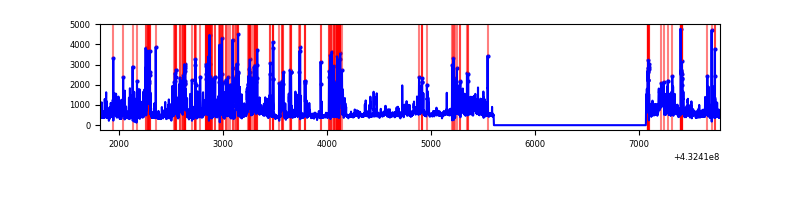 |
Top three noisy pixels from each quadrant. If the there are fewer than three noisy pixels in the level2.evt file, extra rows are filled as -1
| Pixel properties | Quadrant properties | ||||||
|---|---|---|---|---|---|---|---|
| Quadrant | DetID | PixID | Counts | Sigma | Mean | Median | Sigma |
| A | 10 | 83 | 408499 | 4027.88 | 486 | 476 | 101.3 |
| A | 12 | 189 | 80140 | 786.42 | 486 | 476 | 101.3 |
| A | 15 | 237 | 77112 | 756.53 | 486 | 476 | 101.3 |
| B | 4 | 171 | 41633 | 429.22 | 489 | 474 | 95.9 |
| B | 3 | 112 | 21596 | 220.26 | 489 | 474 | 95.9 |
| B | 5 | 255 | 13646 | 137.36 | 489 | 474 | 95.9 |
| C | 15 | 214 | 193709 | 1694.22 | 483 | 485 | 114.0 |
| C | 0 | 207 | 7339 | 60.1 | 483 | 485 | 114.0 |
| C | 14 | 254 | 4400 | 34.33 | 483 | 485 | 114.0 |
| D | 1 | 52 | 1163974 | 10102.01 | 464 | 450 | 115.2 |
| D | 13 | 171 | 235737 | 2042.82 | 464 | 450 | 115.2 |
| D | 12 | 6 | 117474 | 1016.03 | 464 | 450 | 115.2 |
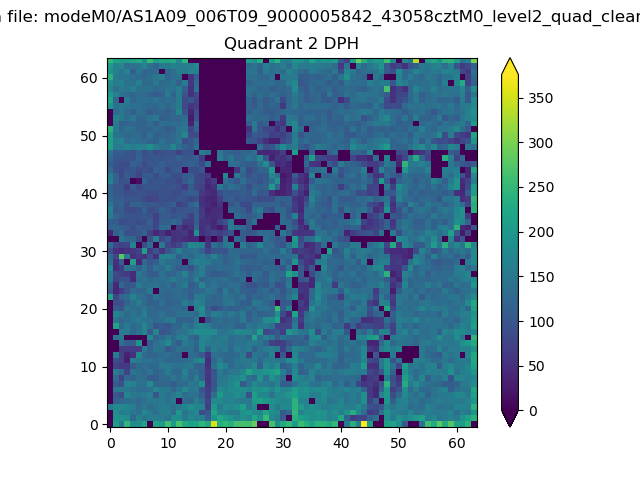
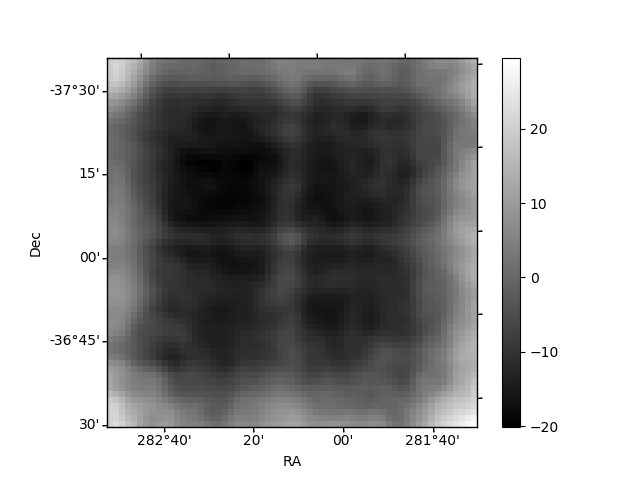
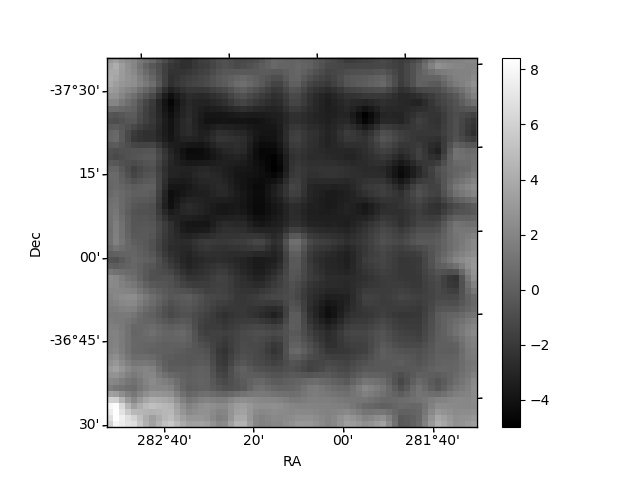
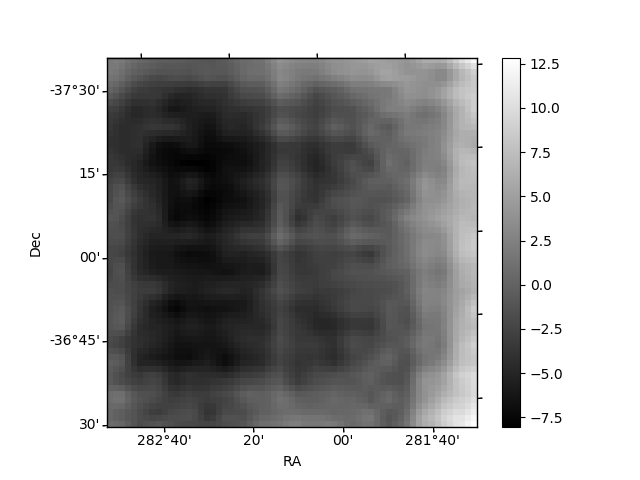
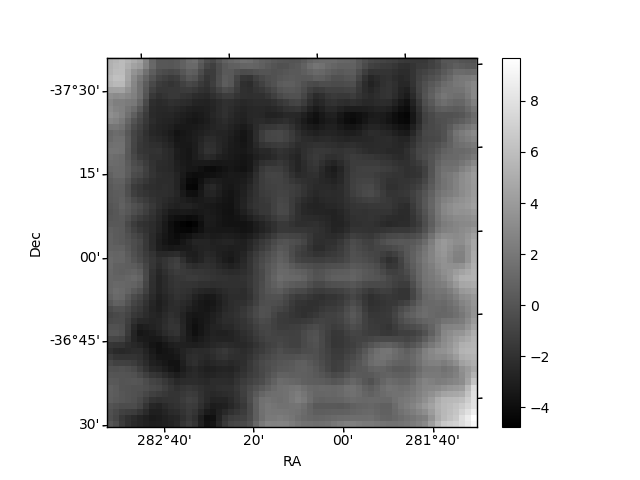
Histogram calculated using DETX and DETY for each event in the final _common_clean file
| Quadrant A | 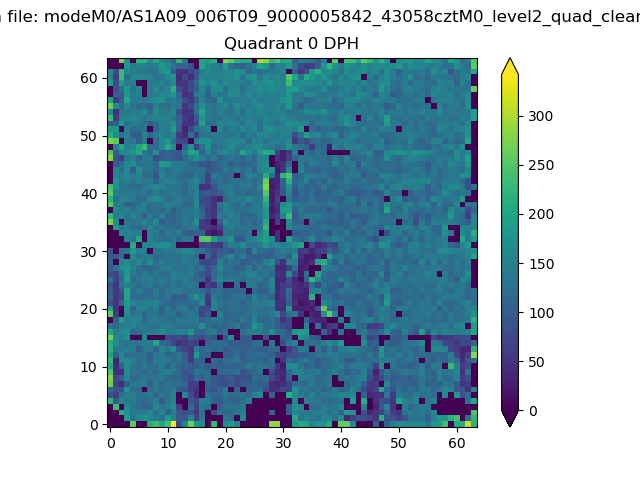 |
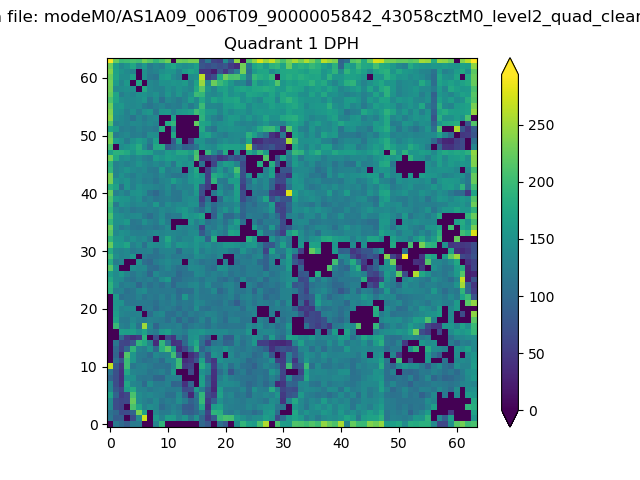 |
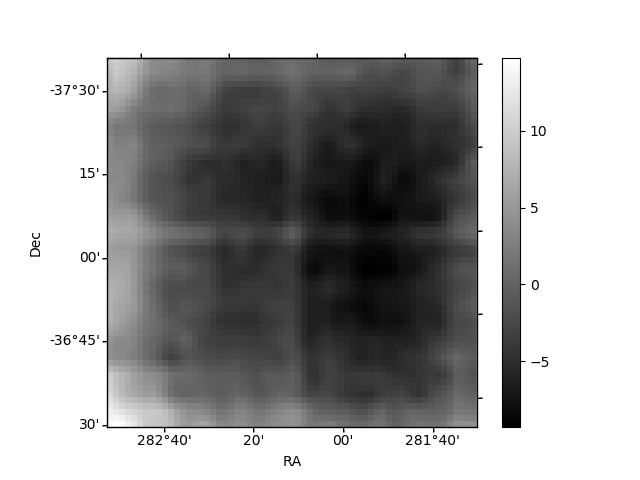
Quadrant B |
|---|---|---|---|
| Quadrant D | 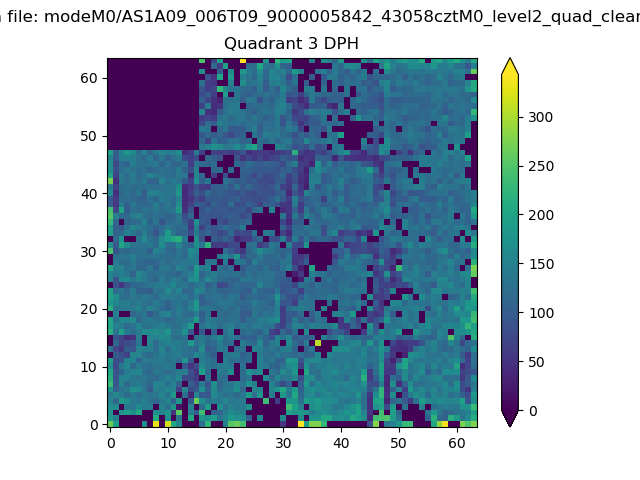 |
 |
Quadrant C |
| Plot type | Count rate plots | Images |
|---|---|---|
| Comparison with Poisson distribution Blue bars denote a histogram of data divided into 1 sec bins. Red curve is a Poisson curve with rate = median count rate of data. |
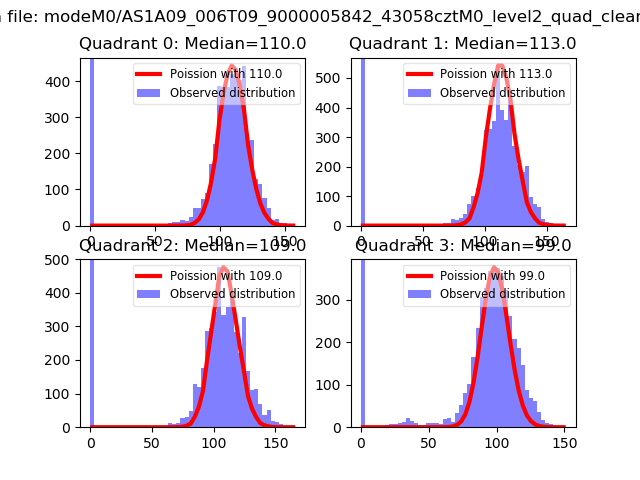 |
 |
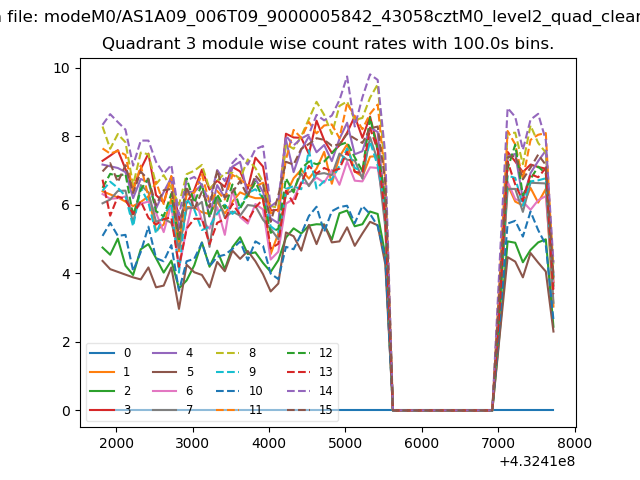
| Quadrant-wise count rates Data is divided into 100 sec bins |
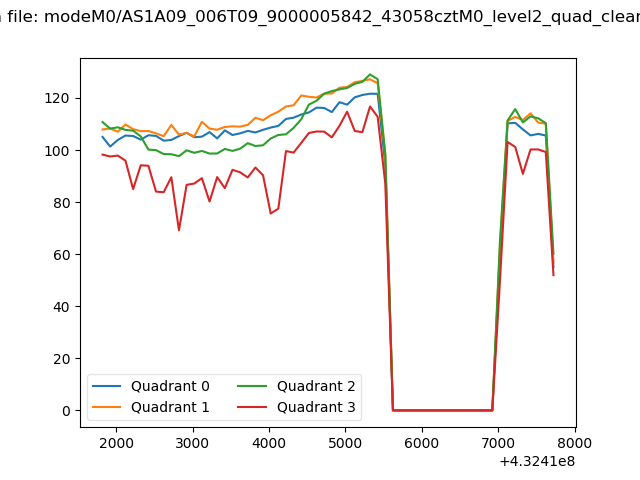 |
|
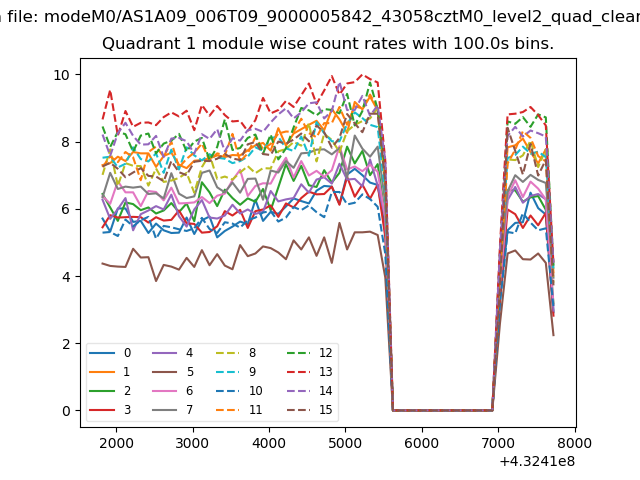
| Module-wise count rates for Quadrant A Data is divided into 100 sec bins |
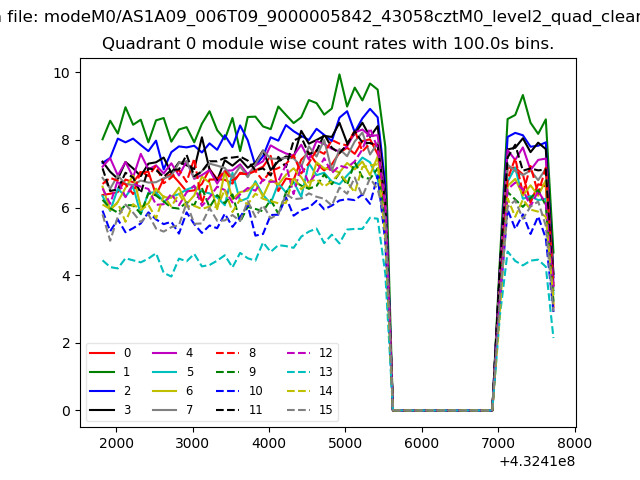 |
 |
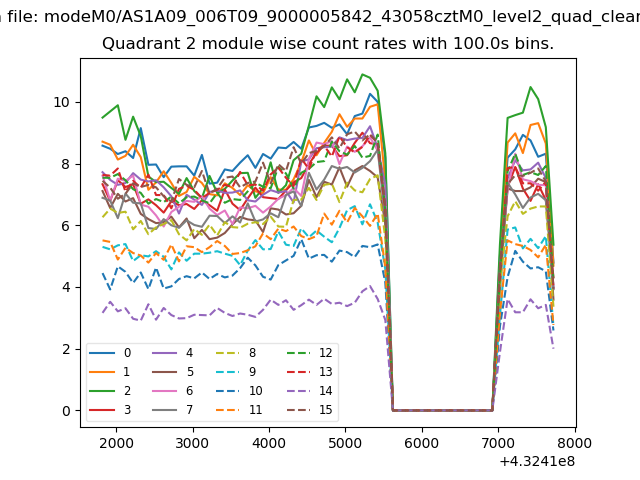
| Module-wise count rates for Quadrant B Data is divided into 100 sec bins |
 |
 |
| Module-wise count rates for Quadrant C Data is divided into 100 sec bins |
 |
 |
| Module-wise count rates for Quadrant D Data is divided into 100 sec bins |
 |
 |
| Parameter | Plot |
|---|---|
| CZT HV Monitor | 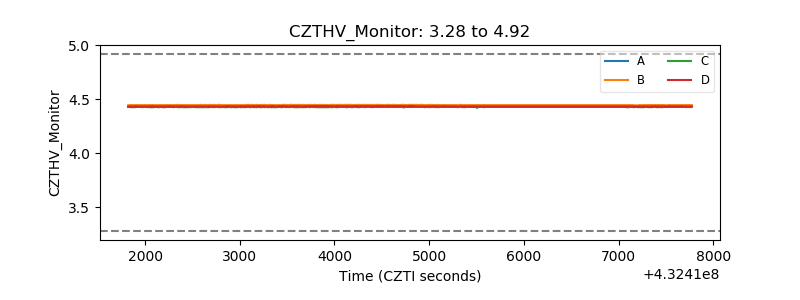 |
| D_VDD | 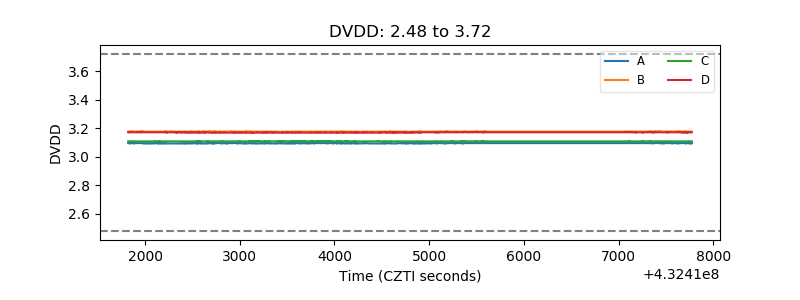 |
| Temperature 1 | 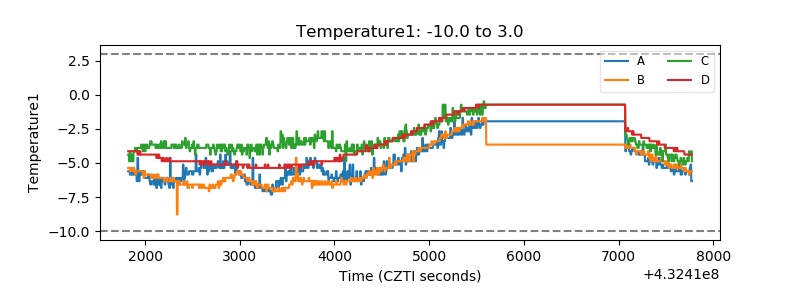 |
| Veto HV Monitor | 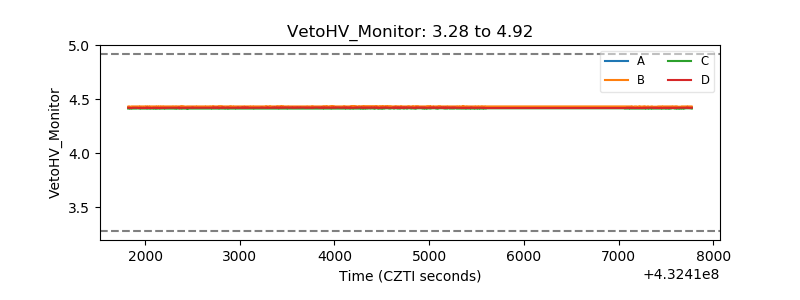 |
| Veto LLD | 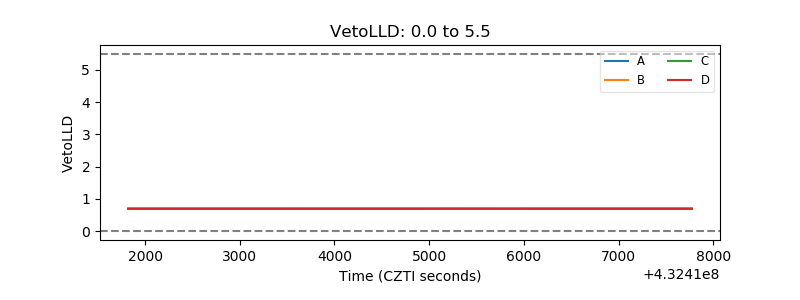 |
| Alpha Counter | 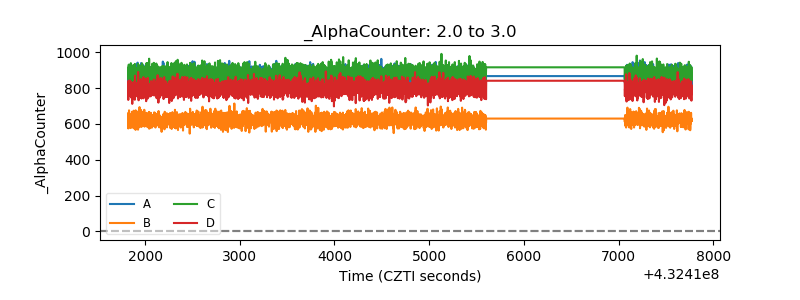 |
| _CPM_Rate | 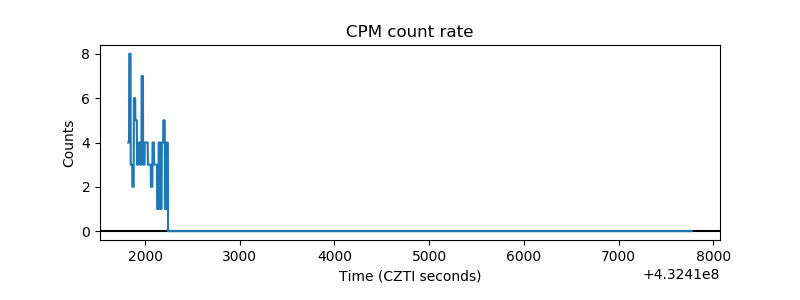 |
| CZT Counter | 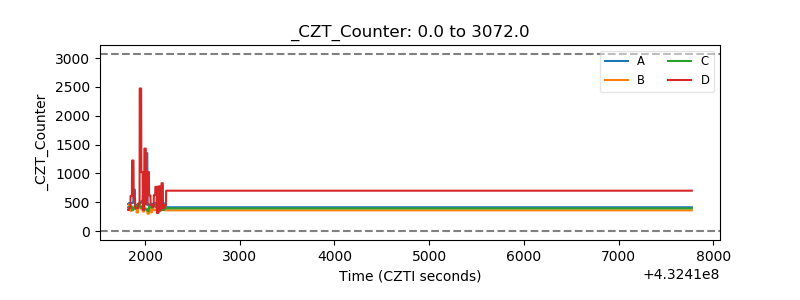 |
| +2.5 Volts monitor | 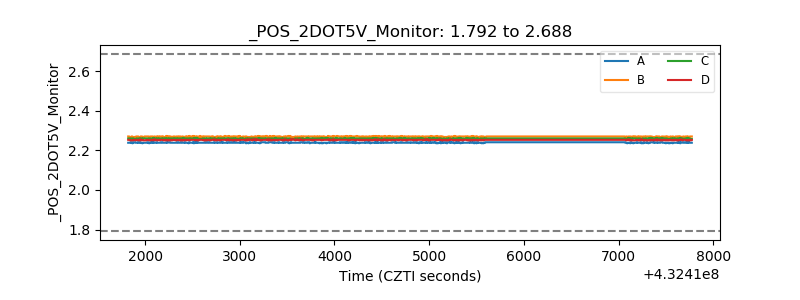 |
| +5 Volts monitor | 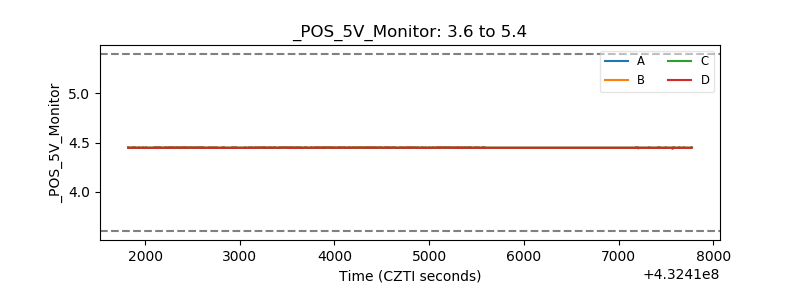 |
| _ROLL_ROT | 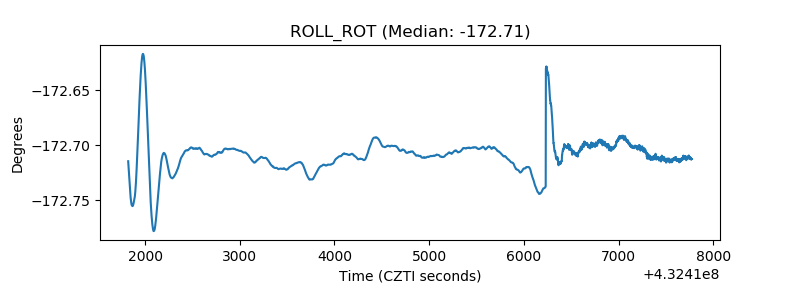 |
| _Roll_DEC | 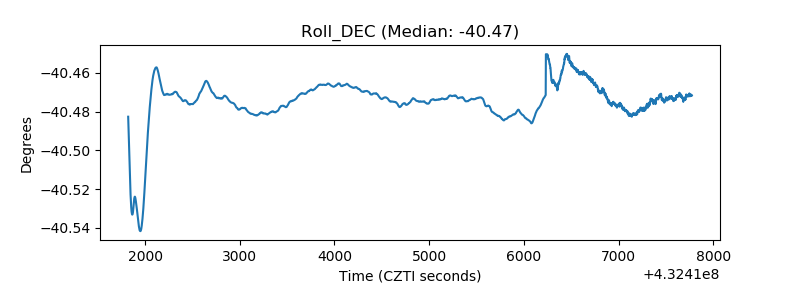 |
| _Roll_RA | 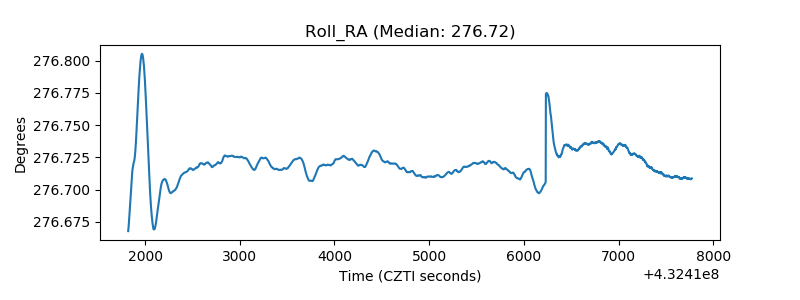 |
| Veto Counter | 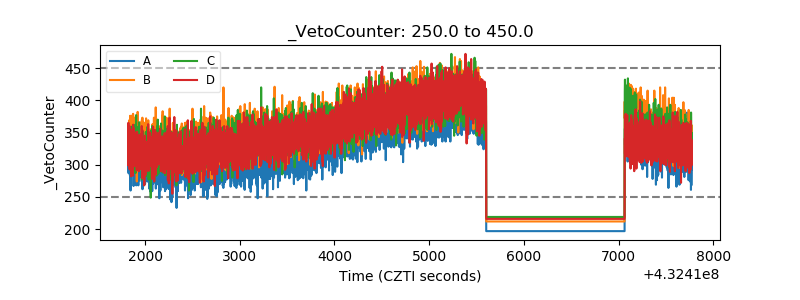 |