| Param | Original file | Final file |
|---|---|---|
| Filename | modeM0/AS1A09_006T09_9000005842_43059cztM0_level2.fits | modeM0/AS1A09_006T09_9000005842_43059cztM0_level2_quad_clean.evt |
| Size (bytes) | 377,573,760 | 95,641,920 |
| Size | 360.1 MB | 91.2 MB |
| Events in quadrant A | 3,522,472 | 633,114 |
| Events in quadrant B | 2,987,359 | 642,442 |
| Events in quadrant C | 2,820,604 | 642,765 |
| Events in quadrant D | 4,188,719 | 566,901 |
| Mode SS | |||
|---|---|---|---|
| Quadrant | BADHDUFLAG | Total packets | Discarded packets |
| A | 0 | 120 | 0 |
| B | 0 | 120 | 0 |
| C | 0 | 120 | 0 |
| D | 0 | 120 | 0 |
| Mode M0 | |||
|---|---|---|---|
| Quadrant | BADHDUFLAG | Total packets | Discarded packets |
| A | 0 | 14250 | 2 |
| B | 0 | 13180 | 2 |
| C | 0 | 12202 | 3 |
| D | 0 | 16671 | 2 |
| Mode M9 | |||
|---|---|---|---|
| Quadrant | BADHDUFLAG | Total packets | Discarded packets |
| A | 0 | 22 | 0 |
| B | 0 | 23 | 0 |
| C | 0 | 23 | 0 |
| D | 0 | 23 | 0 |
| Quadrant | Total seconds | Saturated seconds | Saturation percentage |
|---|---|---|---|
| A | 5876 | 99 | 1.684820% |
| B | 5876 | 183 | 3.114364% |
| C | 5875 | 12 | 0.204255% |
| D | 5875 | 304 | 5.174468% |
Noise dominated data is calculated using 1-second bins in cleaned event files. If a bin has >2000 counts, and if more than 50% of those come from <1% of pixels, then it is considered to be noise-dominated and hence unusable.
| Quadrant | # 1 sec bins | Bins with >0 counts | Bins with >2000 counts | High rate bins dominated by noise | Noise dominated (total time) | Noise dominated (detector-on time) | Marked lightcurve |
|---|---|---|---|---|---|---|---|
| A | 7188 | 5877 | 61 | 61 | 0.85% | 1.04% | 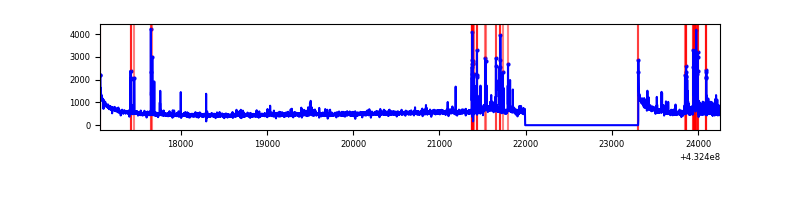 |
| B | 7188 | 5877 | 116 | 116 | 1.61% | 1.97% | 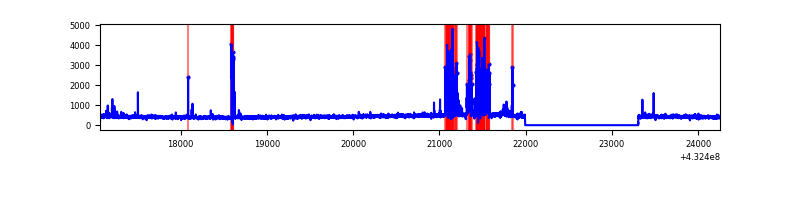 |
| C | 7187 | 5876 | 2 | 2 | 0.03% | 0.03% | 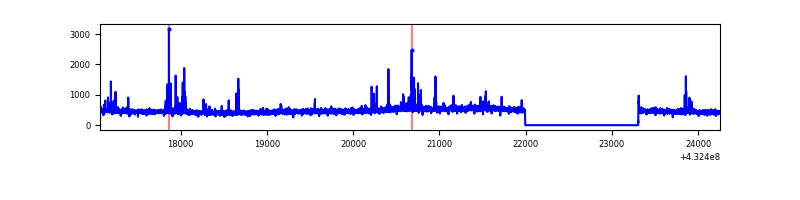 |
| D | 7187 | 5876 | 242 | 242 | 3.37% | 4.12% | 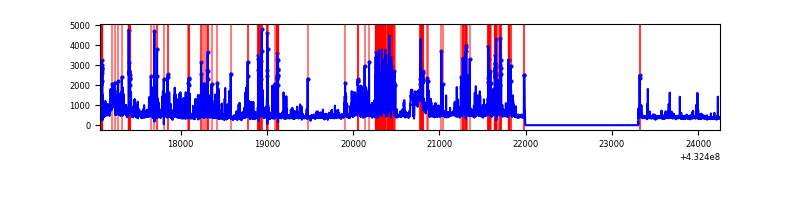 |
Top three noisy pixels from each quadrant. If the there are fewer than three noisy pixels in the level2.evt file, extra rows are filled as -1
| Pixel properties | Quadrant properties | ||||||
|---|---|---|---|---|---|---|---|
| Quadrant | DetID | PixID | Counts | Sigma | Mean | Median | Sigma |
| A | 10 | 83 | 613655 | 4740.57 | 632 | 620 | 129.3 |
| A | 15 | 237 | 340535 | 2628.54 | 632 | 620 | 129.3 |
| A | 12 | 189 | 63816 | 488.69 | 632 | 620 | 129.3 |
| B | 5 | 255 | 414493 | 3419.68 | 624 | 608 | 121.0 |
| B | 0 | 229 | 60659 | 496.17 | 624 | 608 | 121.0 |
| B | 4 | 171 | 33623 | 272.78 | 624 | 608 | 121.0 |
| C | 15 | 214 | 258419 | 1739.98 | 626 | 629 | 148.2 |
| C | 14 | 254 | 99107 | 664.69 | 626 | 629 | 148.2 |
| C | 0 | 207 | 9399 | 59.19 | 626 | 629 | 148.2 |
| D | 1 | 52 | 1315043 | 8786.01 | 608 | 590 | 149.6 |
| D | 13 | 249 | 170722 | 1137.19 | 608 | 590 | 149.6 |
| D | 2 | 16 | 152487 | 1015.3 | 608 | 590 | 149.6 |
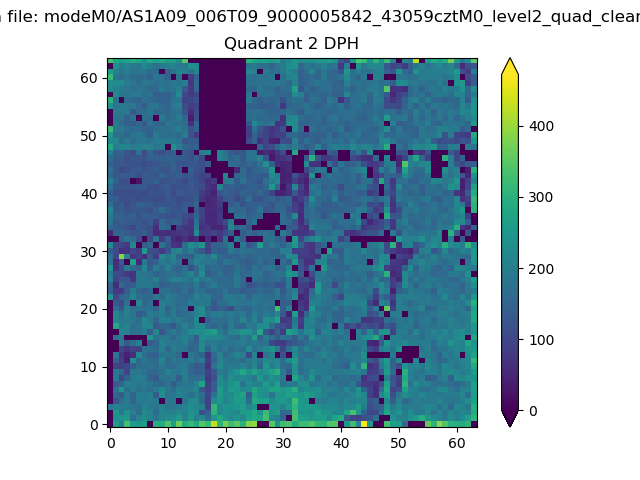
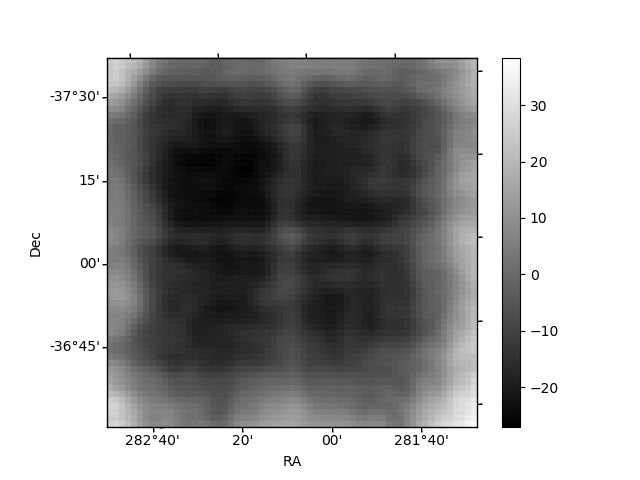
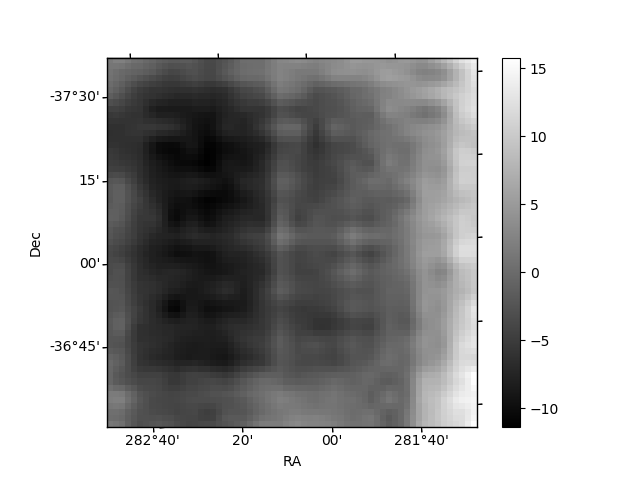
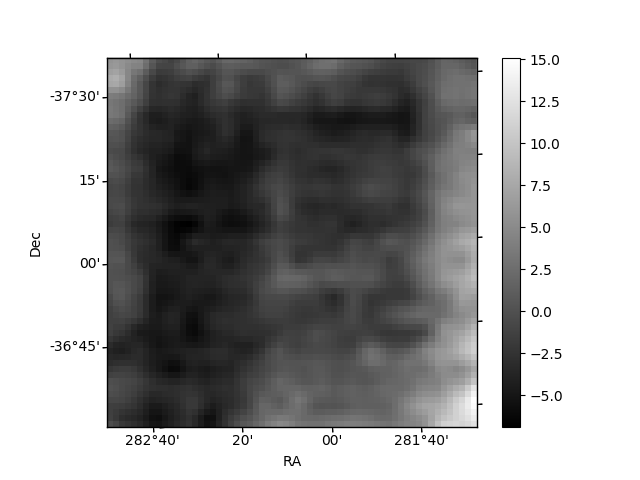
Histogram calculated using DETX and DETY for each event in the final _common_clean file
| Quadrant A | 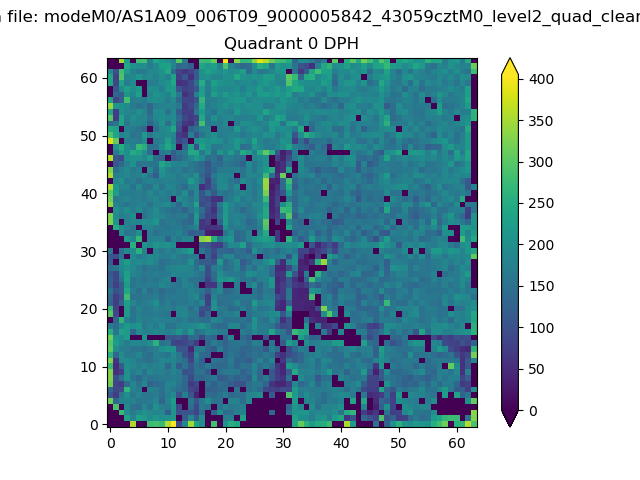 |
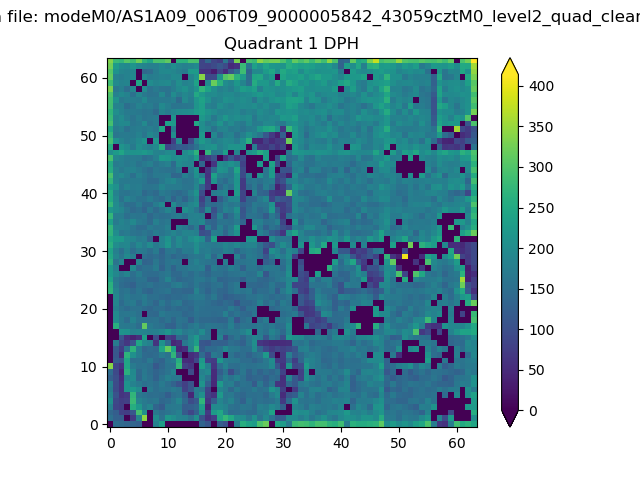 |
Quadrant B |
|---|---|---|---|
| Quadrant D | 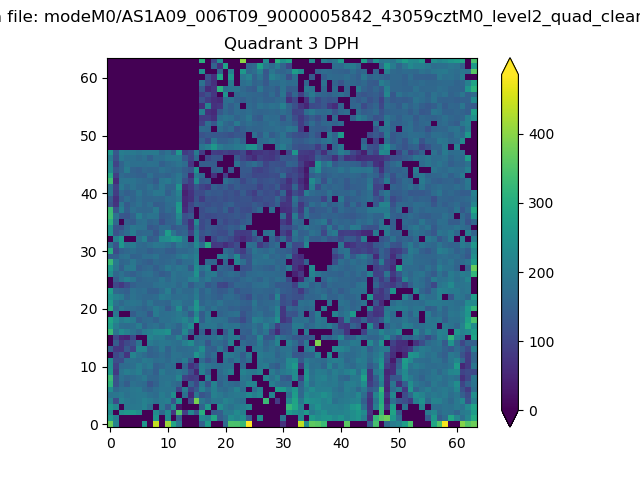 |
 |
Quadrant C |
| Plot type | Count rate plots | Images |
|---|---|---|
| Comparison with Poisson distribution Blue bars denote a histogram of data divided into 1 sec bins. Red curve is a Poisson curve with rate = median count rate of data. |
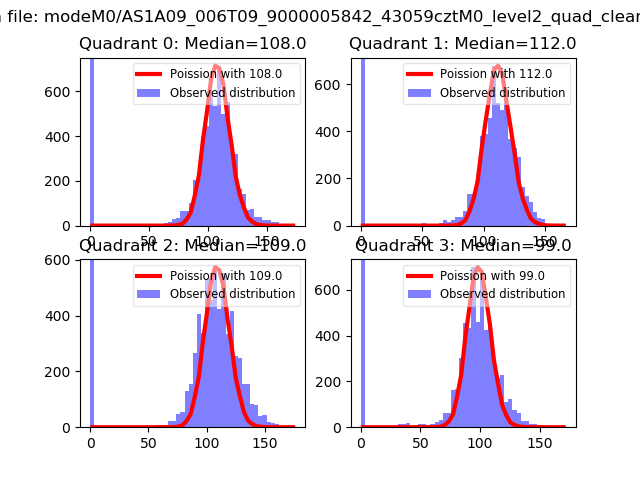 |
 |
| Quadrant-wise count rates Data is divided into 100 sec bins |
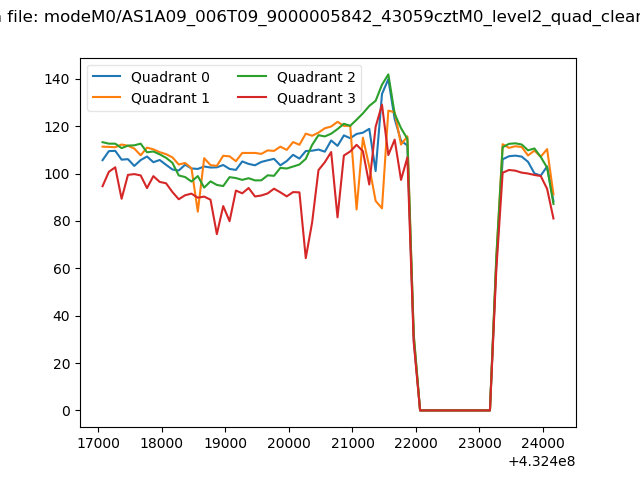 |
|
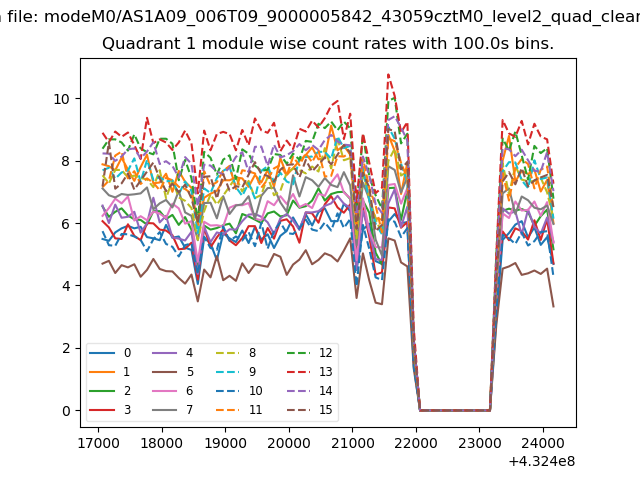
| Module-wise count rates for Quadrant A Data is divided into 100 sec bins |
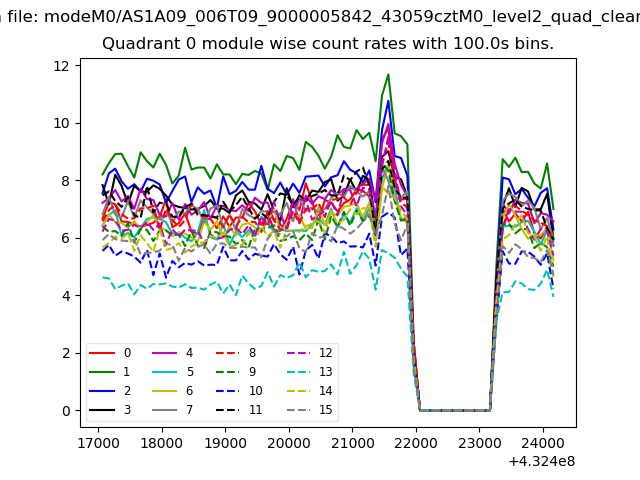 |
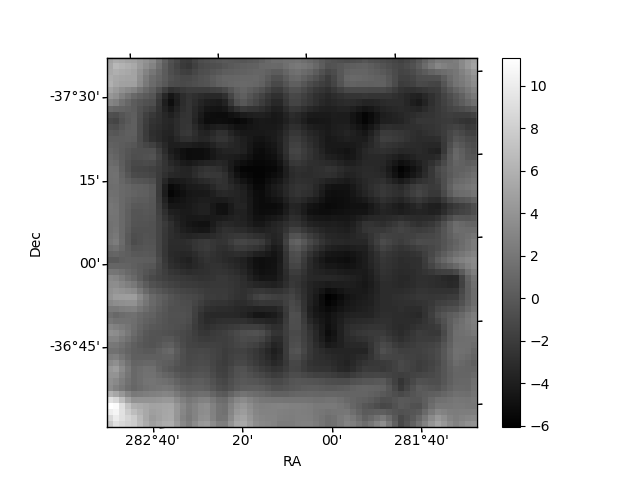 |
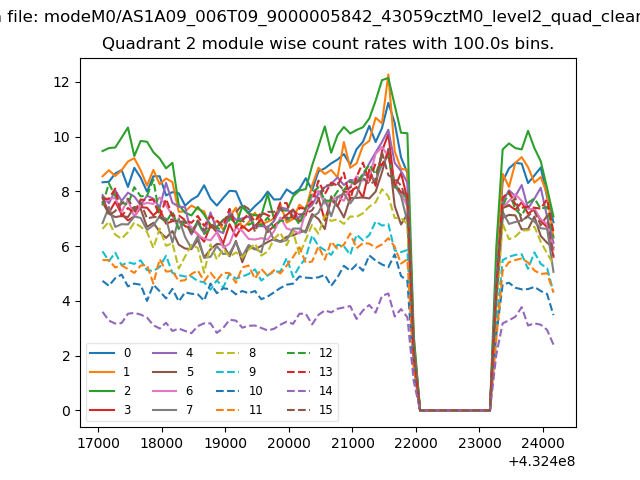
| Module-wise count rates for Quadrant B Data is divided into 100 sec bins |
 |
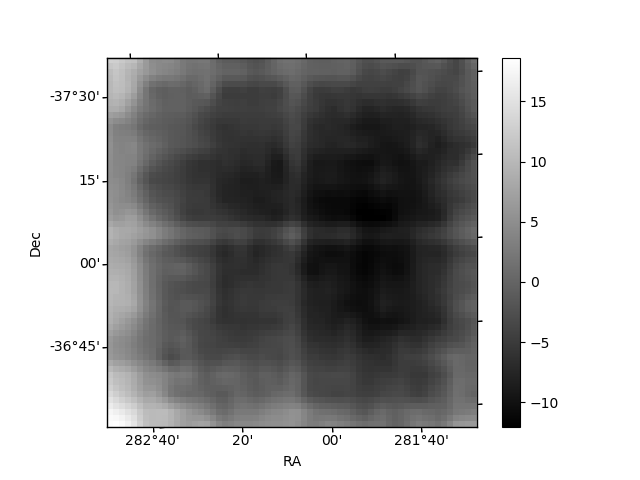 |
| Module-wise count rates for Quadrant C Data is divided into 100 sec bins |
 |
 |
| Module-wise count rates for Quadrant D Data is divided into 100 sec bins |
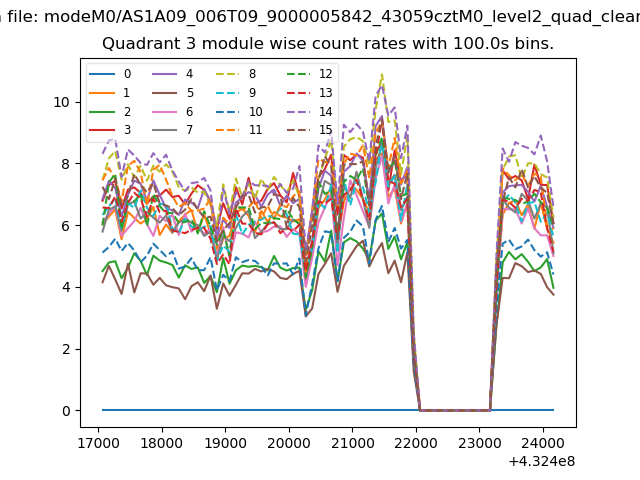 |
 |
| Parameter | Plot |
|---|---|
| CZT HV Monitor | 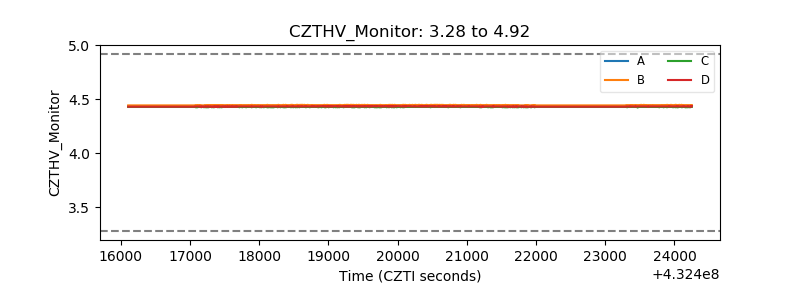 |
| D_VDD |  |
| Temperature 1 | 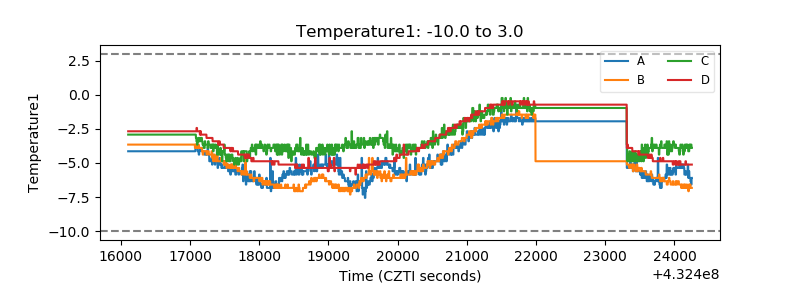 |
| Veto HV Monitor | 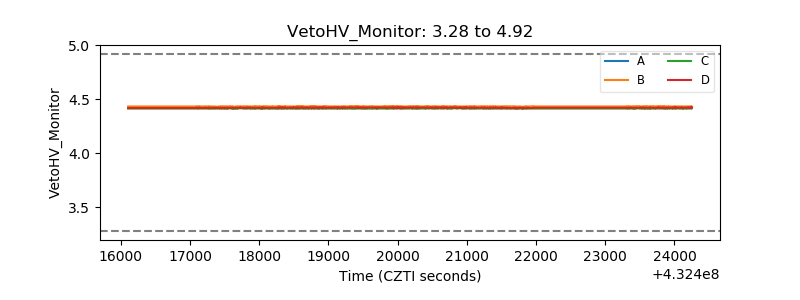 |
| Veto LLD | 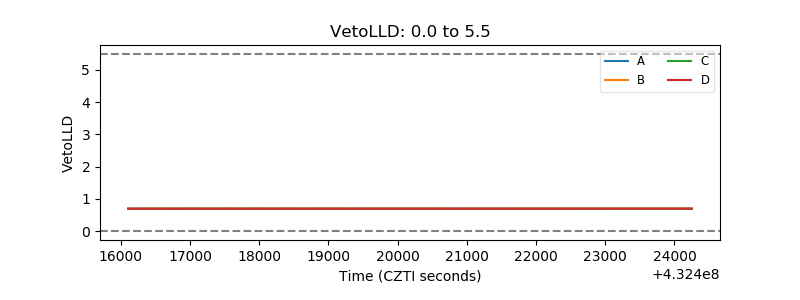 |
| Alpha Counter | 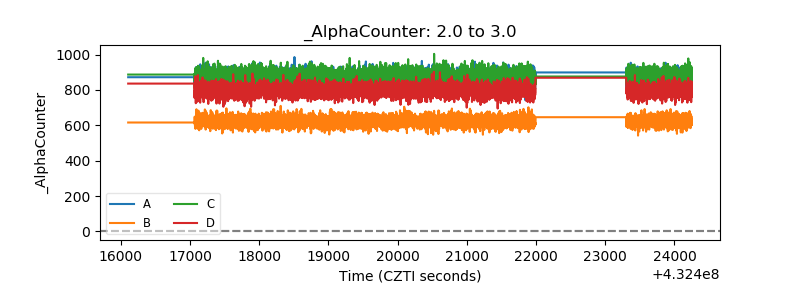 |
| _CPM_Rate | 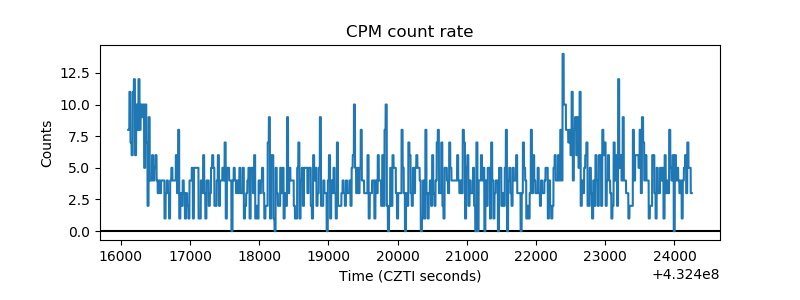 |
| CZT Counter | 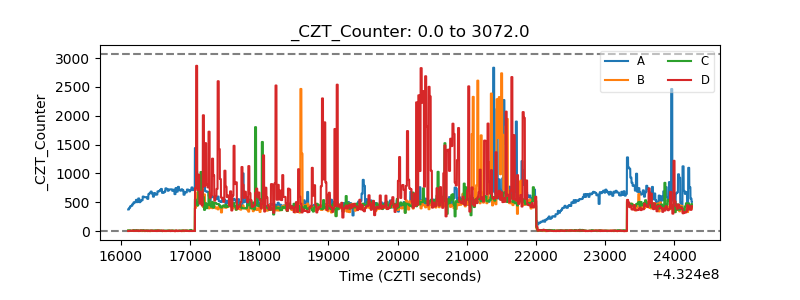 |
| +2.5 Volts monitor | 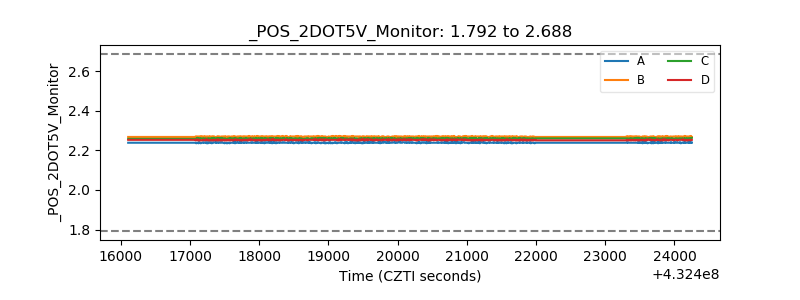 |
| +5 Volts monitor | 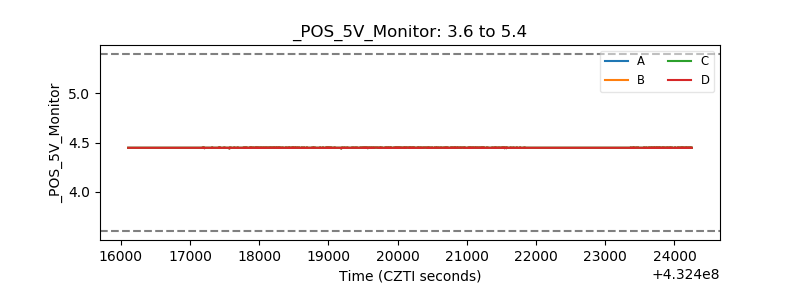 |
| _ROLL_ROT | 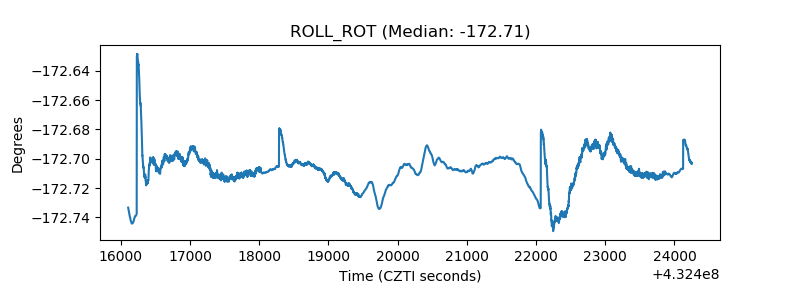 |
| _Roll_DEC | 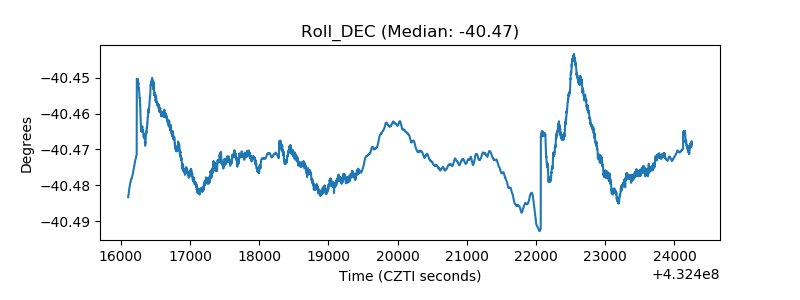 |
| _Roll_RA | 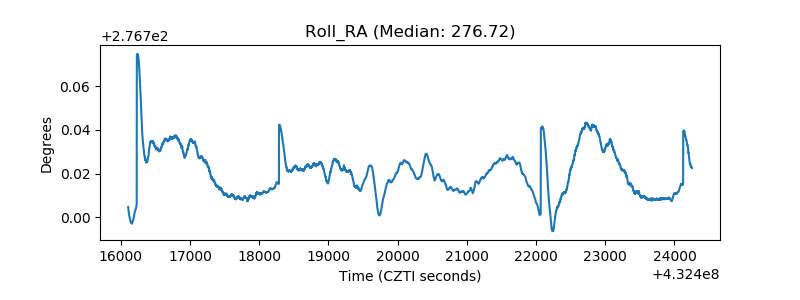 |
| Veto Counter | 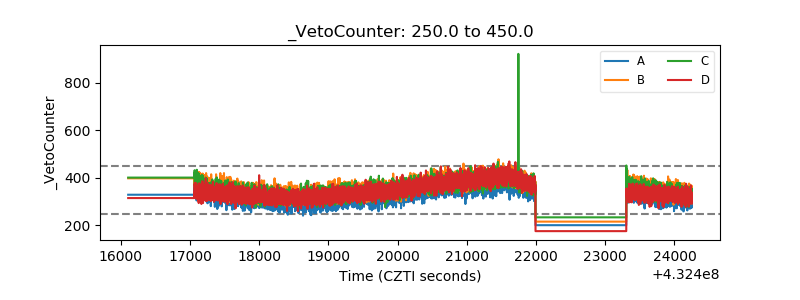 |