| Param | Original file | Final file |
|---|---|---|
| Filename | modeM0/AS1A09_006T09_9000005842_43062cztM0_level2.fits | modeM0/AS1A09_006T09_9000005842_43062cztM0_level2_quad_clean.evt |
| Size (bytes) | 1,108,728,000 | 247,901,760 |
| Size | 1.0 GB | 236.4 MB |
| Events in quadrant A | 9,082,580 | 1,678,092 |
| Events in quadrant B | 8,145,959 | 1,707,438 |
| Events in quadrant C | 7,444,687 | 1,693,694 |
| Events in quadrant D | 15,145,463 | 1,336,291 |
| Mode SS | |||
|---|---|---|---|
| Quadrant | BADHDUFLAG | Total packets | Discarded packets |
| A | 0 | 324 | 0 |
| B | 0 | 324 | 0 |
| C | 0 | 324 | 0 |
| D | 0 | 324 | 0 |
| Mode M0 | |||
|---|---|---|---|
| Quadrant | BADHDUFLAG | Total packets | Discarded packets |
| A | 0 | 36672 | 4 |
| B | 0 | 35580 | 4 |
| C | 0 | 32066 | 4 |
| D | 0 | 56180 | 6 |
| Mode M9 | |||
|---|---|---|---|
| Quadrant | BADHDUFLAG | Total packets | Discarded packets |
| A | 0 | 55 | 0 |
| B | 0 | 55 | 0 |
| C | 0 | 55 | 0 |
| D | 0 | 55 | 0 |
| Quadrant | Total seconds | Saturated seconds | Saturation percentage |
|---|---|---|---|
| A | 15801 | 201 | 1.272071% |
| B | 15801 | 353 | 2.234036% |
| C | 15802 | 11 | 0.069611% |
| D | 15801 | 1866 | 11.809379% |
Noise dominated data is calculated using 1-second bins in cleaned event files. If a bin has >2000 counts, and if more than 50% of those come from <1% of pixels, then it is considered to be noise-dominated and hence unusable.
| Quadrant | # 1 sec bins | Bins with >0 counts | Bins with >2000 counts | High rate bins dominated by noise | Noise dominated (total time) | Noise dominated (detector-on time) | Marked lightcurve |
|---|---|---|---|---|---|---|---|
| A | 21288 | 15805 | 126 | 126 | 0.59% | 0.80% | 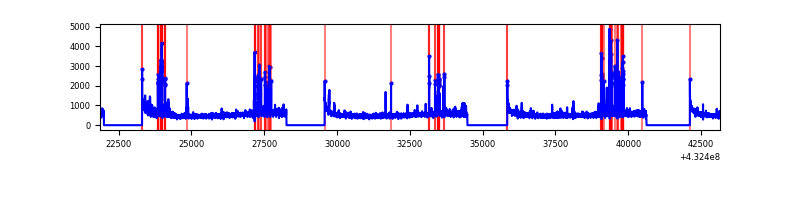 |
| B | 21288 | 15805 | 218 | 218 | 1.02% | 1.38% | 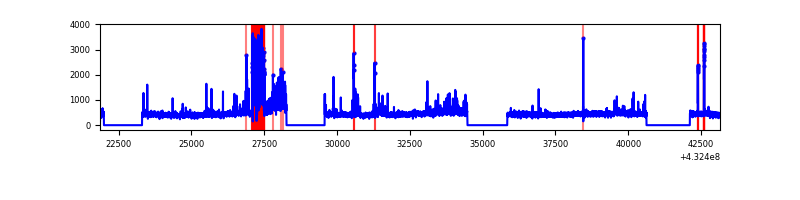 |
| C | 21289 | 15806 | 4 | 4 | 0.02% | 0.03% | 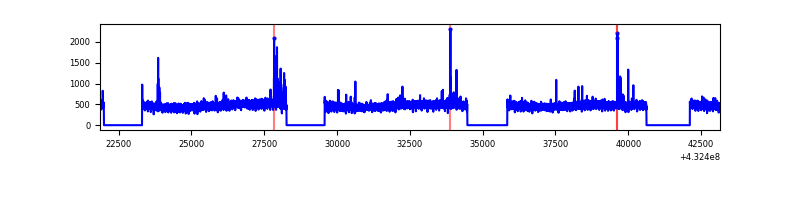 |
| D | 21288 | 15805 | 1725 | 1725 | 8.10% | 10.91% | 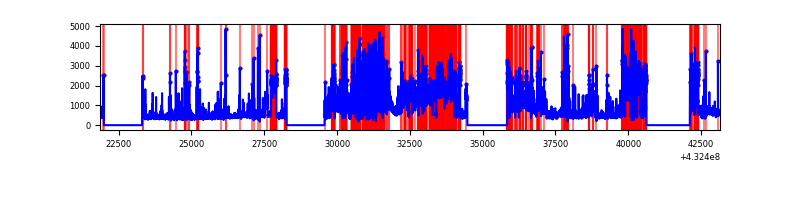 |
Top three noisy pixels from each quadrant. If the there are fewer than three noisy pixels in the level2.evt file, extra rows are filled as -1
| Pixel properties | Quadrant properties | ||||||
|---|---|---|---|---|---|---|---|
| Quadrant | DetID | PixID | Counts | Sigma | Mean | Median | Sigma |
| A | 10 | 83 | 1507398 | 4281.8 | 1714 | 1679 | 351.7 |
| A | 15 | 237 | 578640 | 1640.7 | 1714 | 1679 | 351.7 |
| A | 15 | 222 | 226841 | 640.29 | 1714 | 1679 | 351.7 |
| B | 5 | 255 | 785064 | 2388.45 | 1702 | 1651 | 328.0 |
| B | 0 | 186 | 466827 | 1418.22 | 1702 | 1651 | 328.0 |
| B | 0 | 229 | 112220 | 337.1 | 1702 | 1651 | 328.0 |
| C | 15 | 214 | 693503 | 1749.83 | 1695 | 1706 | 395.4 |
| C | 15 | 111 | 89092 | 221.03 | 1695 | 1706 | 395.4 |
| C | 14 | 254 | 34139 | 82.04 | 1695 | 1706 | 395.4 |
| D | 2 | 16 | 5959200 | 15022.67 | 1621 | 1576 | 396.6 |
| D | 12 | 6 | 1120114 | 2820.49 | 1621 | 1576 | 396.6 |
| D | 1 | 52 | 836405 | 2105.09 | 1621 | 1576 | 396.6 |
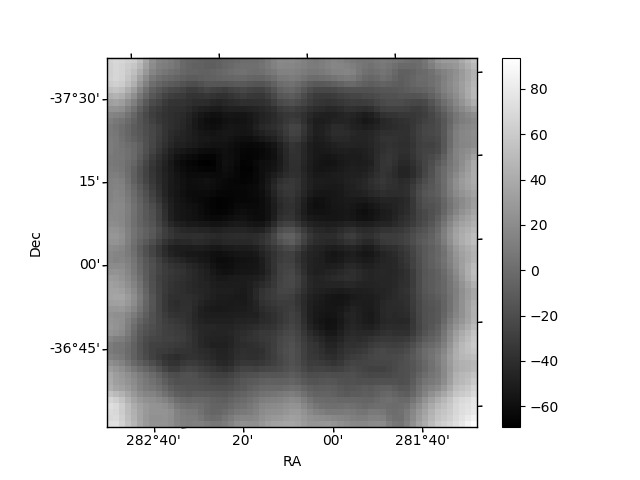
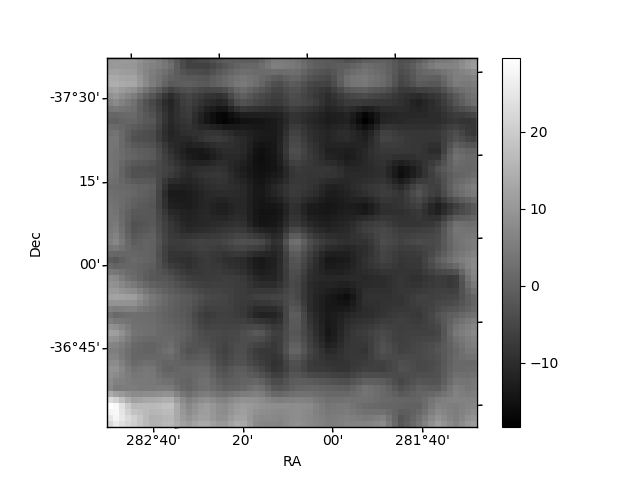
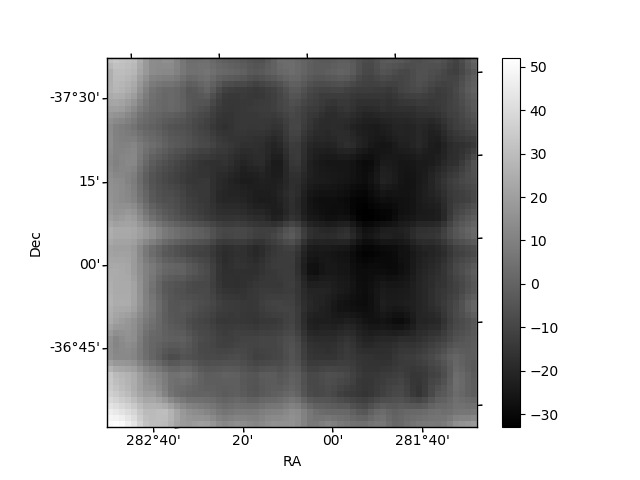
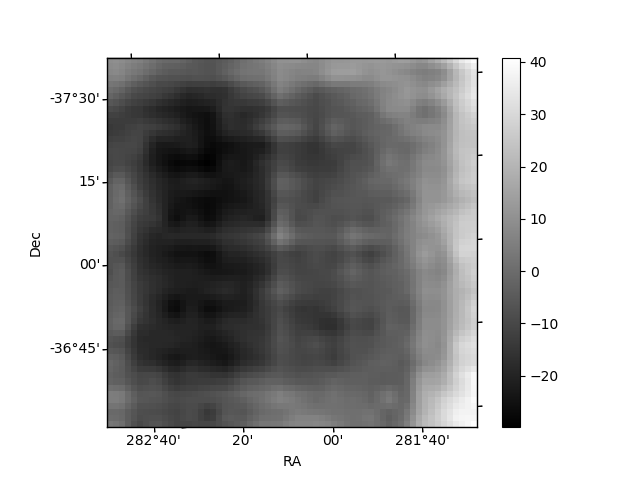
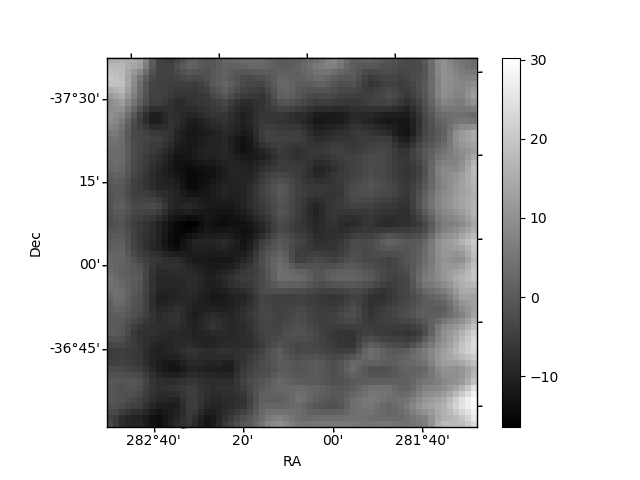
Histogram calculated using DETX and DETY for each event in the final _common_clean file
| Quadrant A | 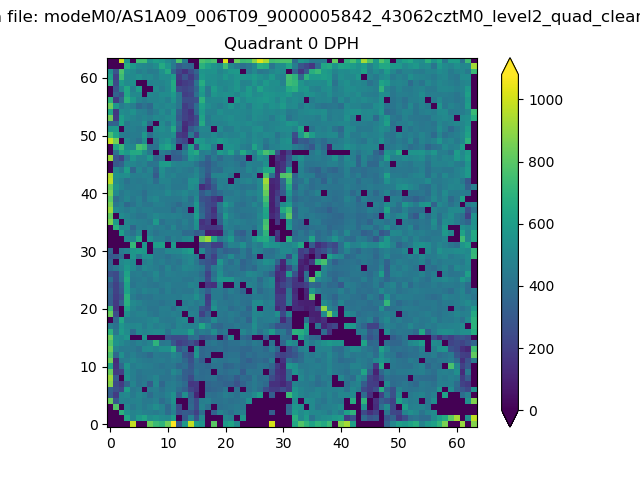 |
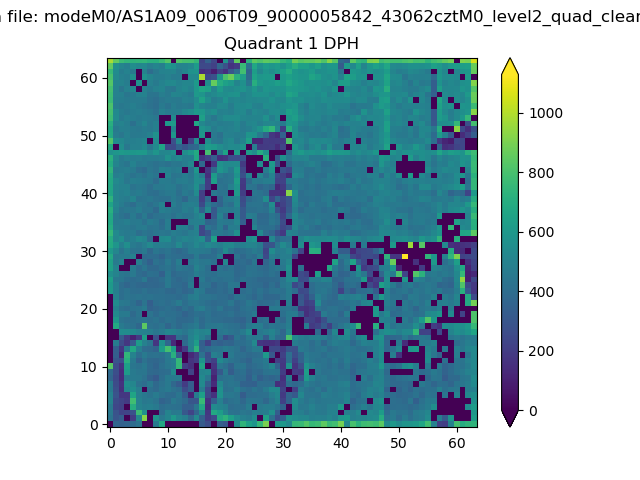 |
Quadrant B |
|---|---|---|---|
| Quadrant D | 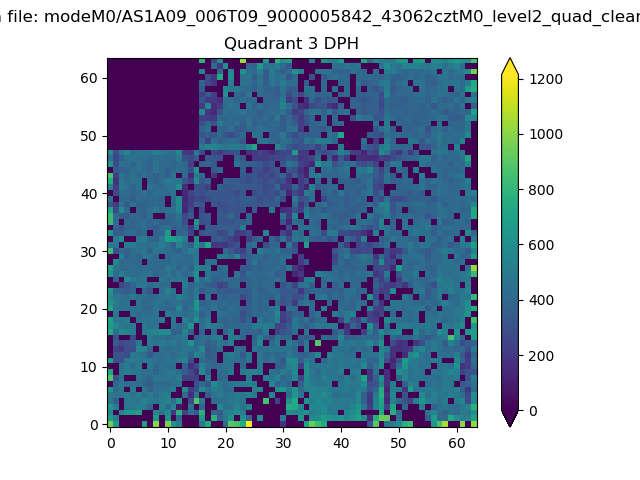 |
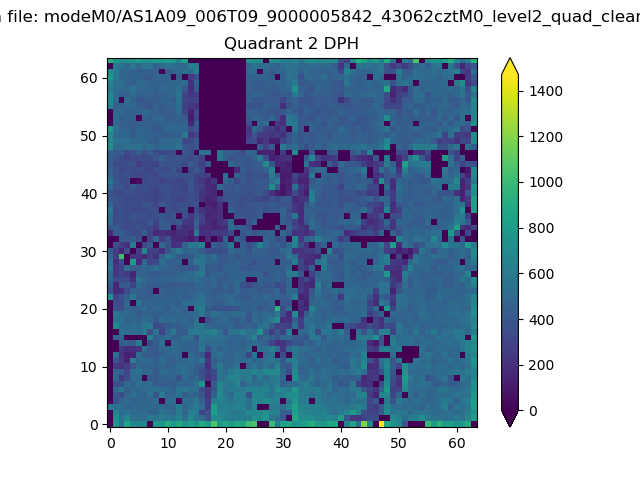 |
Quadrant C |
| Plot type | Count rate plots | Images |
|---|---|---|
| Comparison with Poisson distribution Blue bars denote a histogram of data divided into 1 sec bins. Red curve is a Poisson curve with rate = median count rate of data. |
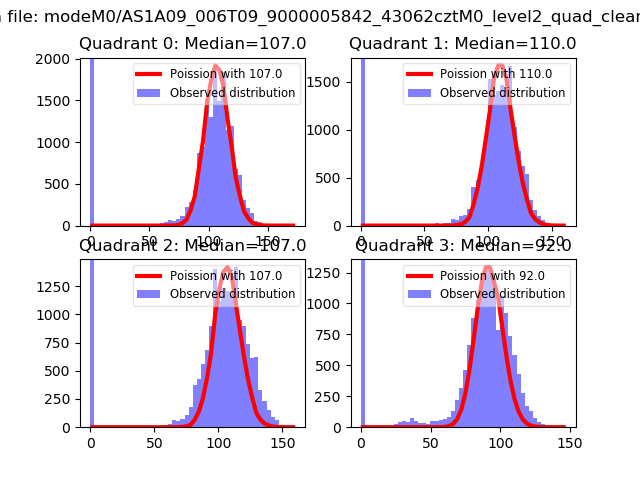 |
 |
| Quadrant-wise count rates Data is divided into 100 sec bins |
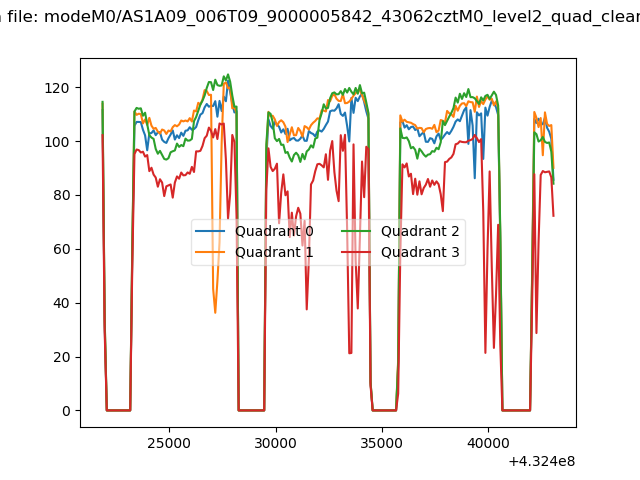 |
|
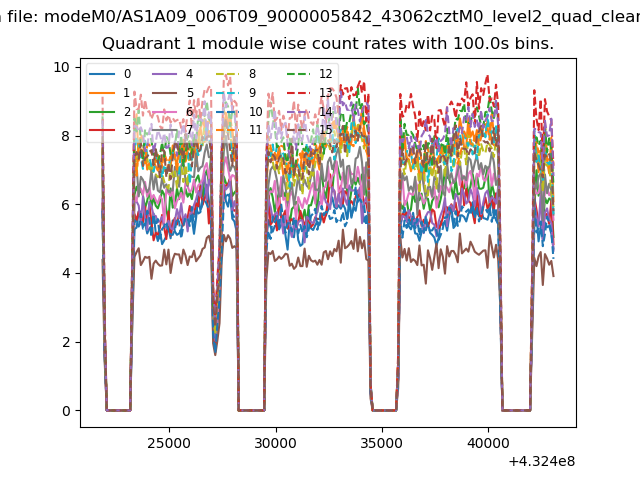
| Module-wise count rates for Quadrant A Data is divided into 100 sec bins |
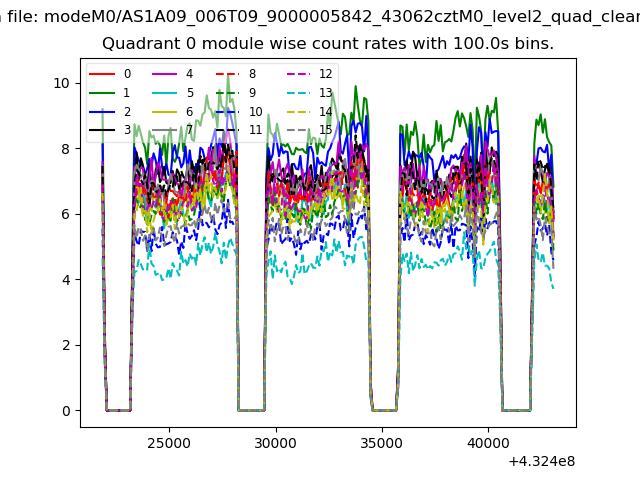 |
 |
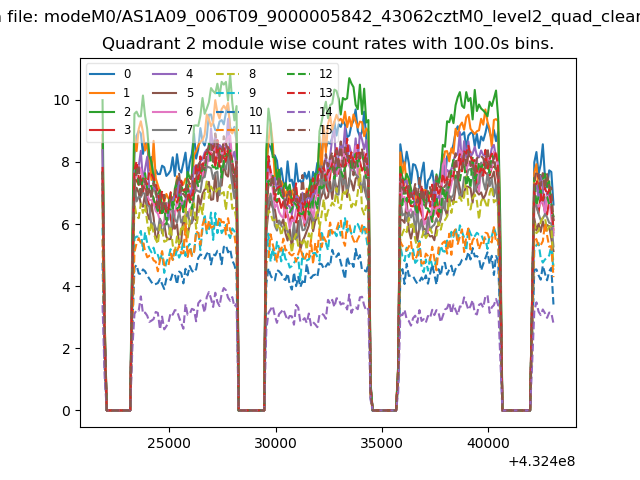
| Module-wise count rates for Quadrant B Data is divided into 100 sec bins |
 |
 |
| Module-wise count rates for Quadrant C Data is divided into 100 sec bins |
 |
 |
| Module-wise count rates for Quadrant D Data is divided into 100 sec bins |
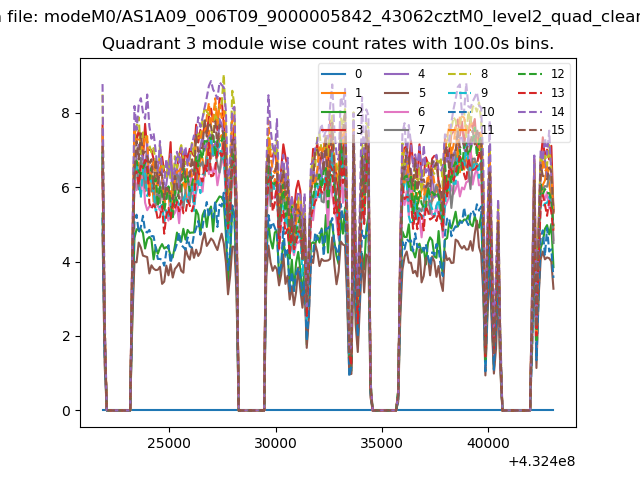 |
 |
| Parameter | Plot |
|---|---|
| CZT HV Monitor | 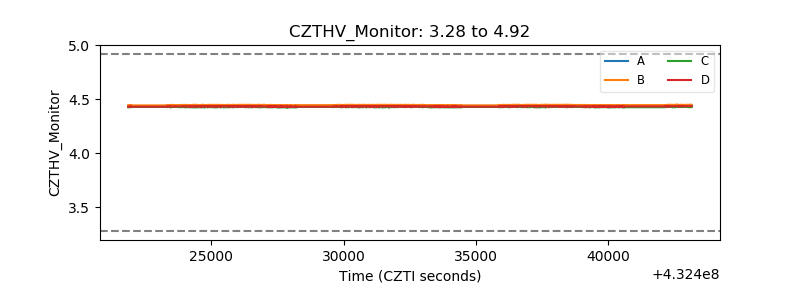 |
| D_VDD | 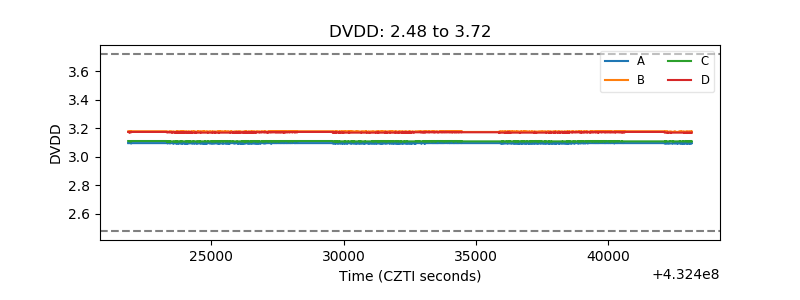 |
| Temperature 1 | 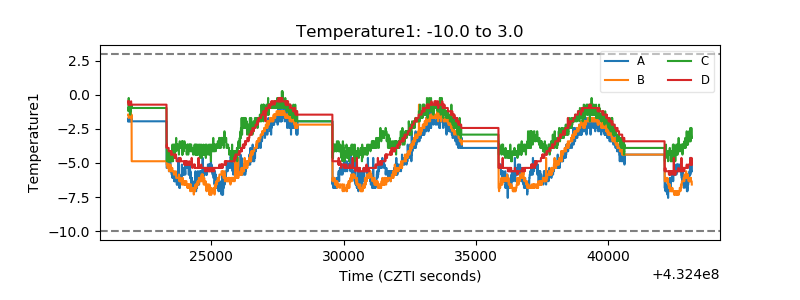 |
| Veto HV Monitor | 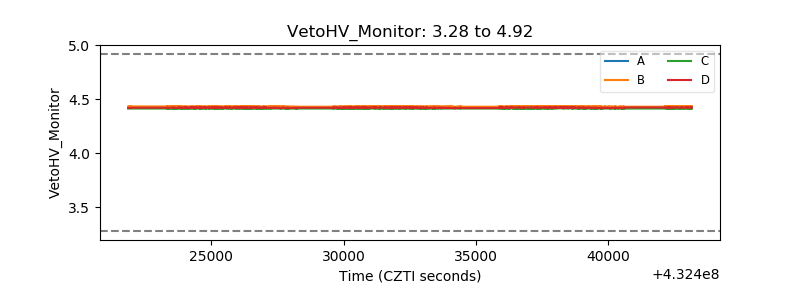 |
| Veto LLD | 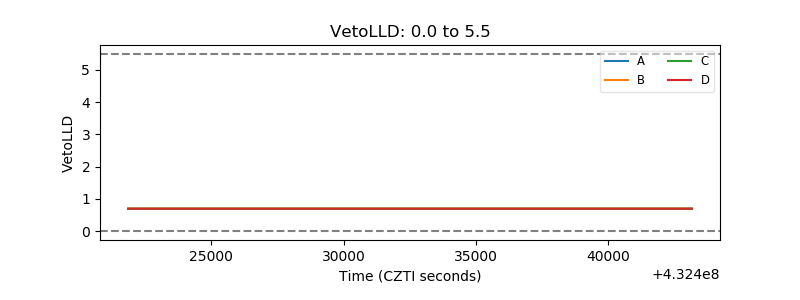 |
| Alpha Counter |  |
| _CPM_Rate | 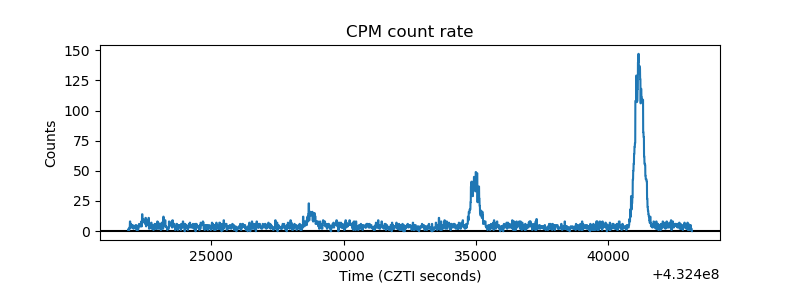 |
| CZT Counter | 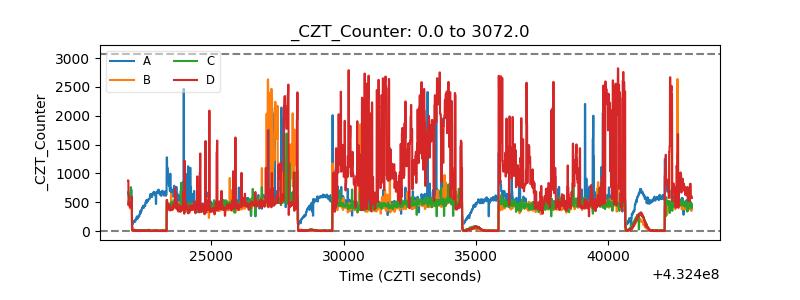 |
| +2.5 Volts monitor | 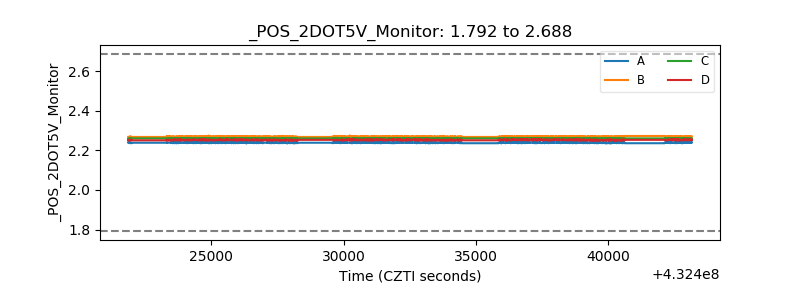 |
| +5 Volts monitor | 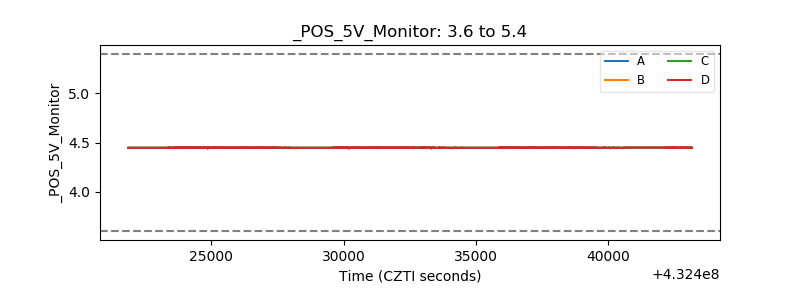 |
| _ROLL_ROT | 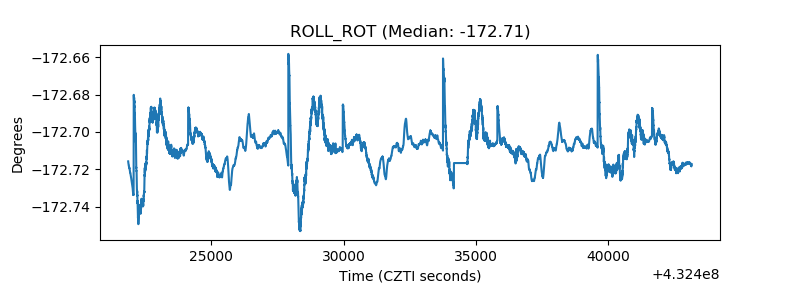 |
| _Roll_DEC | 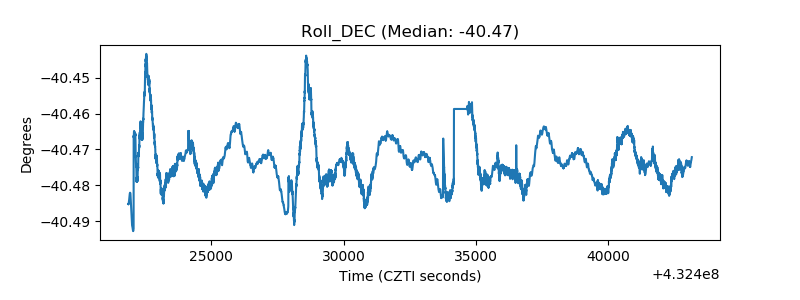 |
| _Roll_RA | 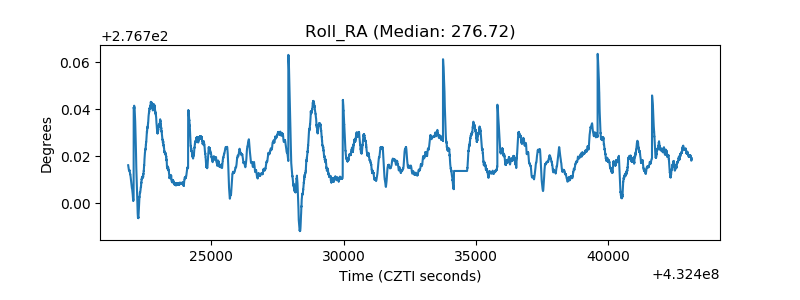 |
| Veto Counter | 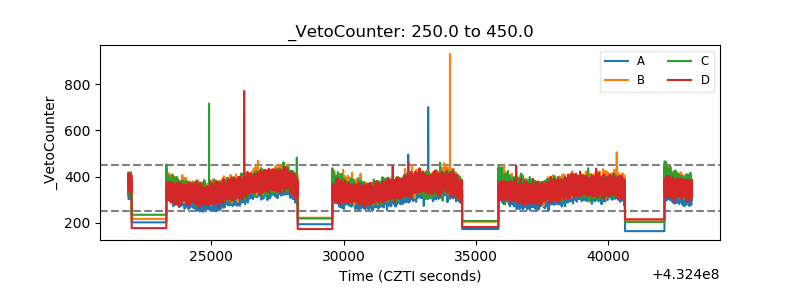 |