| Param | Original file | Final file |
|---|---|---|
| Filename | modeM0/AS1A09_006T09_9000005842_43063cztM0_level2.fits | modeM0/AS1A09_006T09_9000005842_43063cztM0_level2_quad_clean.evt |
| Size (bytes) | 289,900,800 | 73,209,600 |
| Size | 276.5 MB | 69.8 MB |
| Events in quadrant A | 2,486,219 | 485,417 |
| Events in quadrant B | 2,142,657 | 504,241 |
| Events in quadrant C | 2,101,929 | 494,463 |
| Events in quadrant D | 3,645,768 | 413,098 |
| Mode SS | |||
|---|---|---|---|
| Quadrant | BADHDUFLAG | Total packets | Discarded packets |
| A | 0 | 94 | 0 |
| B | 0 | 94 | 0 |
| C | 0 | 94 | 0 |
| D | 0 | 94 | 0 |
| Mode M0 | |||
|---|---|---|---|
| Quadrant | BADHDUFLAG | Total packets | Discarded packets |
| A | 0 | 10041 | 1 |
| B | 0 | 9619 | 1 |
| C | 0 | 9101 | 1 |
| D | 0 | 14084 | 1 |
| Mode M9 | |||
|---|---|---|---|
| Quadrant | BADHDUFLAG | Total packets | Discarded packets |
| A | 0 | 15 | 0 |
| B | 0 | 15 | 0 |
| C | 0 | 15 | 0 |
| D | 0 | 15 | 0 |
| Quadrant | Total seconds | Saturated seconds | Saturation percentage |
|---|---|---|---|
| A | 4542 | 26 | 0.572435% |
| B | 4543 | 26 | 0.572309% |
| C | 4543 | 4 | 0.088048% |
| D | 4543 | 375 | 8.254457% |
Noise dominated data is calculated using 1-second bins in cleaned event files. If a bin has >2000 counts, and if more than 50% of those come from <1% of pixels, then it is considered to be noise-dominated and hence unusable.
| Quadrant | # 1 sec bins | Bins with >0 counts | Bins with >2000 counts | High rate bins dominated by noise | Noise dominated (total time) | Noise dominated (detector-on time) | Marked lightcurve |
|---|---|---|---|---|---|---|---|
| A | 6034 | 4543 | 15 | 15 | 0.25% | 0.33% | 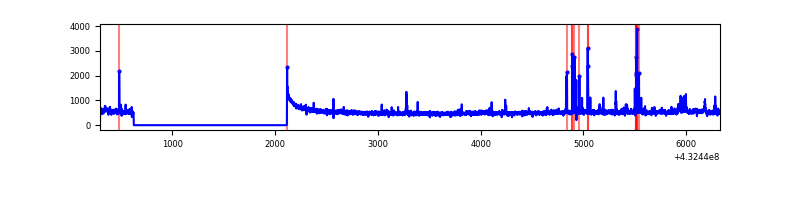 |
| B | 6035 | 4544 | 17 | 17 | 0.28% | 0.37% | 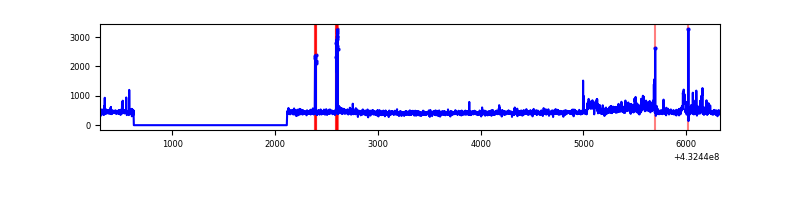 |
| C | 6035 | 4544 | 0 | 0 | 0.00% | 0.00% | 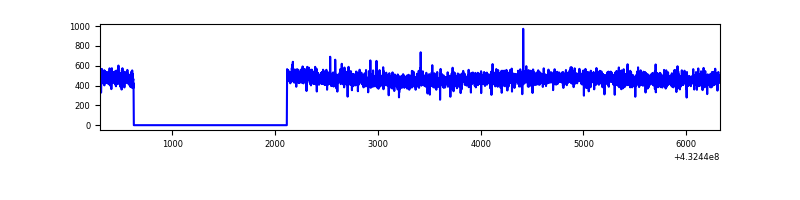 |
| D | 6035 | 4544 | 312 | 312 | 5.17% | 6.87% | 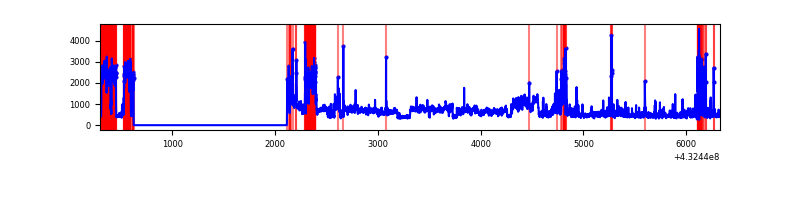 |
Top three noisy pixels from each quadrant. If the there are fewer than three noisy pixels in the level2.evt file, extra rows are filled as -1
| Pixel properties | Quadrant properties | ||||||
|---|---|---|---|---|---|---|---|
| Quadrant | DetID | PixID | Counts | Sigma | Mean | Median | Sigma |
| A | 10 | 83 | 429880 | 4178.93 | 492 | 480 | 102.8 |
| A | 12 | 189 | 57361 | 553.57 | 492 | 480 | 102.8 |
| A | 15 | 222 | 55893 | 539.28 | 492 | 480 | 102.8 |
| B | 0 | 186 | 133026 | 1384.09 | 489 | 474 | 95.8 |
| B | 0 | 229 | 50174 | 518.96 | 489 | 474 | 95.8 |
| B | 0 | 245 | 20669 | 210.87 | 489 | 474 | 95.8 |
| C | 15 | 214 | 198925 | 1731.0 | 486 | 489 | 114.6 |
| C | 13 | 61 | 3331 | 24.79 | 486 | 489 | 114.6 |
| C | 12 | 249 | 2761 | 19.82 | 486 | 489 | 114.6 |
| D | 2 | 16 | 1132439 | 9758.21 | 466 | 451 | 116.0 |
| D | 13 | 249 | 254493 | 2189.95 | 466 | 451 | 116.0 |
| D | 1 | 52 | 233500 | 2008.98 | 466 | 451 | 116.0 |
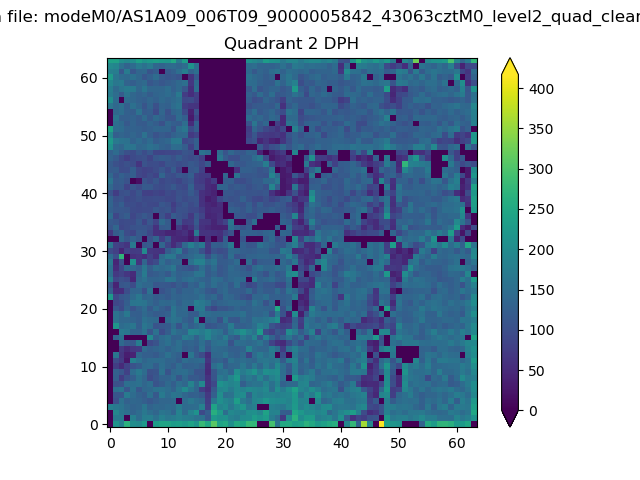
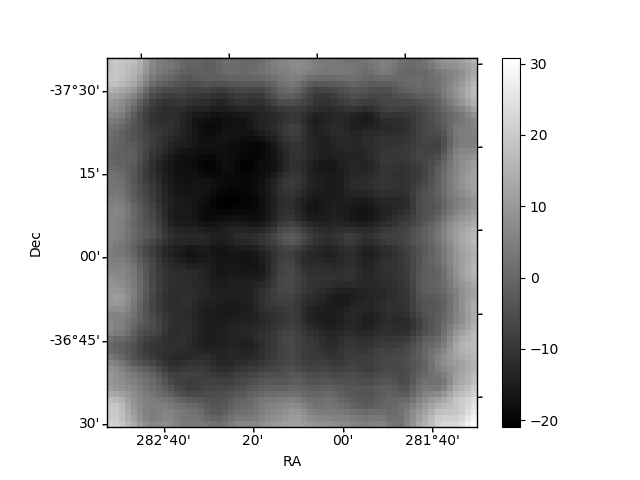
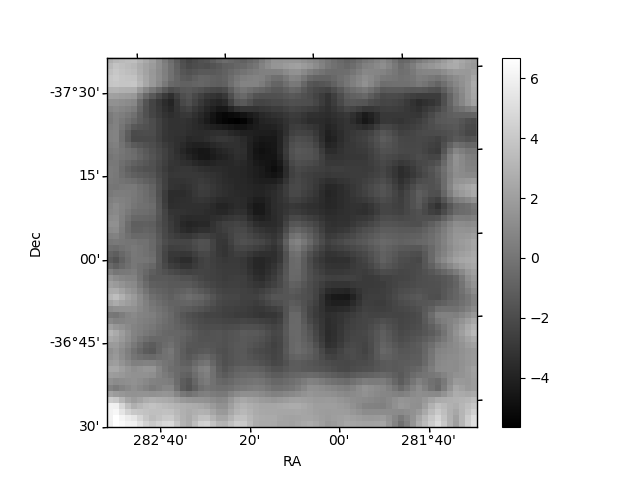
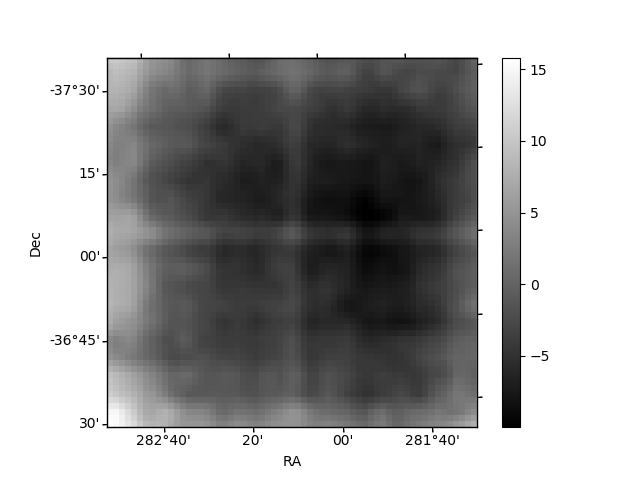
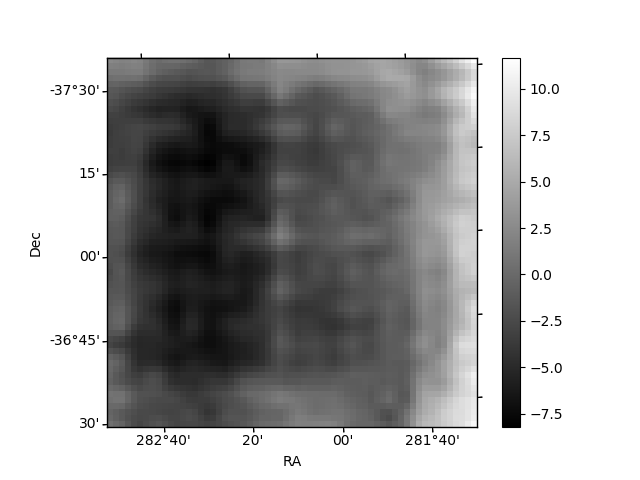
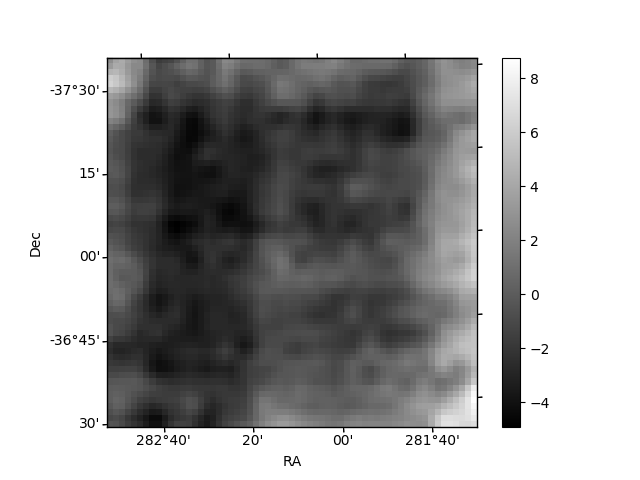
Histogram calculated using DETX and DETY for each event in the final _common_clean file
| Quadrant A | 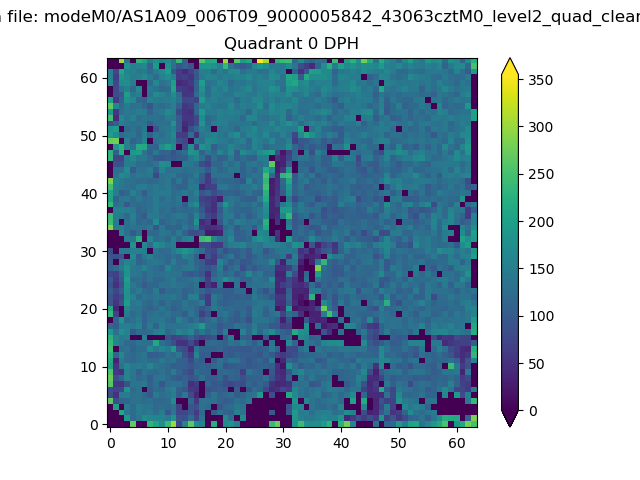 |
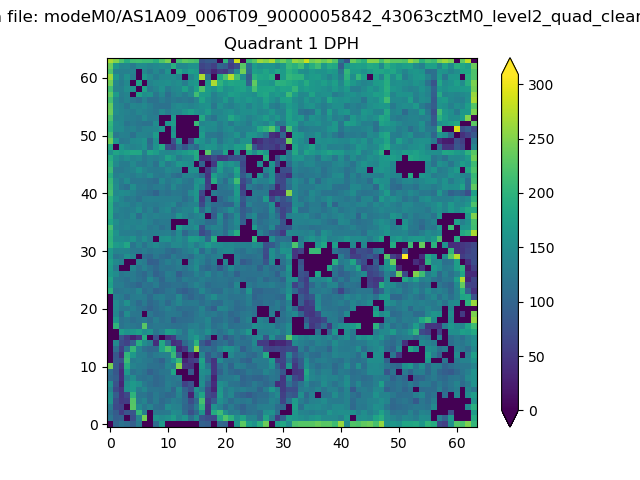 |
Quadrant B |
|---|---|---|---|
| Quadrant D | 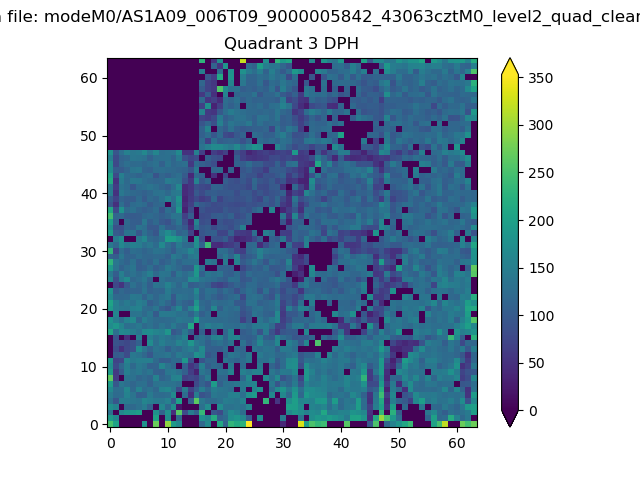 |
 |
Quadrant C |
| Plot type | Count rate plots | Images |
|---|---|---|
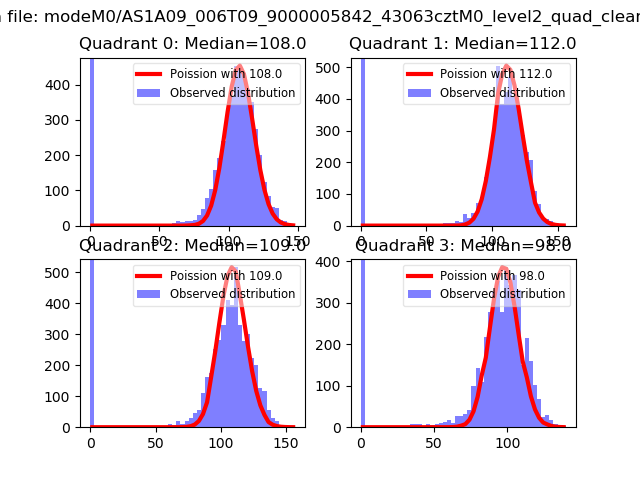
| Comparison with Poisson distribution Blue bars denote a histogram of data divided into 1 sec bins. Red curve is a Poisson curve with rate = median count rate of data. |
 |
 |
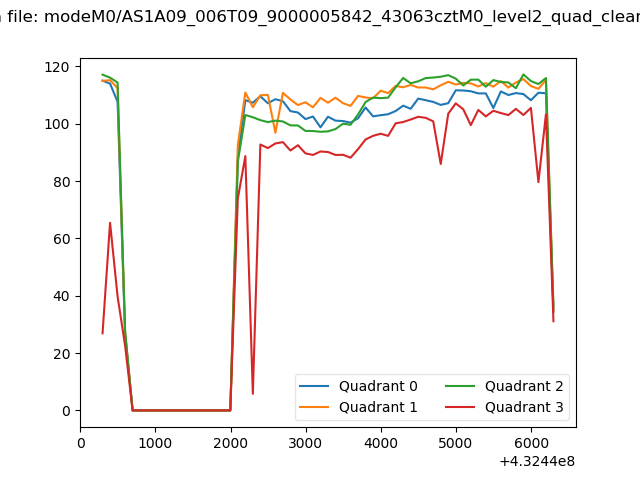
| Quadrant-wise count rates Data is divided into 100 sec bins |
 |
|
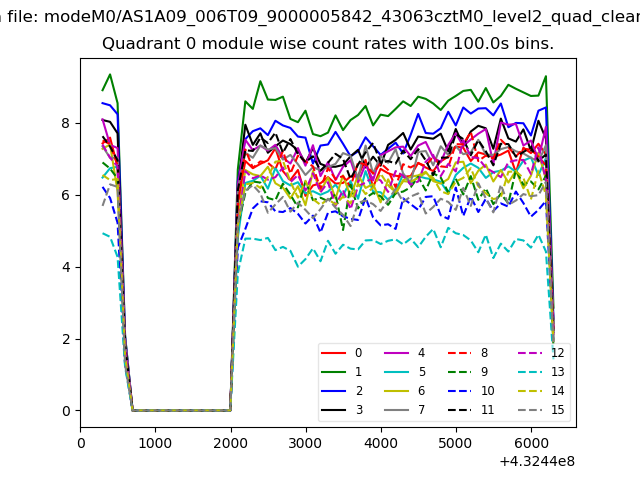
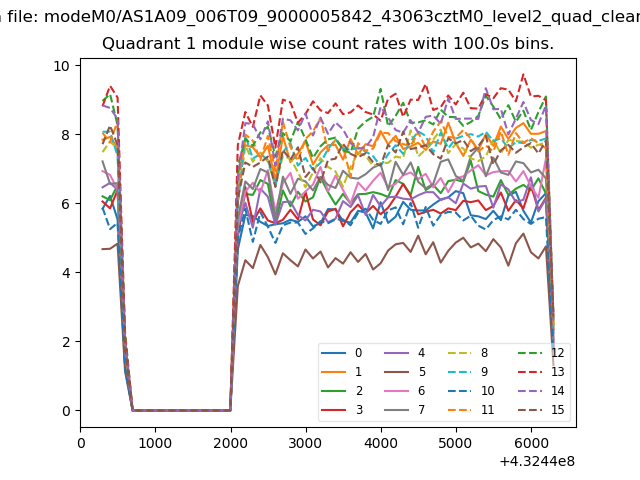
| Module-wise count rates for Quadrant A Data is divided into 100 sec bins |
 |
 |
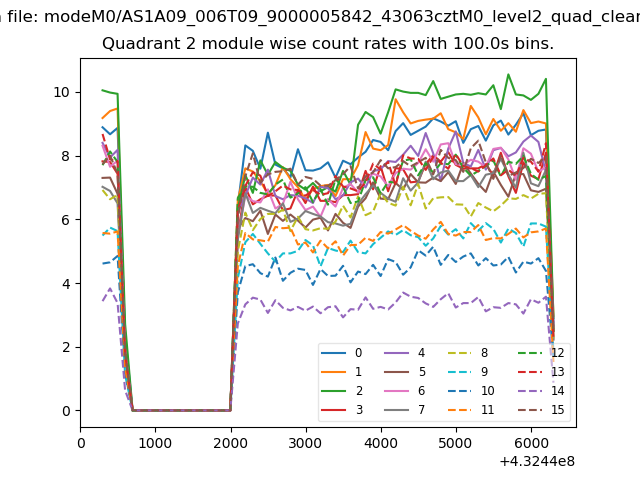
| Module-wise count rates for Quadrant B Data is divided into 100 sec bins |
 |
 |
| Module-wise count rates for Quadrant C Data is divided into 100 sec bins |
 |
 |
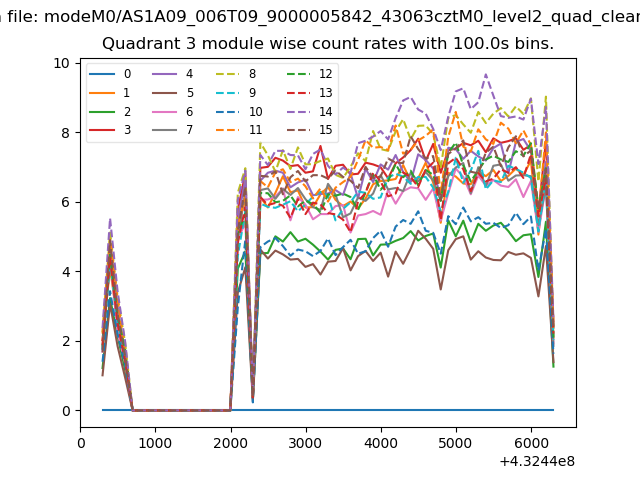
| Module-wise count rates for Quadrant D Data is divided into 100 sec bins |
 |
 |
| Parameter | Plot |
|---|---|
| CZT HV Monitor |  |
| D_VDD | 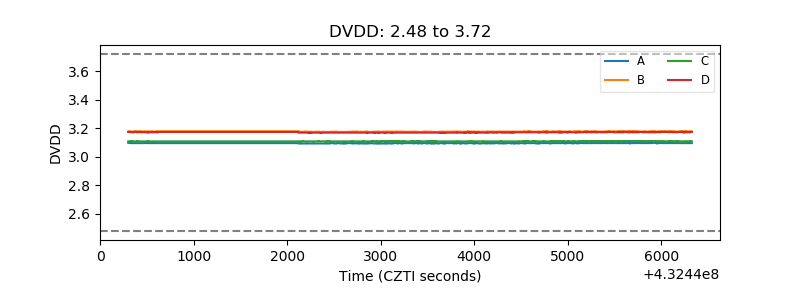 |
| Temperature 1 | 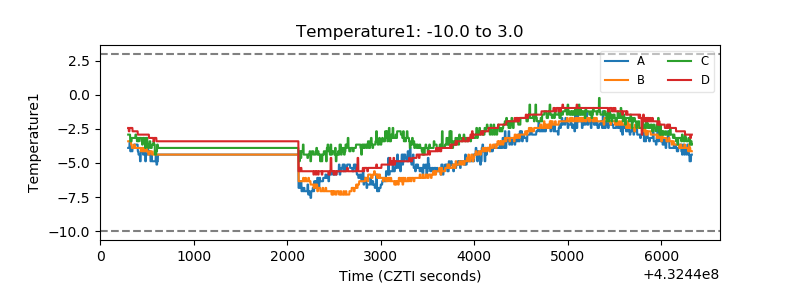 |
| Veto HV Monitor | 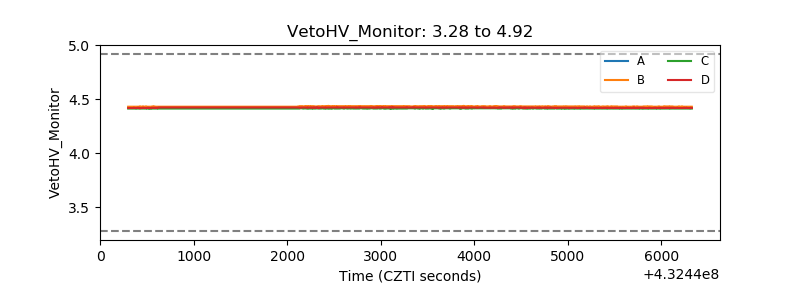 |
| Veto LLD | 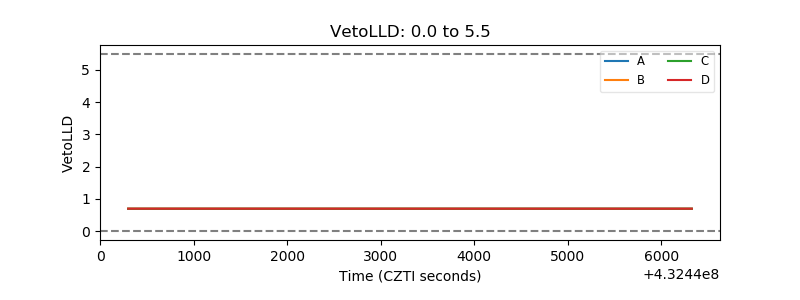 |
| Alpha Counter | 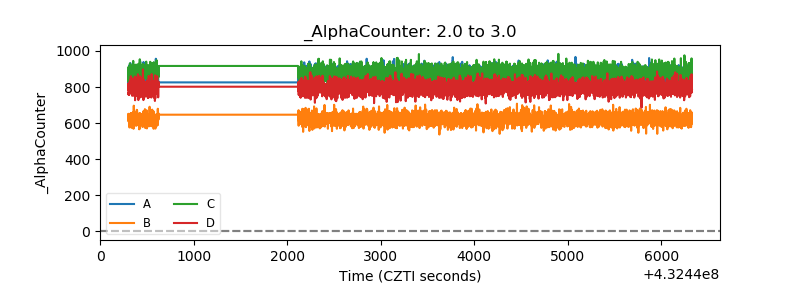 |
| _CPM_Rate | 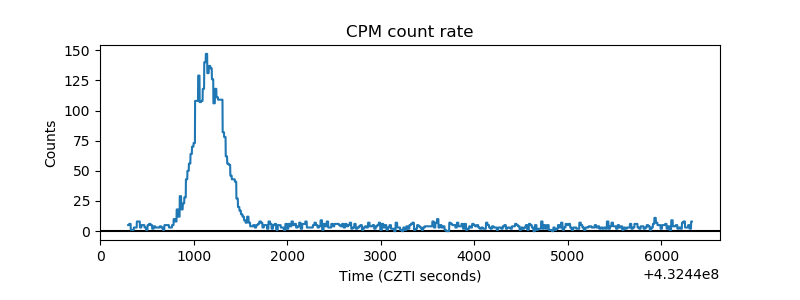 |
| CZT Counter | 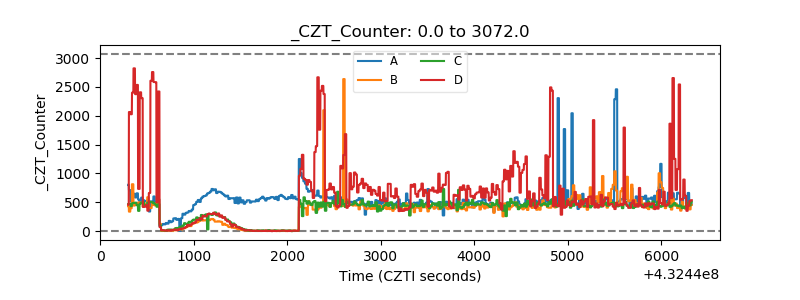 |
| +2.5 Volts monitor | 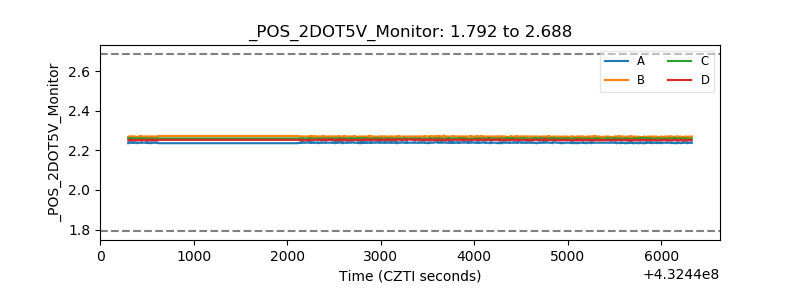 |
| +5 Volts monitor | 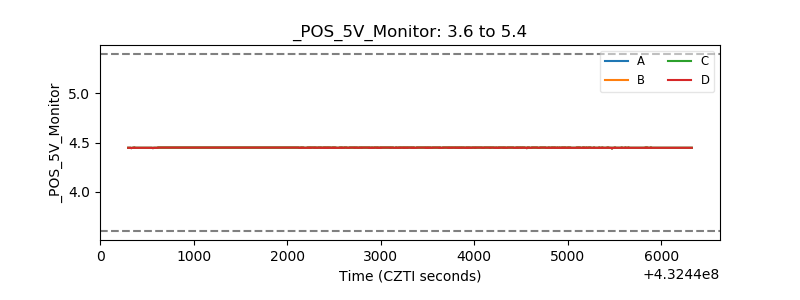 |
| _ROLL_ROT | 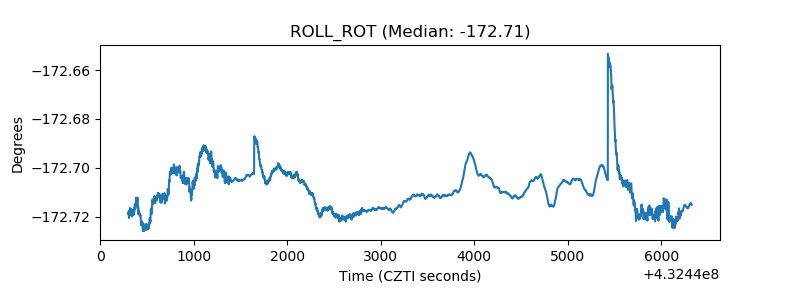 |
| _Roll_DEC | 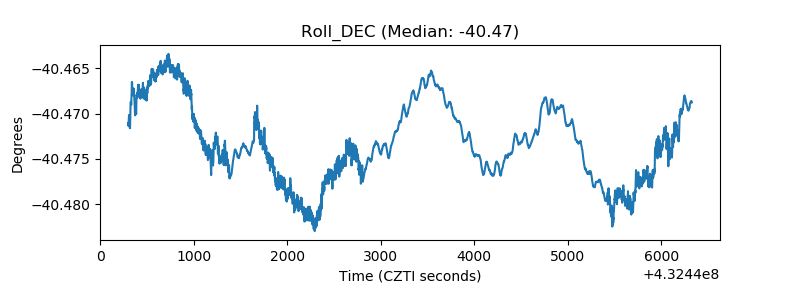 |
| _Roll_RA | 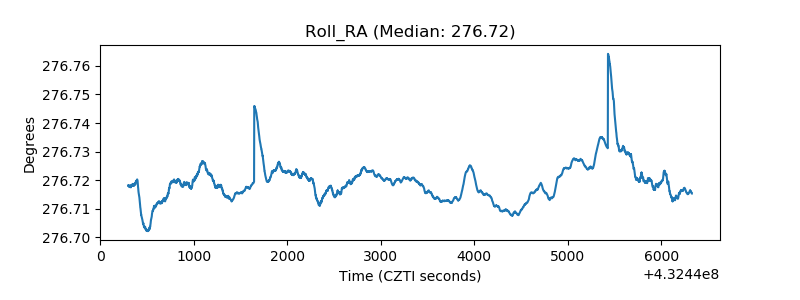 |
| Veto Counter | 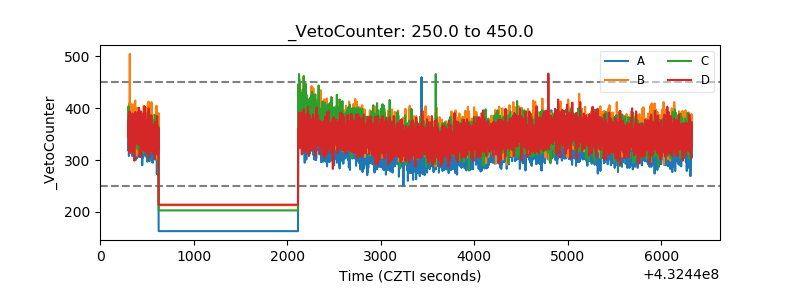 |