| Param | Original file | Final file |
|---|---|---|
| Filename | modeM0/AS1C07_001T10_9000005844_43063cztM0_level2.fits | modeM0/AS1C07_001T10_9000005844_43063cztM0_level2_quad_clean.evt |
| Size (bytes) | 56,825,280 | 15,053,760 |
| Size | 54.2 MB | 14.4 MB |
| Events in quadrant A | 583,563 | 96,761 |
| Events in quadrant B | 396,322 | 100,565 |
| Events in quadrant C | 429,529 | 98,451 |
| Events in quadrant D | 620,144 | 89,712 |
| Mode SS | |||
|---|---|---|---|
| Quadrant | BADHDUFLAG | Total packets | Discarded packets |
| A | 0 | 18 | 0 |
| B | 0 | 18 | 0 |
| C | 0 | 18 | 0 |
| D | 0 | 18 | 0 |
| Mode M9 | |||
|---|---|---|---|
| Quadrant | BADHDUFLAG | Total packets | Discarded packets |
| A | 0 | 9 | 0 |
| B | 0 | 9 | 0 |
| C | 0 | 9 | 0 |
| D | 0 | 9 | 0 |
| Mode M0 | |||
|---|---|---|---|
| Quadrant | BADHDUFLAG | Total packets | Discarded packets |
| A | 0 | 2323 | 1 |
| B | 0 | 1820 | 1 |
| C | 0 | 1838 | 1 |
| D | 0 | 2437 | 1 |
| Quadrant | Total seconds | Saturated seconds | Saturation percentage |
|---|---|---|---|
| A | 909 | 10 | 1.100110% |
| B | 909 | 3 | 0.330033% |
| C | 909 | 1 | 0.110011% |
| D | 909 | 19 | 2.090209% |
Noise dominated data is calculated using 1-second bins in cleaned event files. If a bin has >2000 counts, and if more than 50% of those come from <1% of pixels, then it is considered to be noise-dominated and hence unusable.
| Quadrant | # 1 sec bins | Bins with >0 counts | Bins with >2000 counts | High rate bins dominated by noise | Noise dominated (total time) | Noise dominated (detector-on time) | Marked lightcurve |
|---|---|---|---|---|---|---|---|
| A | 909 | 909 | 5 | 5 | 0.55% | 0.55% | 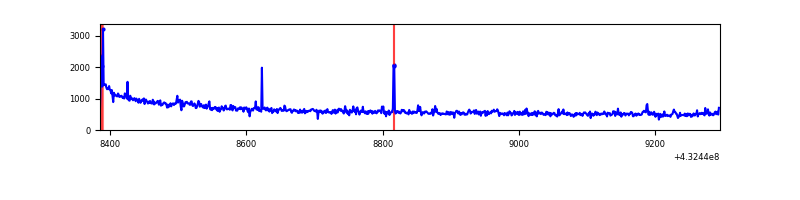 |
| B | 909 | 909 | 0 | 0 | 0.00% | 0.00% | 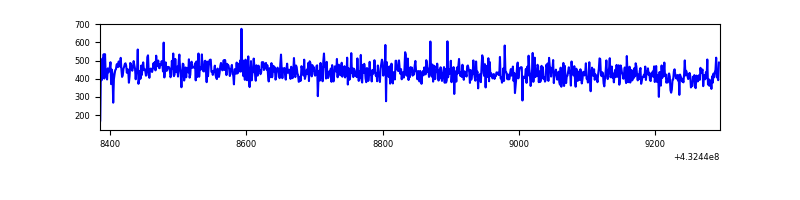 |
| C | 909 | 909 | 0 | 0 | 0.00% | 0.00% | 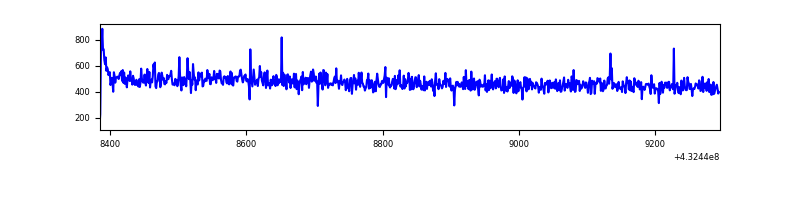 |
| D | 909 | 909 | 19 | 19 | 2.09% | 2.09% | 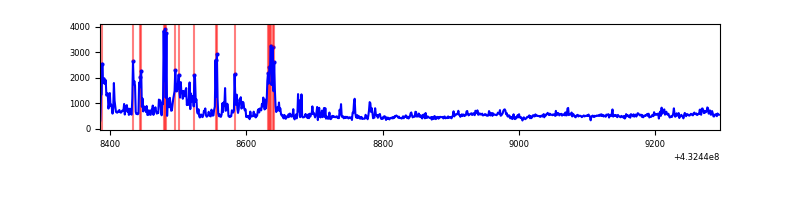 |
Top three noisy pixels from each quadrant. If the there are fewer than three noisy pixels in the level2.evt file, extra rows are filled as -1
| Pixel properties | Quadrant properties | ||||||
|---|---|---|---|---|---|---|---|
| Quadrant | DetID | PixID | Counts | Sigma | Mean | Median | Sigma |
| A | 10 | 83 | 161662 | 7098.32 | 100 | 97 | 22.8 |
| A | 15 | 222 | 18736 | 818.9 | 100 | 97 | 22.8 |
| A | 15 | 237 | 7826 | 339.57 | 100 | 97 | 22.8 |
| B | 12 | 111 | 2634 | 114.95 | 100 | 97 | 22.1 |
| B | 11 | 111 | 2439 | 106.11 | 100 | 97 | 22.1 |
| B | 14 | 111 | 2308 | 100.18 | 100 | 97 | 22.1 |
| C | 15 | 214 | 45442 | 1839.14 | 97 | 97 | 24.7 |
| C | 3 | 233 | 2310 | 89.76 | 97 | 97 | 24.7 |
| C | 14 | 67 | 674 | 23.4 | 97 | 97 | 24.7 |
| D | 13 | 171 | 143258 | 5631.02 | 95 | 91 | 25.4 |
| D | 2 | 16 | 86327 | 3391.82 | 95 | 91 | 25.4 |
| D | 1 | 52 | 23406 | 917.02 | 95 | 91 | 25.4 |
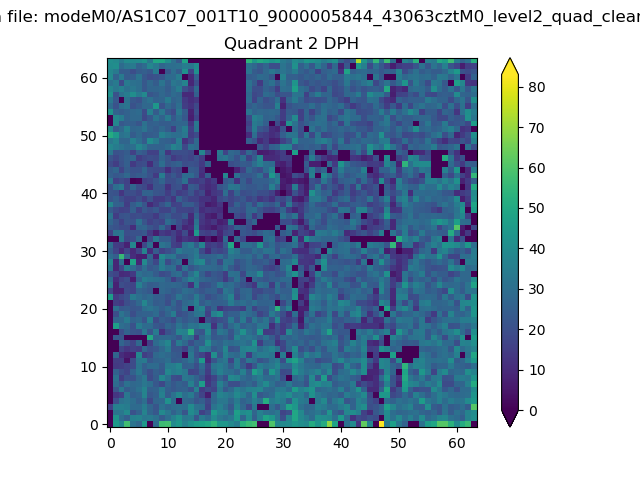
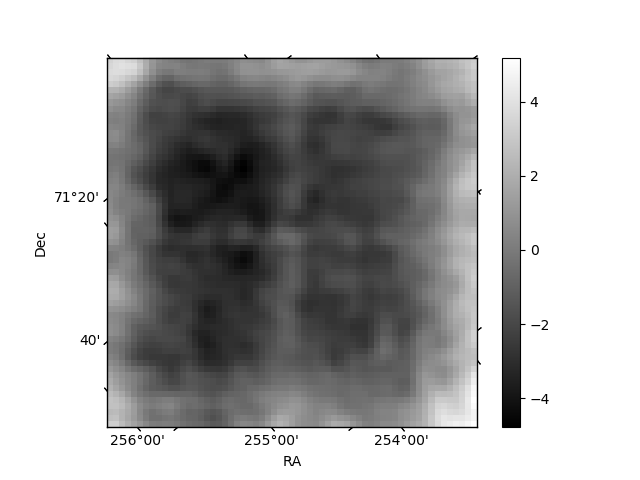
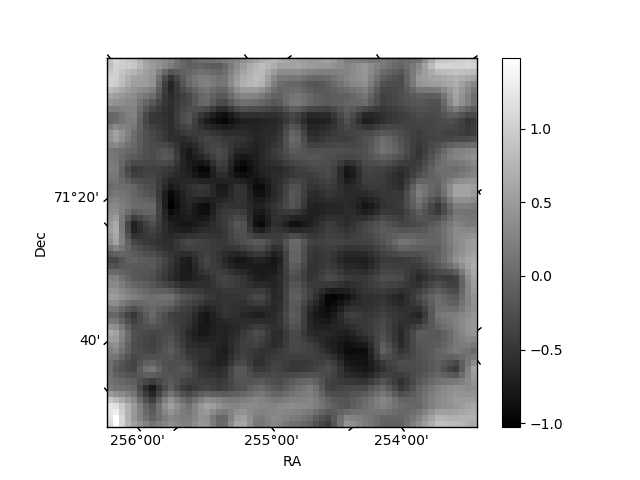
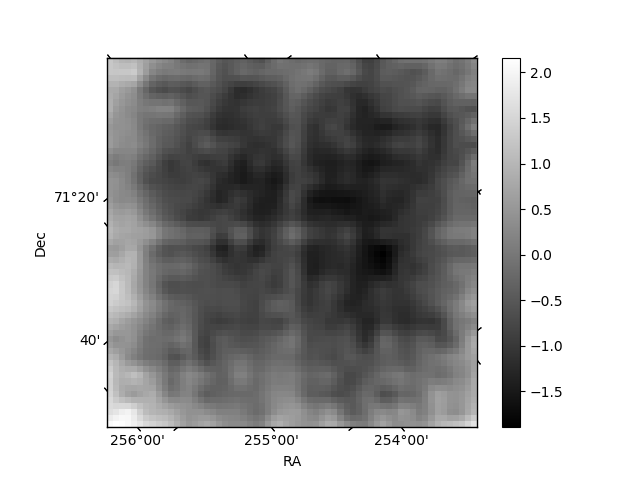
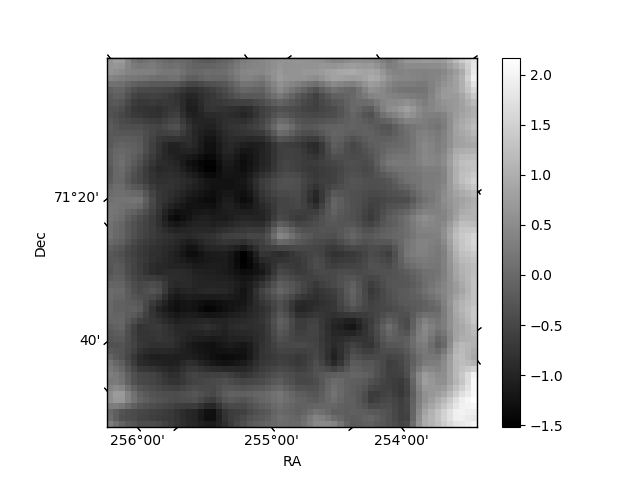
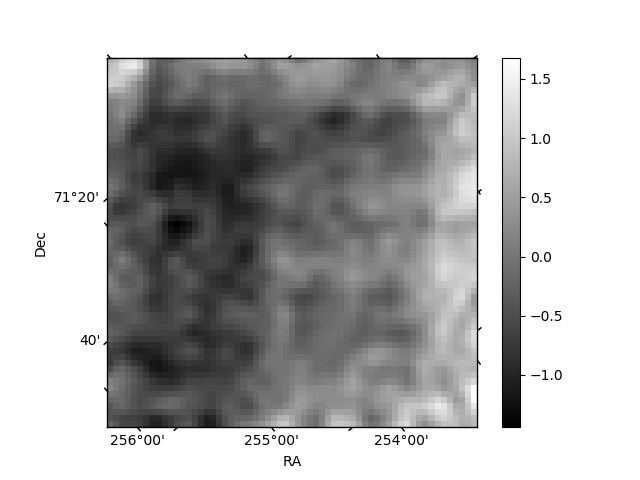
Histogram calculated using DETX and DETY for each event in the final _common_clean file
| Quadrant A | 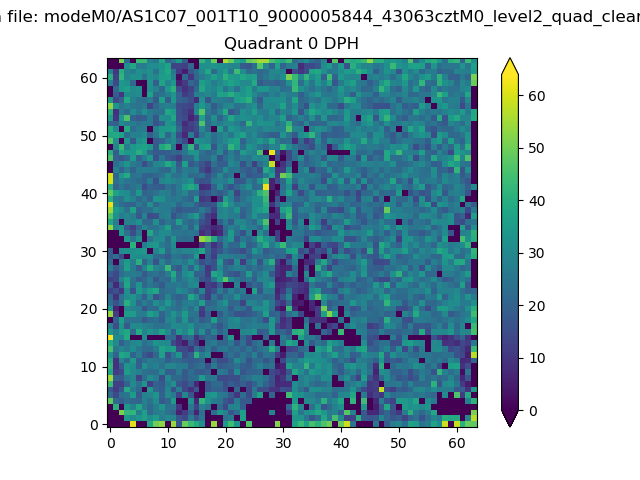 |
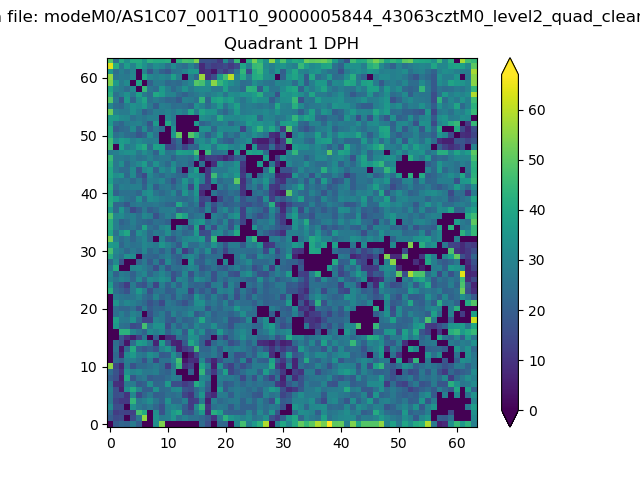 |
Quadrant B |
|---|---|---|---|
| Quadrant D | 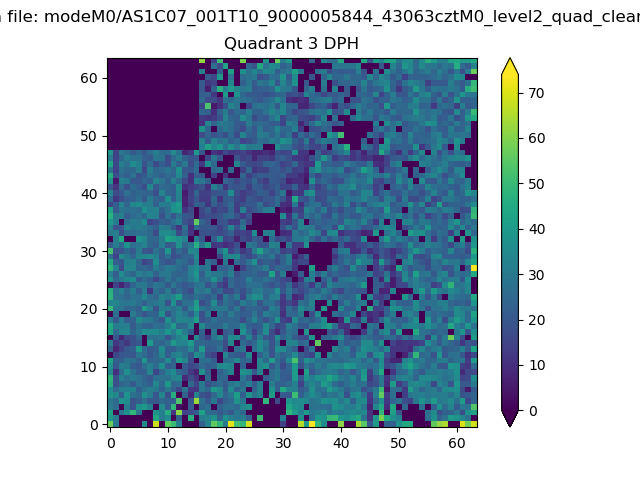 |
 |
Quadrant C |
| Plot type | Count rate plots | Images |
|---|---|---|
| Comparison with Poisson distribution Blue bars denote a histogram of data divided into 1 sec bins. Red curve is a Poisson curve with rate = median count rate of data. |
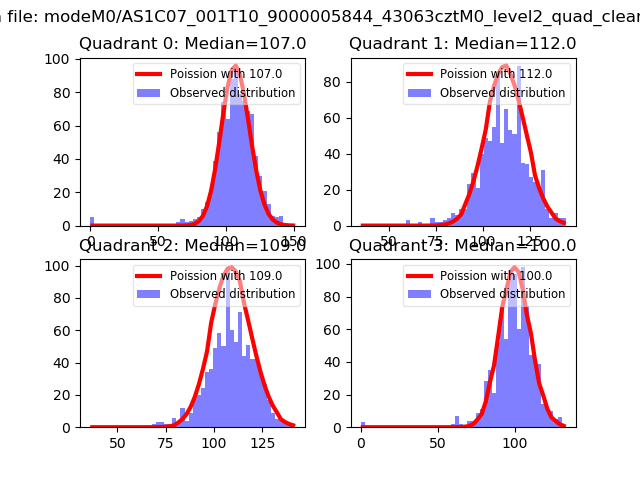 |
 |
| Quadrant-wise count rates Data is divided into 100 sec bins |
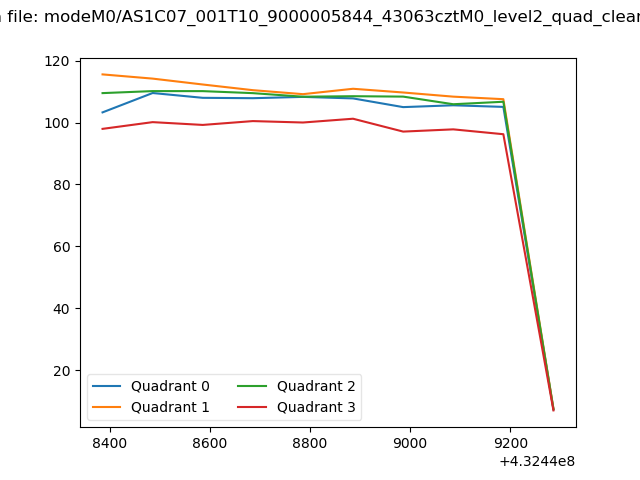 |
|
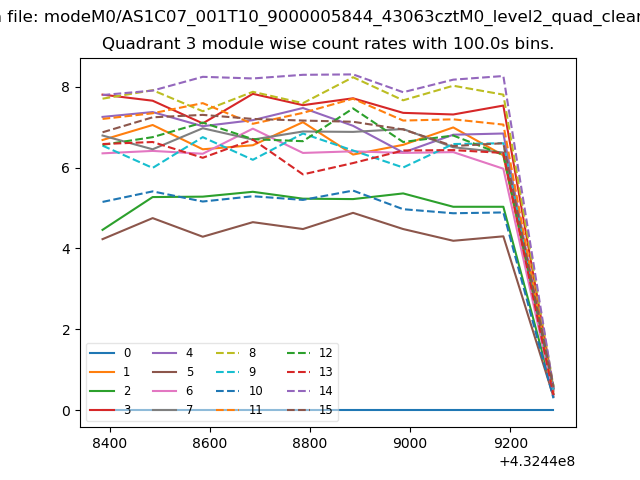
| Module-wise count rates for Quadrant A Data is divided into 100 sec bins |
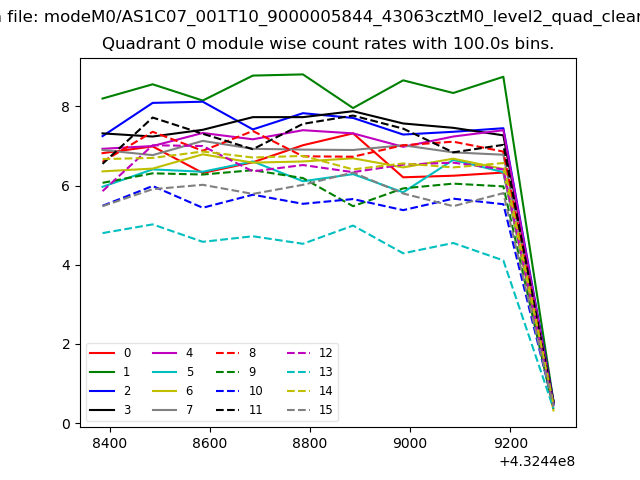 |
 |
| Module-wise count rates for Quadrant B Data is divided into 100 sec bins |
 |
 |
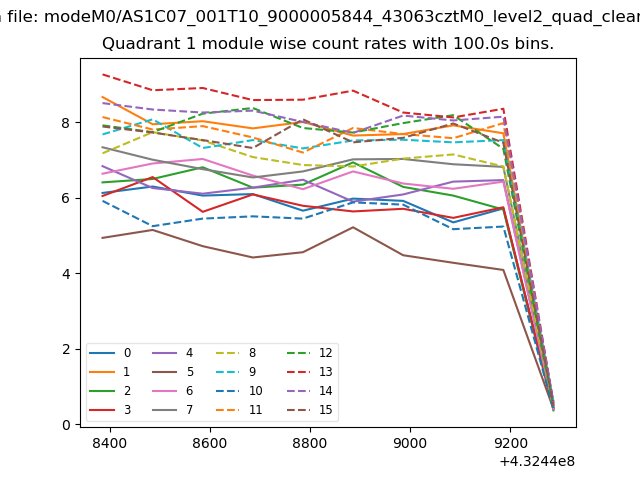
| Module-wise count rates for Quadrant C Data is divided into 100 sec bins |
 |
 |
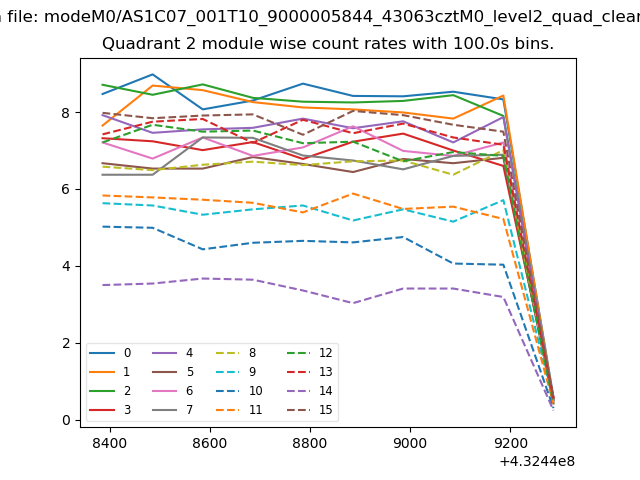
| Module-wise count rates for Quadrant D Data is divided into 100 sec bins |
 |
 |
| Parameter | Plot |
|---|---|
| CZT HV Monitor | 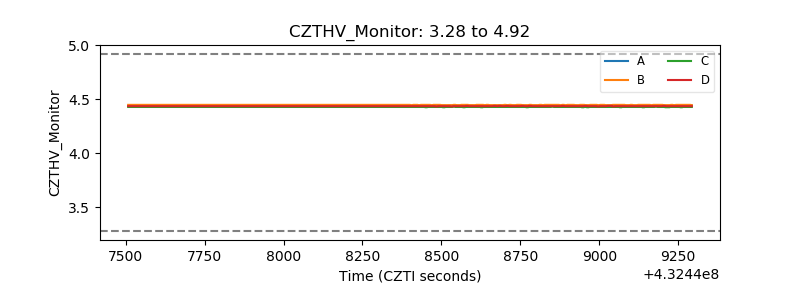 |
| D_VDD | 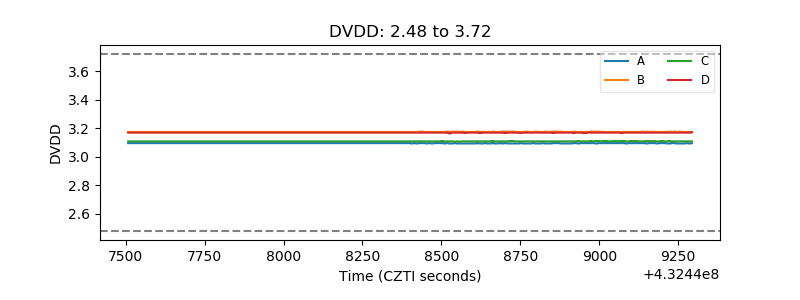 |
| Temperature 1 | 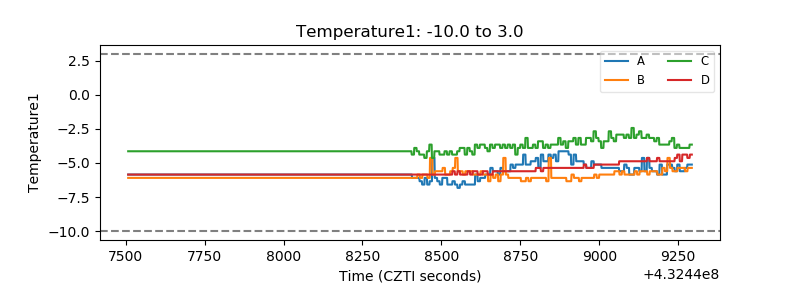 |
| Veto HV Monitor | 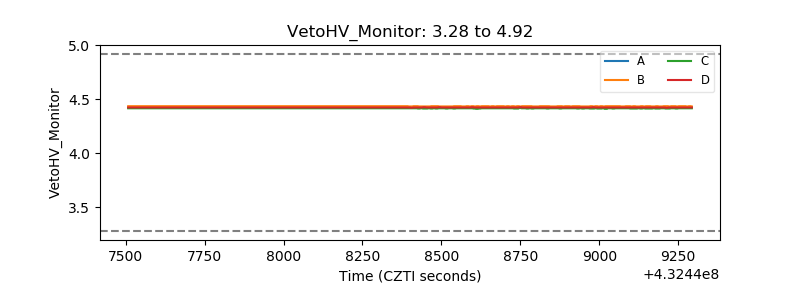 |
| Veto LLD | 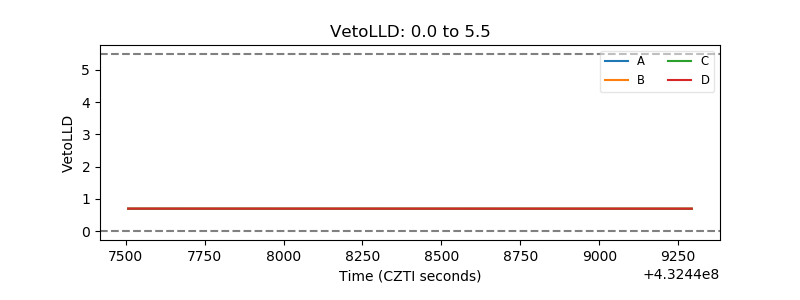 |
| Alpha Counter | 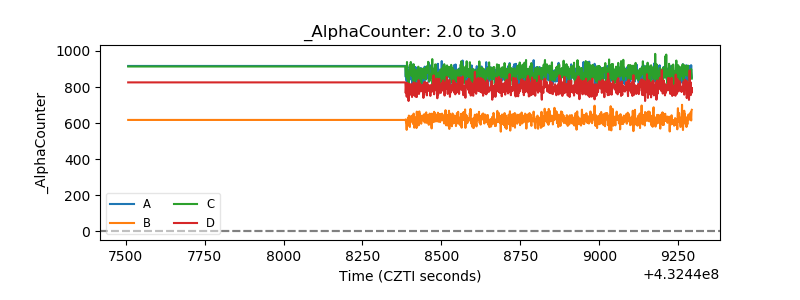 |
| _CPM_Rate | 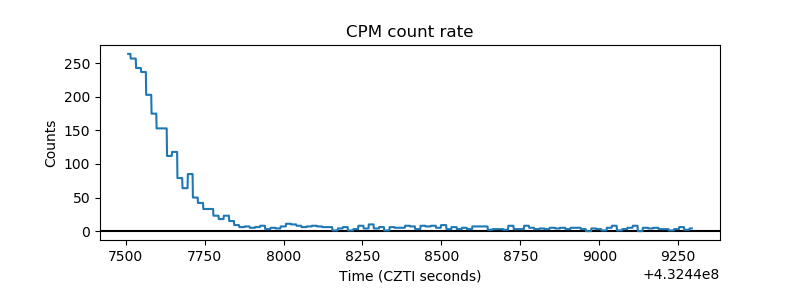 |
| CZT Counter | 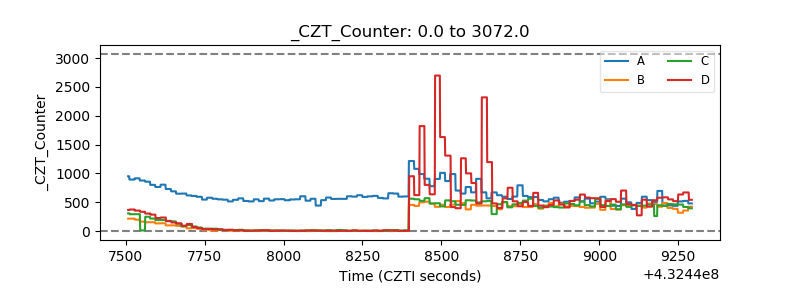 |
| +2.5 Volts monitor | 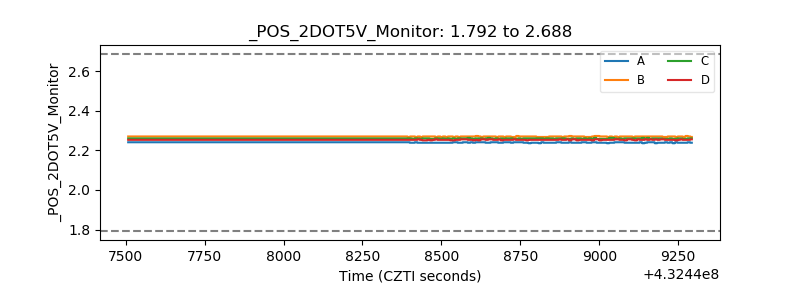 |
| +5 Volts monitor | 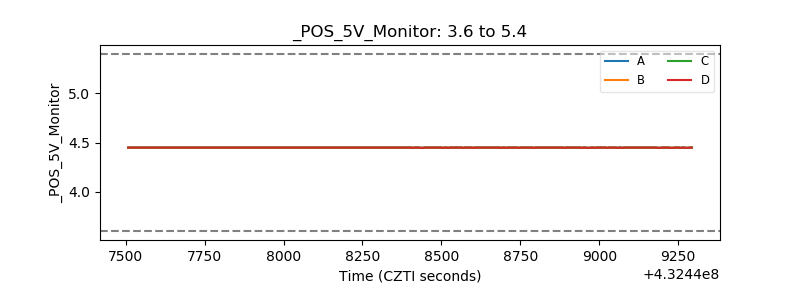 |
| _ROLL_ROT | 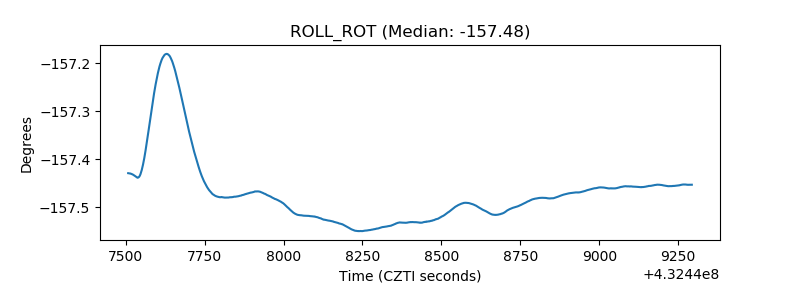 |
| _Roll_DEC | 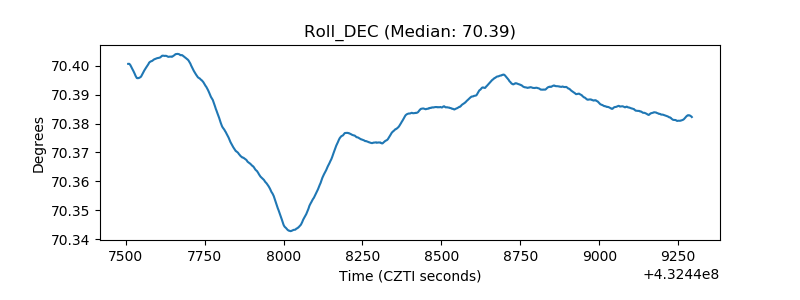 |
| _Roll_RA | 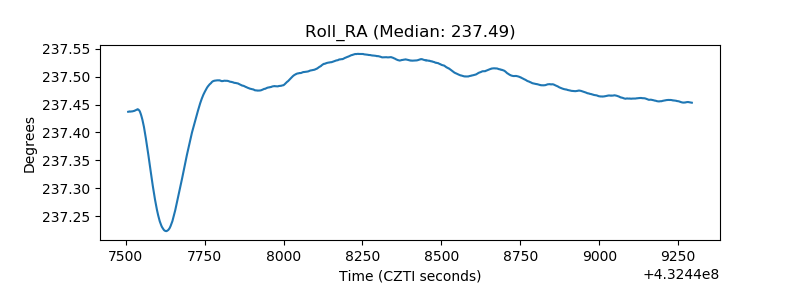 |
| Veto Counter | 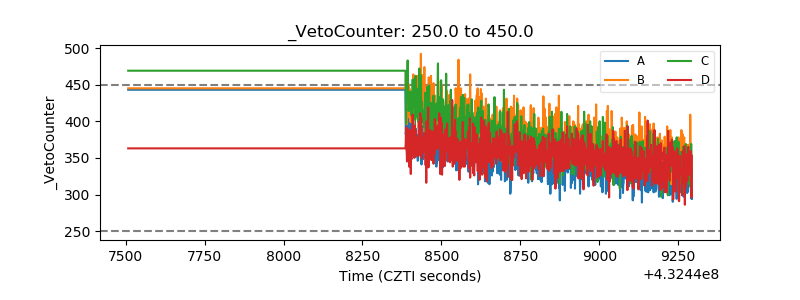 |