| Param | Original file | Final file |
|---|---|---|
| Filename | modeM0/AS1C07_001T10_9000005844_43067cztM0_level2.fits | modeM0/AS1C07_001T10_9000005844_43067cztM0_level2_quad_clean.evt |
| Size (bytes) | 413,830,080 | 87,517,440 |
| Size | 394.7 MB | 83.5 MB |
| Events in quadrant A | 3,858,932 | 591,142 |
| Events in quadrant B | 2,609,344 | 631,649 |
| Events in quadrant C | 2,413,308 | 583,202 |
| Events in quadrant D | 6,043,803 | 489,173 |
| Mode SS | |||
|---|---|---|---|
| Quadrant | BADHDUFLAG | Total packets | Discarded packets |
| A | 0 | 104 | 0 |
| B | 0 | 104 | 0 |
| C | 0 | 104 | 0 |
| D | 0 | 104 | 0 |
| Mode M9 | |||
|---|---|---|---|
| Quadrant | BADHDUFLAG | Total packets | Discarded packets |
| A | 0 | 24 | 0 |
| B | 0 | 24 | 0 |
| C | 0 | 25 | 0 |
| D | 0 | 25 | 0 |
| Mode M0 | |||
|---|---|---|---|
| Quadrant | BADHDUFLAG | Total packets | Discarded packets |
| A | 0 | 14596 | 2 |
| B | 0 | 10935 | 2 |
| C | 0 | 10225 | 2 |
| D | 0 | 21450 | 2 |
| Quadrant | Total seconds | Saturated seconds | Saturation percentage |
|---|---|---|---|
| A | 5058 | 353 | 6.979043% |
| B | 5058 | 41 | 0.810597% |
| C | 5058 | 2 | 0.039541% |
| D | 5058 | 779 | 15.401344% |
Noise dominated data is calculated using 1-second bins in cleaned event files. If a bin has >2000 counts, and if more than 50% of those come from <1% of pixels, then it is considered to be noise-dominated and hence unusable.
| Quadrant | # 1 sec bins | Bins with >0 counts | Bins with >2000 counts | High rate bins dominated by noise | Noise dominated (total time) | Noise dominated (detector-on time) | Marked lightcurve |
|---|---|---|---|---|---|---|---|
| A | 7029 | 5059 | 235 | 235 | 3.34% | 4.65% | 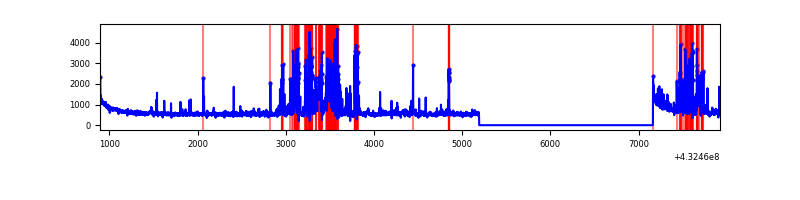 |
| B | 7029 | 5059 | 24 | 24 | 0.34% | 0.47% | 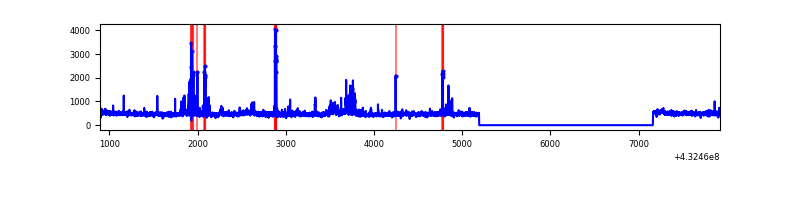 |
| C | 7029 | 5059 | 0 | 0 | 0.00% | 0.00% | 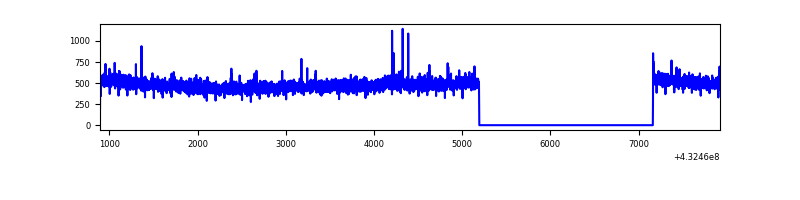 |
| D | 7029 | 5059 | 727 | 727 | 10.34% | 14.37% | 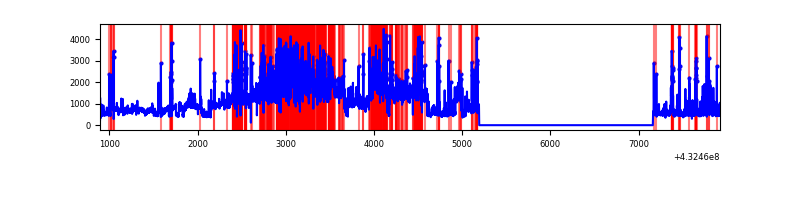 |
Top three noisy pixels from each quadrant. If the there are fewer than three noisy pixels in the level2.evt file, extra rows are filled as -1
| Pixel properties | Quadrant properties | ||||||
|---|---|---|---|---|---|---|---|
| Quadrant | DetID | PixID | Counts | Sigma | Mean | Median | Sigma |
| A | 15 | 237 | 784405 | 6839.02 | 563 | 553 | 114.6 |
| A | 10 | 83 | 568384 | 4954.26 | 563 | 553 | 114.6 |
| A | 15 | 222 | 210871 | 1835.0 | 563 | 553 | 114.6 |
| B | 0 | 229 | 212419 | 1966.07 | 571 | 557 | 107.8 |
| B | 5 | 255 | 51294 | 470.84 | 571 | 557 | 107.8 |
| B | 0 | 186 | 46916 | 430.21 | 571 | 557 | 107.8 |
| C | 15 | 214 | 227755 | 1777.93 | 553 | 556 | 127.8 |
| C | 2 | 16 | 7410 | 53.64 | 553 | 556 | 127.8 |
| C | 1 | 128 | 7305 | 52.81 | 553 | 556 | 127.8 |
| D | 2 | 16 | 2059049 | 15910.21 | 534 | 518 | 129.4 |
| D | 13 | 249 | 1139555 | 8803.52 | 534 | 518 | 129.4 |
| D | 1 | 52 | 477447 | 3686.14 | 534 | 518 | 129.4 |
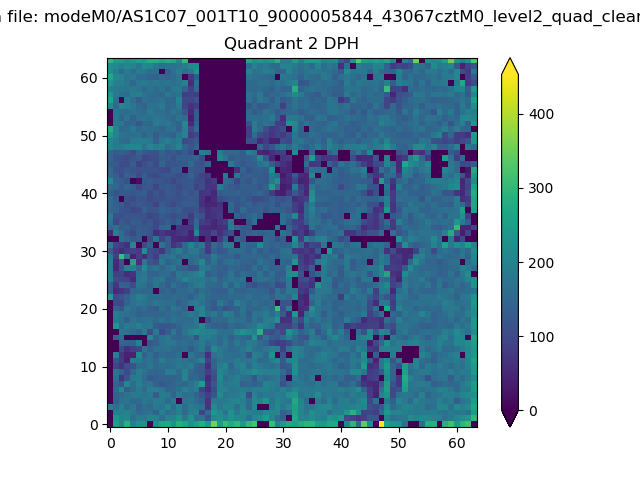
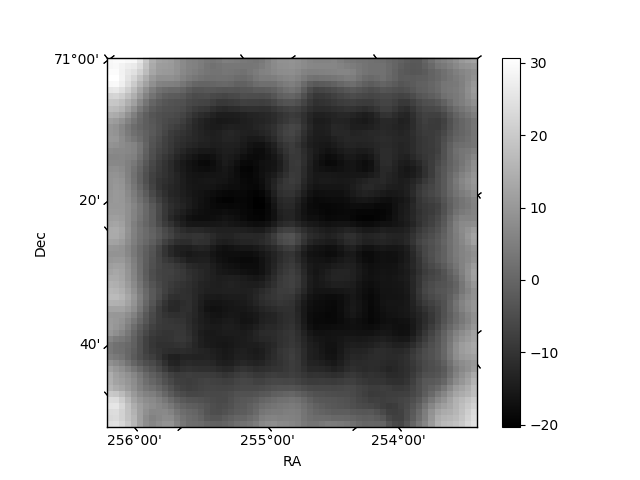
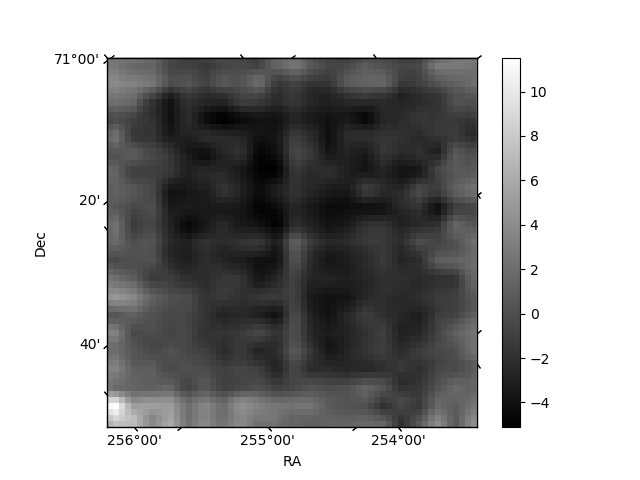
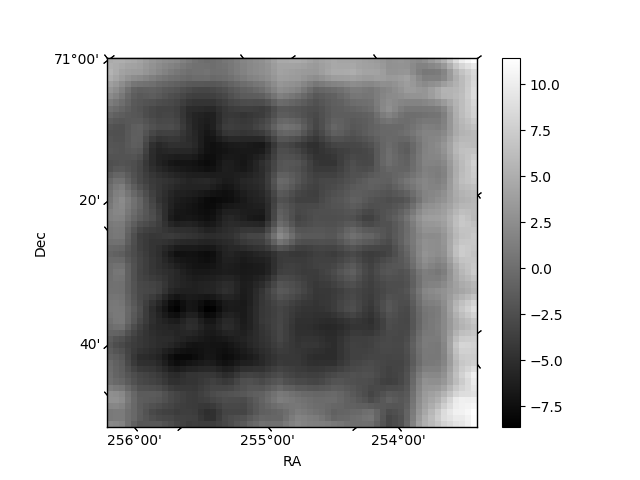
Histogram calculated using DETX and DETY for each event in the final _common_clean file
| Quadrant A | 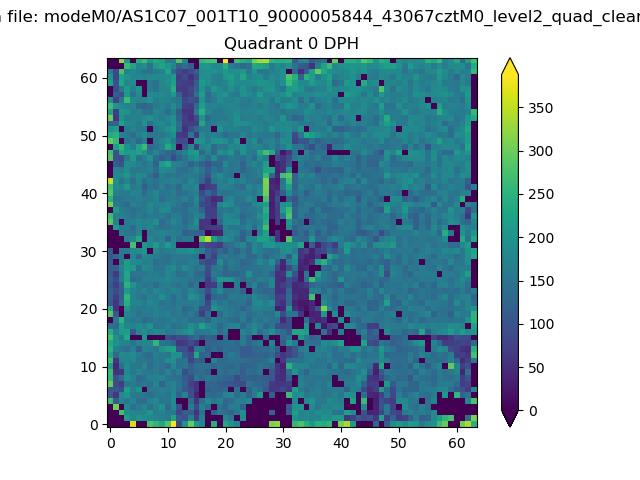 |
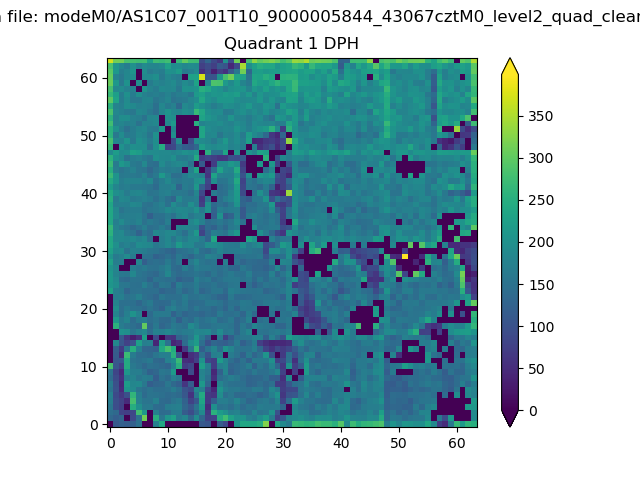 |
Quadrant B |
|---|---|---|---|
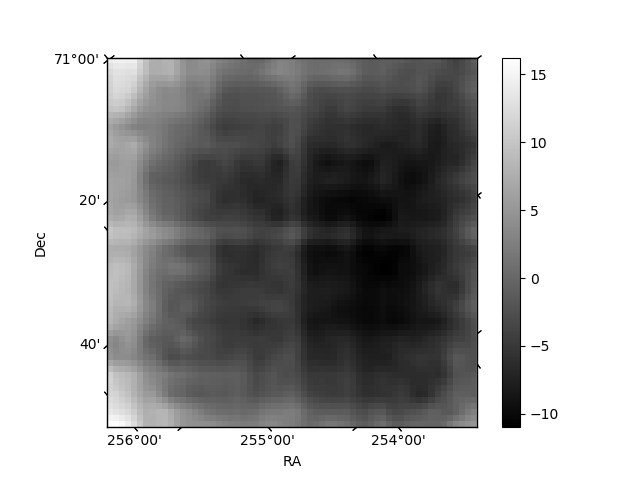
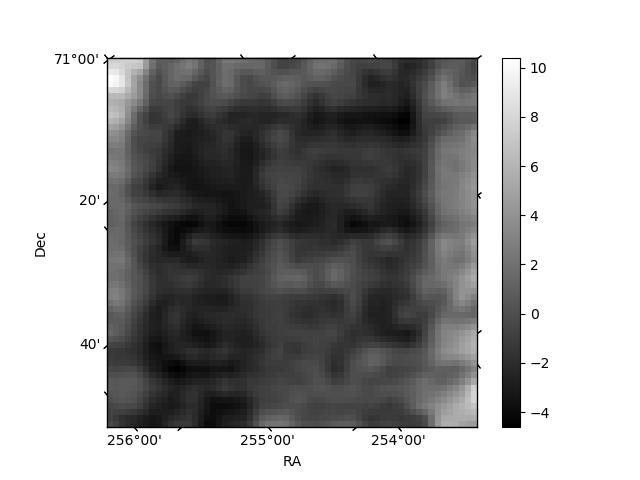
| Quadrant D | 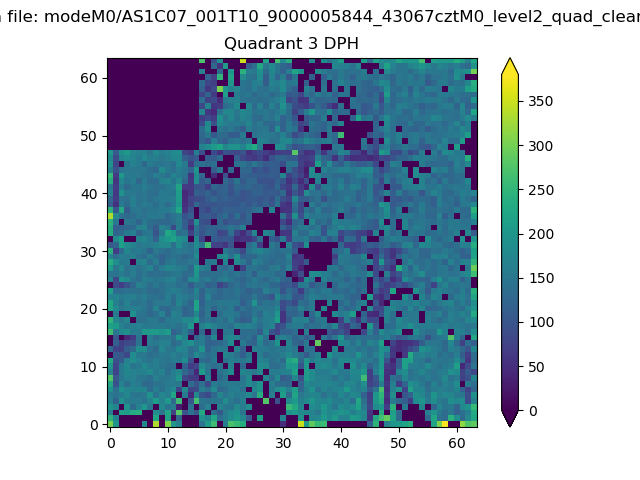 |
 |
Quadrant C |
| Plot type | Count rate plots | Images |
|---|---|---|
| Comparison with Poisson distribution Blue bars denote a histogram of data divided into 1 sec bins. Red curve is a Poisson curve with rate = median count rate of data. |
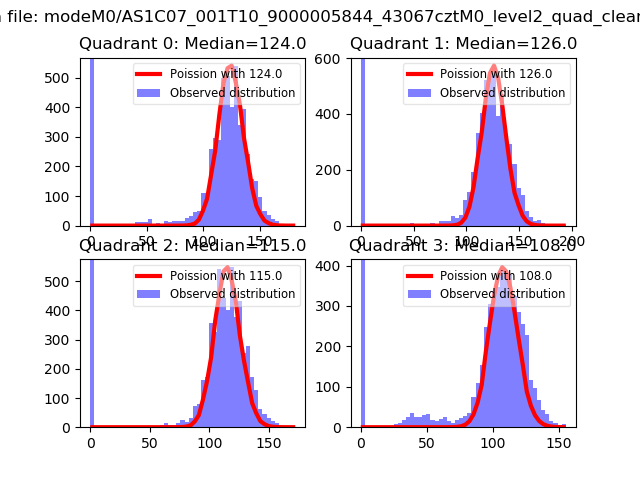 |
 |
| Quadrant-wise count rates Data is divided into 100 sec bins |
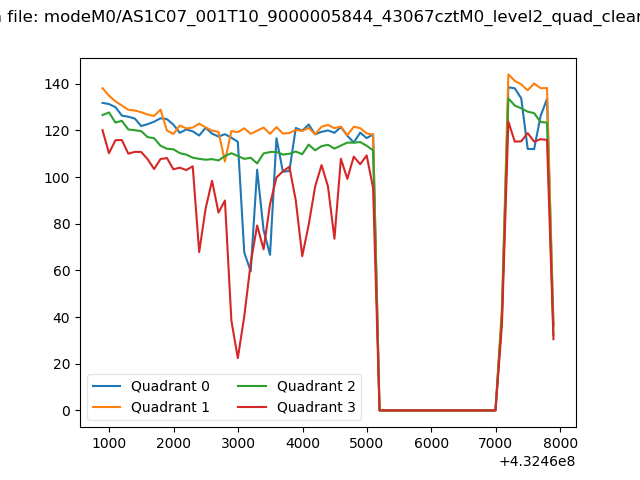 |
|
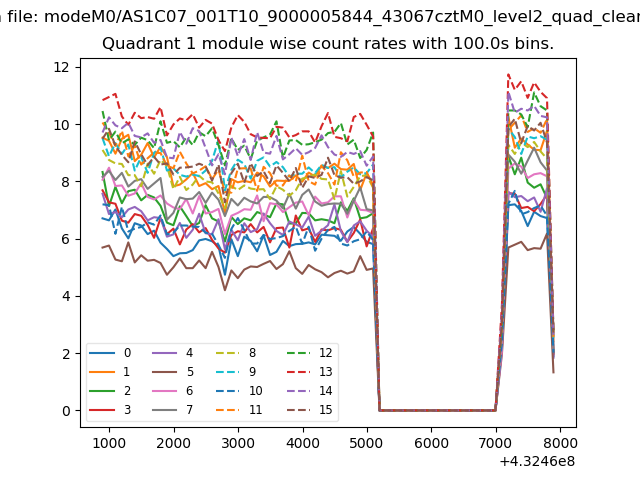
| Module-wise count rates for Quadrant A Data is divided into 100 sec bins |
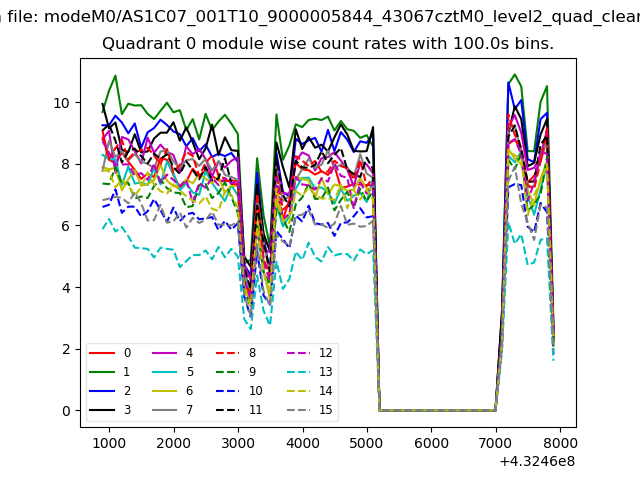 |
 |
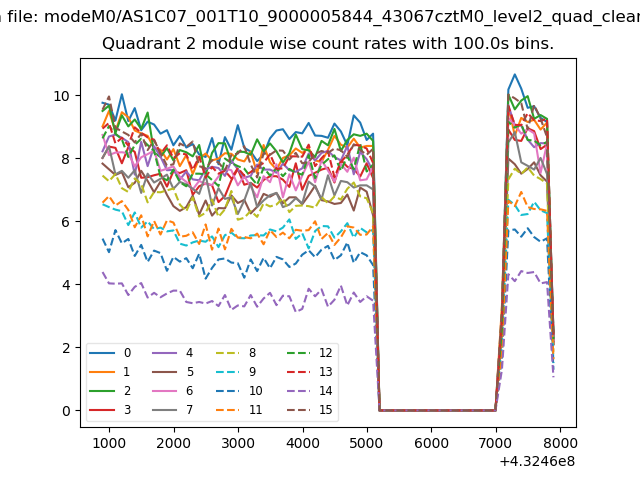
| Module-wise count rates for Quadrant B Data is divided into 100 sec bins |
 |
 |
| Module-wise count rates for Quadrant C Data is divided into 100 sec bins |
 |
 |
| Module-wise count rates for Quadrant D Data is divided into 100 sec bins |
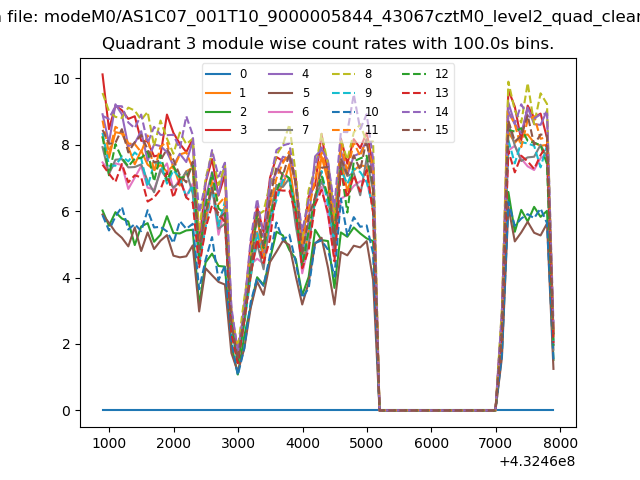 |
 |
| Parameter | Plot |
|---|---|
| CZT HV Monitor | 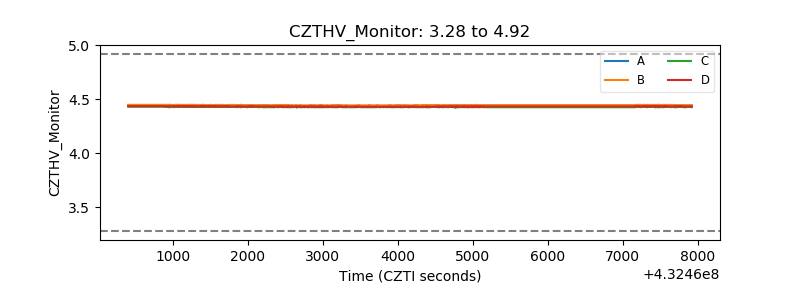 |
| D_VDD | 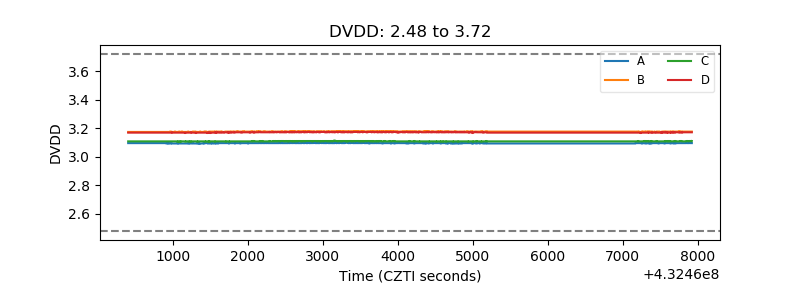 |
| Temperature 1 | 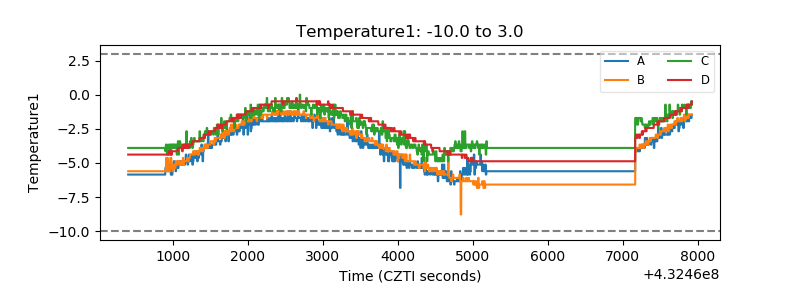 |
| Veto HV Monitor | 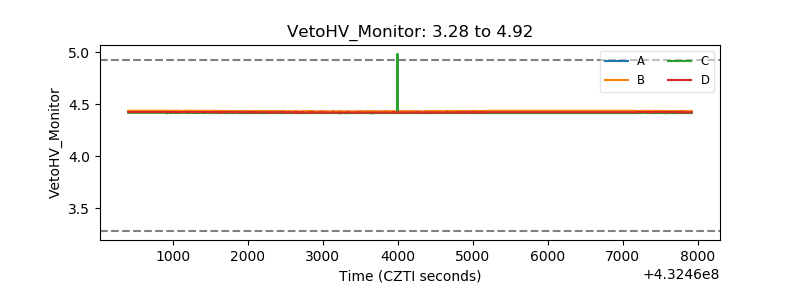 |
| Veto LLD | 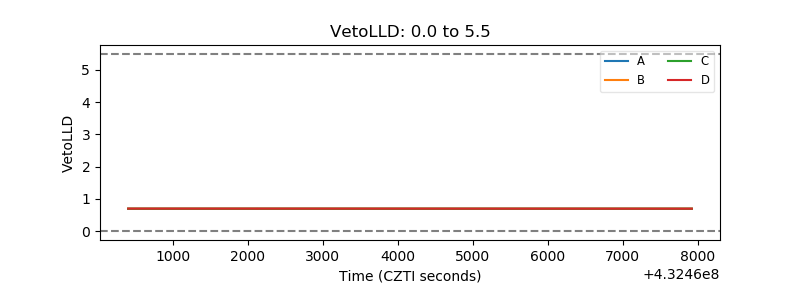 |
| Alpha Counter | 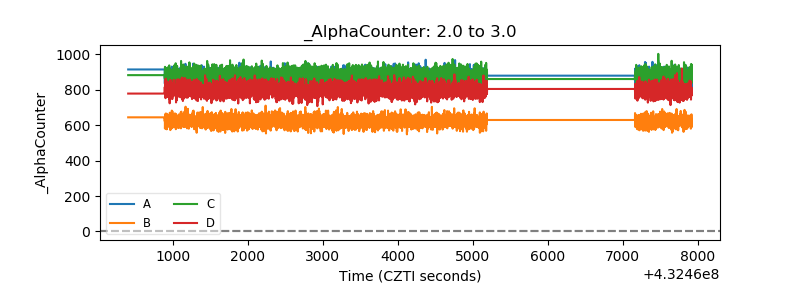 |
| _CPM_Rate | 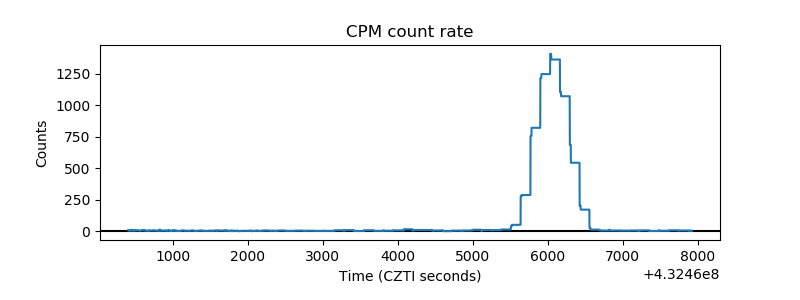 |
| CZT Counter | 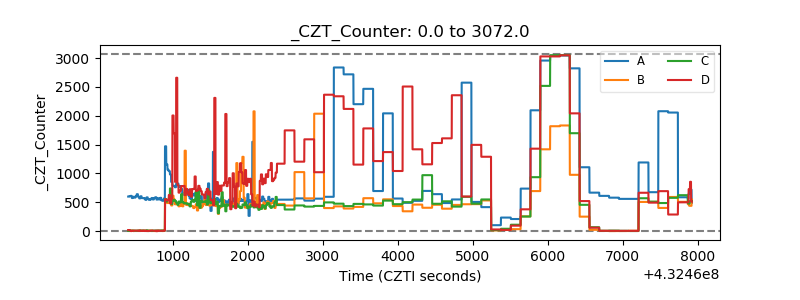 |
| +2.5 Volts monitor | 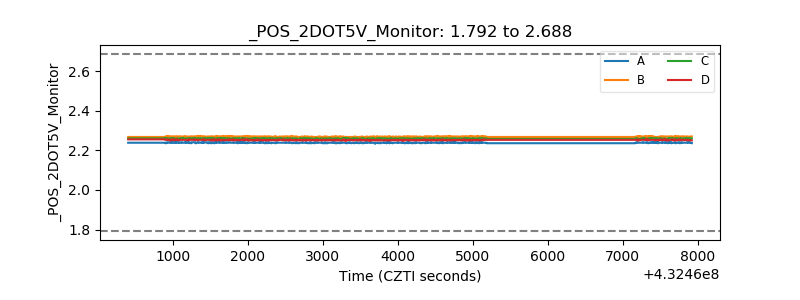 |
| +5 Volts monitor | 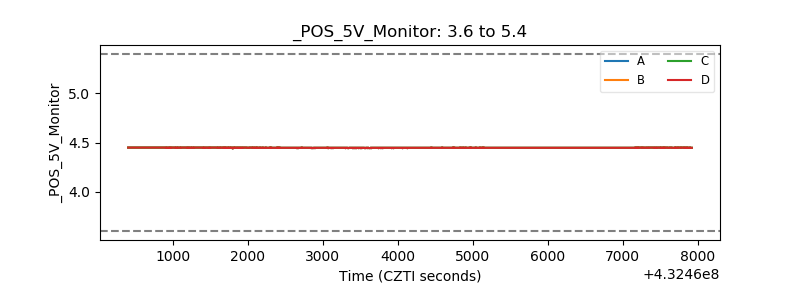 |
| _ROLL_ROT | 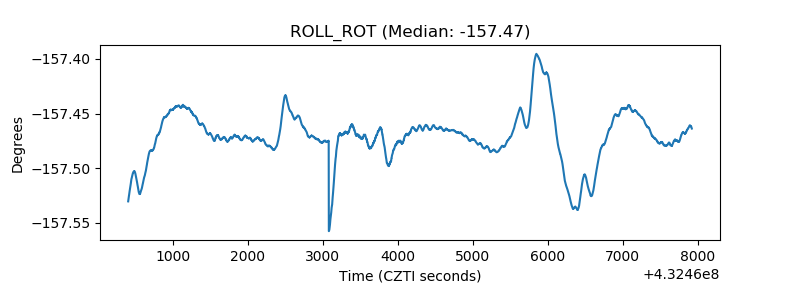 |
| _Roll_DEC | 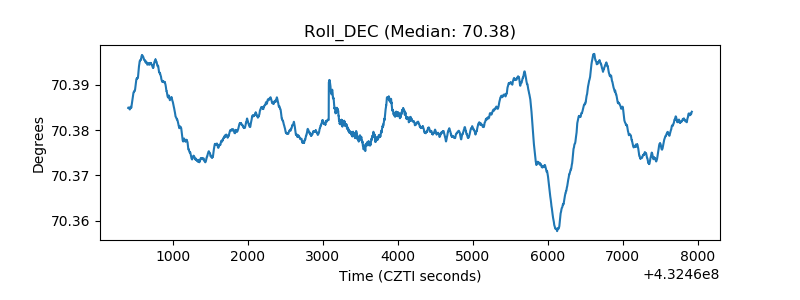 |
| _Roll_RA | 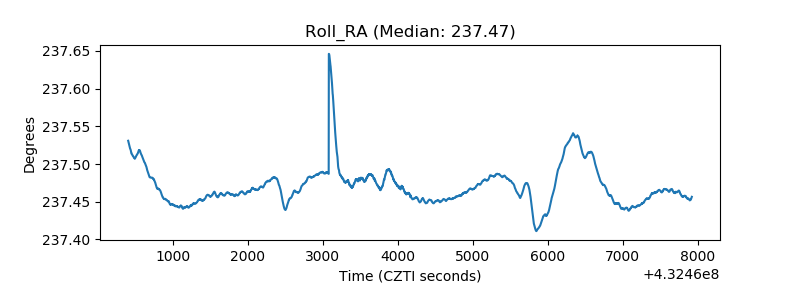 |
| Veto Counter | 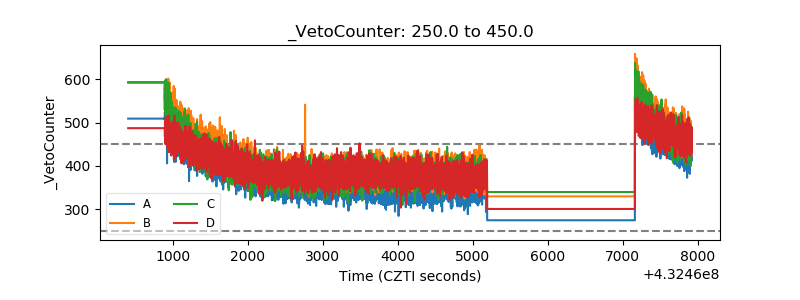 |