| Param | Original file | Final file |
|---|---|---|
| Filename | modeM0/AS1C07_001T10_9000005844_43068cztM0_level2.fits | modeM0/AS1C07_001T10_9000005844_43068cztM0_level2_quad_clean.evt |
| Size (bytes) | 381,663,360 | 88,508,160 |
| Size | 364.0 MB | 84.4 MB |
| Events in quadrant A | 3,355,871 | 621,786 |
| Events in quadrant B | 3,024,348 | 612,048 |
| Events in quadrant C | 2,466,365 | 579,804 |
| Events in quadrant D | 4,898,273 | 521,058 |
| Mode SS | |||
|---|---|---|---|
| Quadrant | BADHDUFLAG | Total packets | Discarded packets |
| A | 0 | 100 | 0 |
| B | 0 | 100 | 0 |
| C | 0 | 100 | 0 |
| D | 0 | 100 | 0 |
| Mode M9 | |||
|---|---|---|---|
| Quadrant | BADHDUFLAG | Total packets | Discarded packets |
| A | 0 | 21 | 0 |
| B | 0 | 22 | 0 |
| C | 0 | 22 | 0 |
| D | 0 | 22 | 0 |
| Mode M0 | |||
|---|---|---|---|
| Quadrant | BADHDUFLAG | Total packets | Discarded packets |
| A | 0 | 13127 | 4 |
| B | 0 | 12122 | 2 |
| C | 0 | 10122 | 2 |
| D | 0 | 17885 | 2 |
| Quadrant | Total seconds | Saturated seconds | Saturation percentage |
|---|---|---|---|
| A | 4925 | 116 | 2.355330% |
| B | 4925 | 215 | 4.365482% |
| C | 4925 | 5 | 0.101523% |
| D | 4925 | 434 | 8.812183% |
Noise dominated data is calculated using 1-second bins in cleaned event files. If a bin has >2000 counts, and if more than 50% of those come from <1% of pixels, then it is considered to be noise-dominated and hence unusable.
| Quadrant | # 1 sec bins | Bins with >0 counts | Bins with >2000 counts | High rate bins dominated by noise | Noise dominated (total time) | Noise dominated (detector-on time) | Marked lightcurve |
|---|---|---|---|---|---|---|---|
| A | 7016 | 4926 | 74 | 74 | 1.05% | 1.50% | 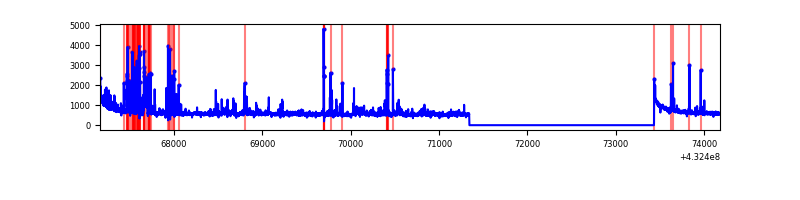 |
| B | 7016 | 4926 | 123 | 123 | 1.75% | 2.50% | 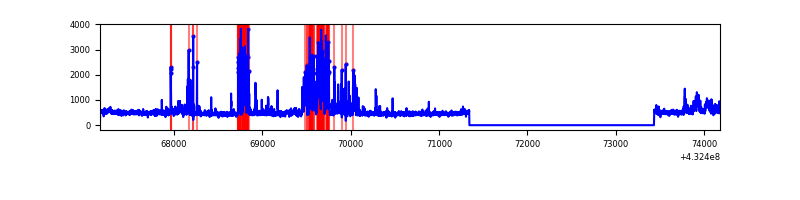 |
| C | 7016 | 4926 | 2 | 2 | 0.03% | 0.04% | 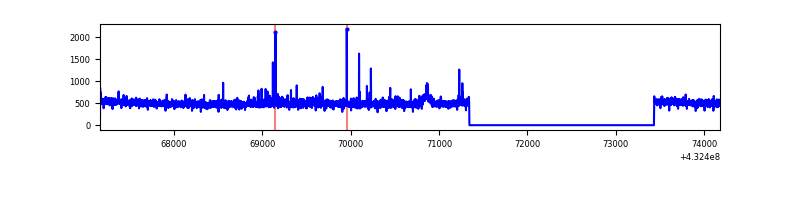 |
| D | 7016 | 4926 | 351 | 351 | 5.00% | 7.13% | 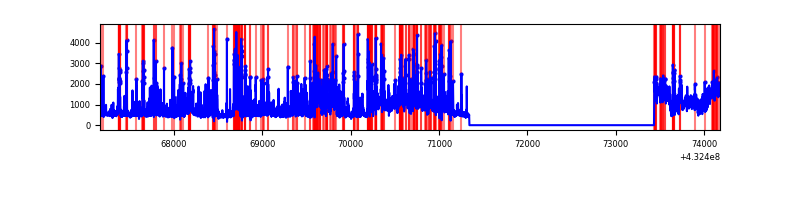 |
Top three noisy pixels from each quadrant. If the there are fewer than three noisy pixels in the level2.evt file, extra rows are filled as -1
| Pixel properties | Quadrant properties | ||||||
|---|---|---|---|---|---|---|---|
| Quadrant | DetID | PixID | Counts | Sigma | Mean | Median | Sigma |
| A | 10 | 83 | 596145 | 5164.99 | 569 | 556 | 115.3 |
| A | 15 | 222 | 198621 | 1717.63 | 569 | 556 | 115.3 |
| A | 15 | 237 | 190789 | 1649.71 | 569 | 556 | 115.3 |
| B | 0 | 229 | 659000 | 6315.26 | 552 | 539 | 104.3 |
| B | 0 | 155 | 51332 | 487.15 | 552 | 539 | 104.3 |
| B | 4 | 171 | 34662 | 327.27 | 552 | 539 | 104.3 |
| C | 15 | 214 | 225119 | 1793.58 | 545 | 549 | 125.2 |
| C | 1 | 128 | 57929 | 458.28 | 545 | 549 | 125.2 |
| C | 0 | 207 | 20464 | 159.06 | 545 | 549 | 125.2 |
| D | 1 | 52 | 993983 | 7677.97 | 538 | 526 | 129.4 |
| D | 2 | 16 | 804696 | 6215.06 | 538 | 526 | 129.4 |
| D | 13 | 249 | 634760 | 4901.7 | 538 | 526 | 129.4 |
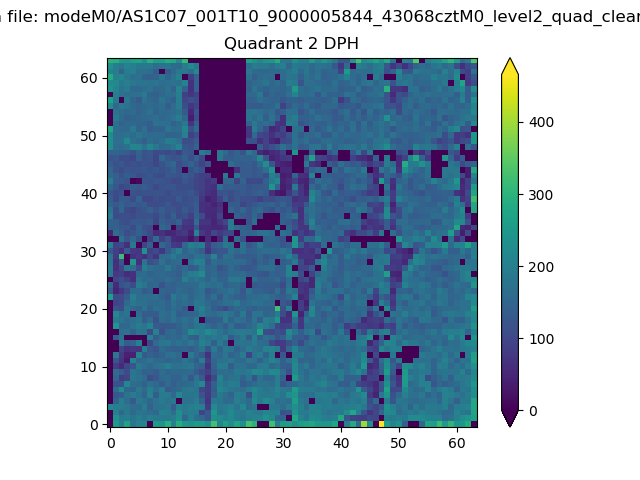
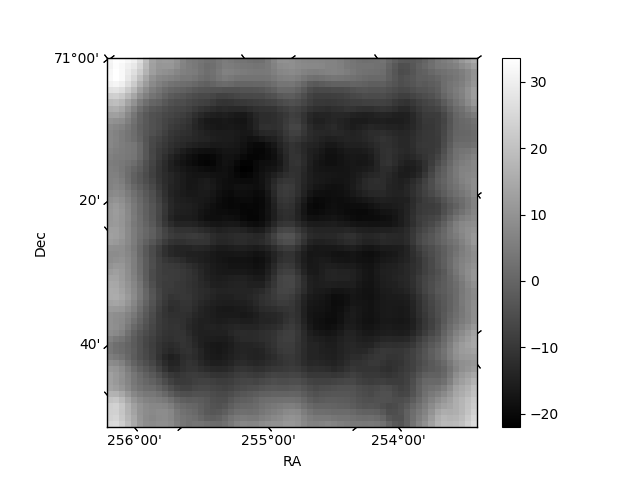
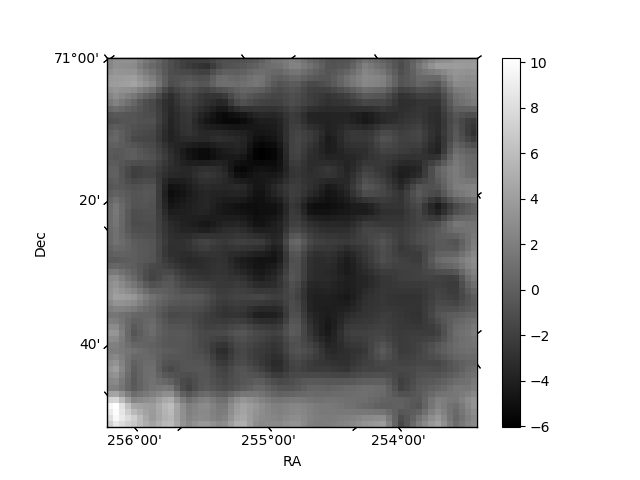
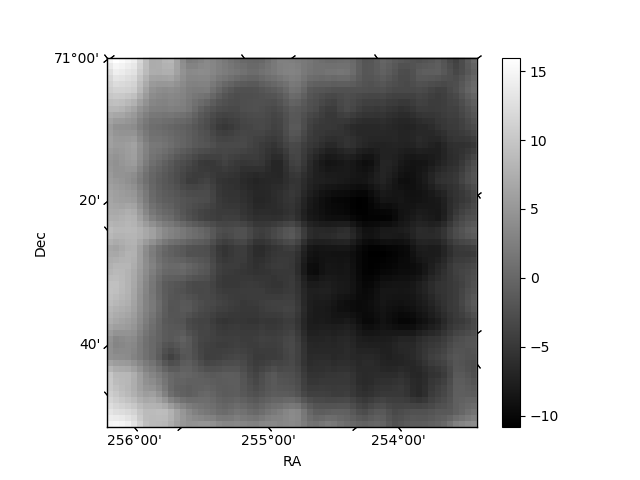
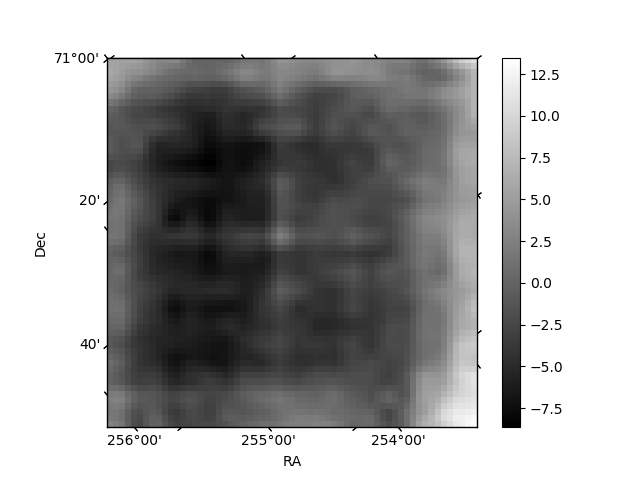
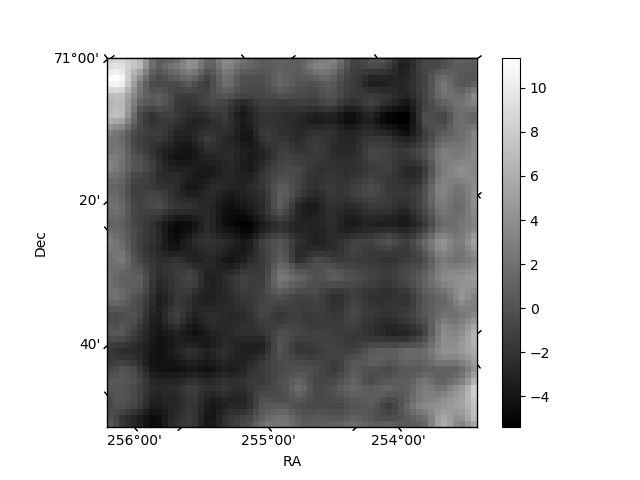
Histogram calculated using DETX and DETY for each event in the final _common_clean file
| Quadrant A | 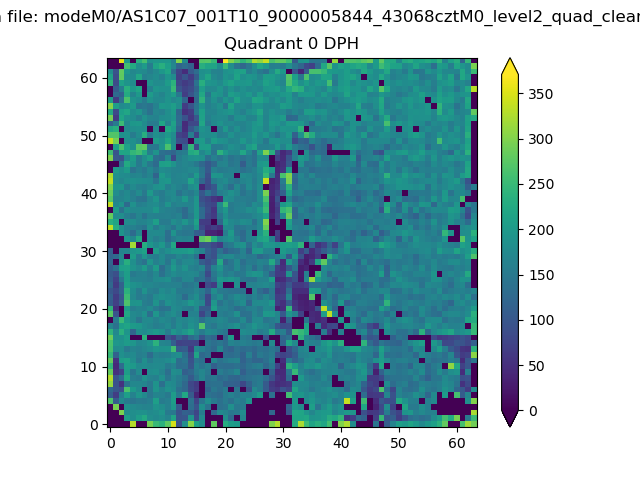 |
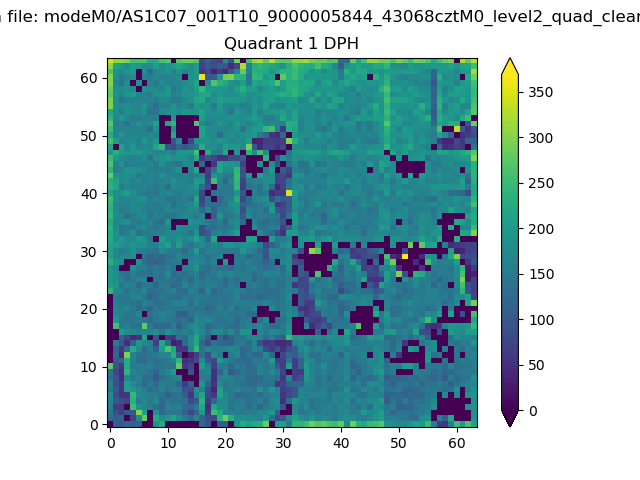 |
Quadrant B |
|---|---|---|---|
| Quadrant D | 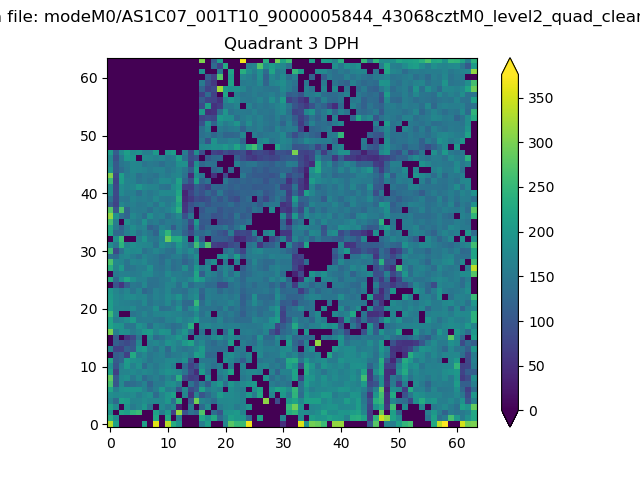 |
 |
Quadrant C |
| Plot type | Count rate plots | Images |
|---|---|---|
| Comparison with Poisson distribution Blue bars denote a histogram of data divided into 1 sec bins. Red curve is a Poisson curve with rate = median count rate of data. |
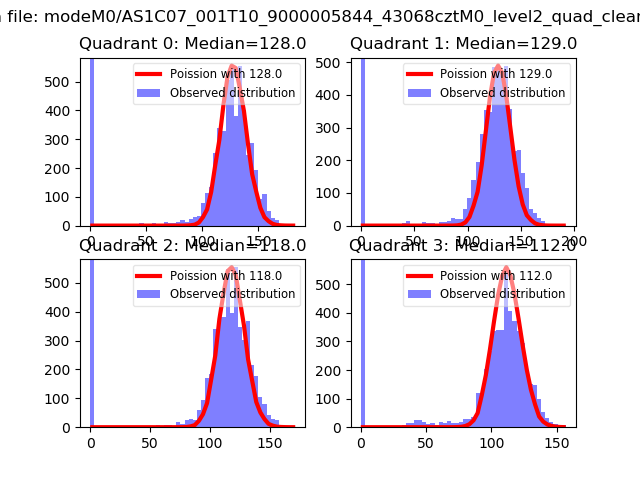 |
 |
| Quadrant-wise count rates Data is divided into 100 sec bins |
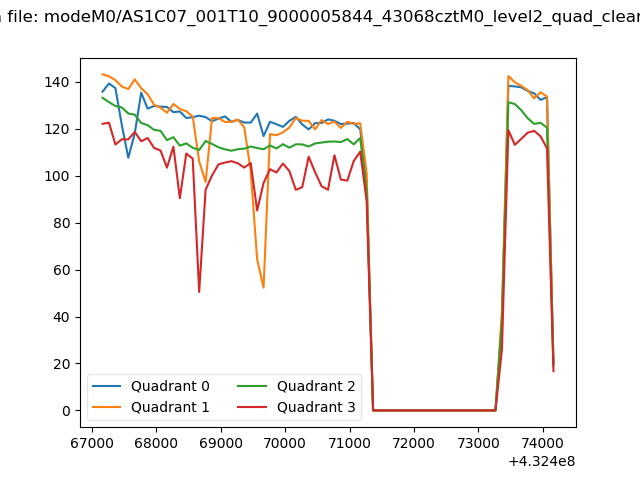 |
|
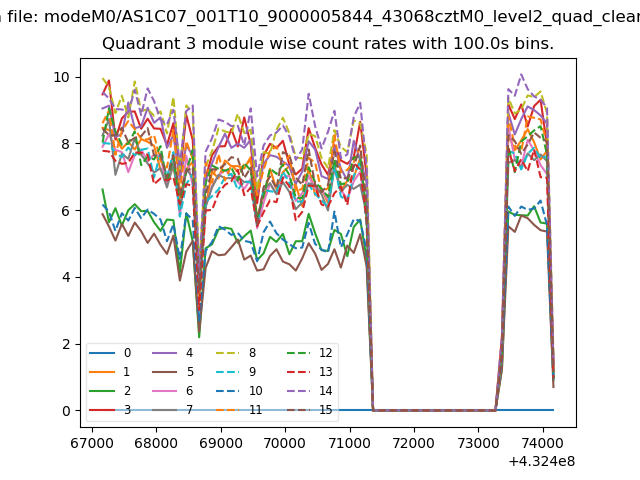
| Module-wise count rates for Quadrant A Data is divided into 100 sec bins |
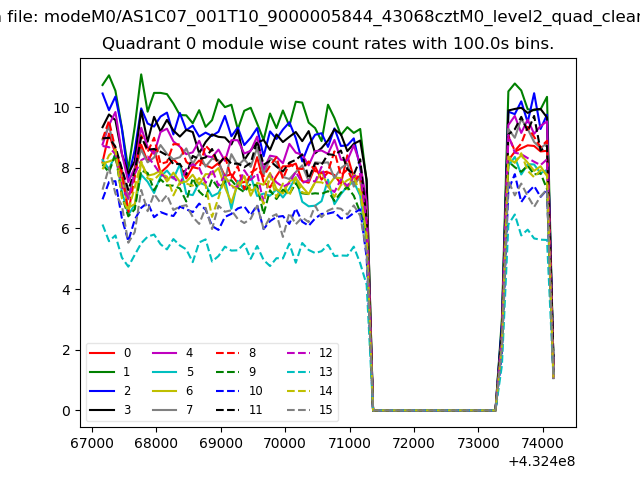 |
 |
| Module-wise count rates for Quadrant B Data is divided into 100 sec bins |
 |
 |
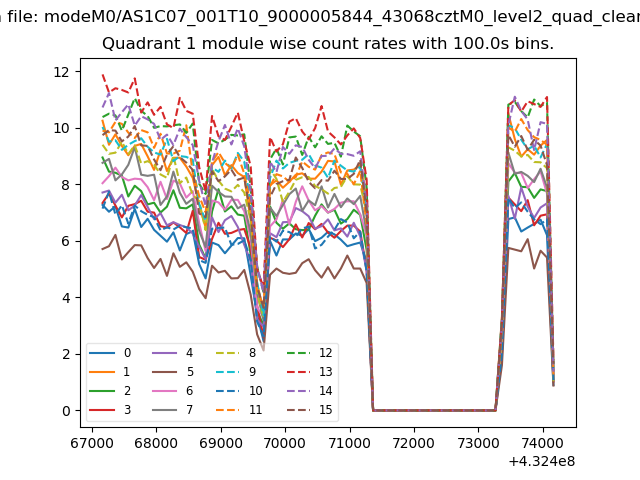
| Module-wise count rates for Quadrant C Data is divided into 100 sec bins |
 |
 |
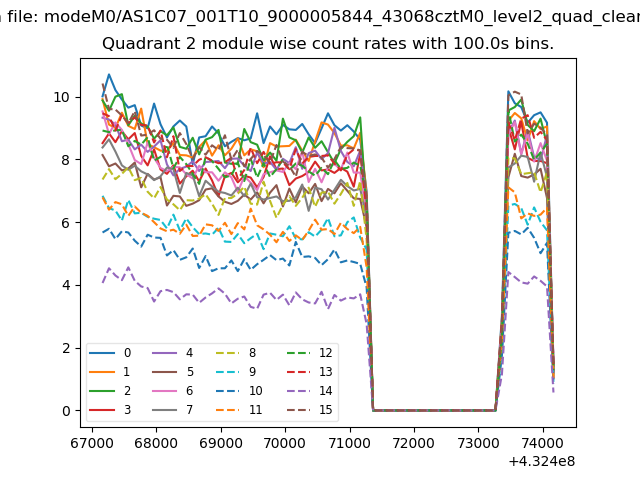
| Module-wise count rates for Quadrant D Data is divided into 100 sec bins |
 |
 |
| Parameter | Plot |
|---|---|
| CZT HV Monitor | 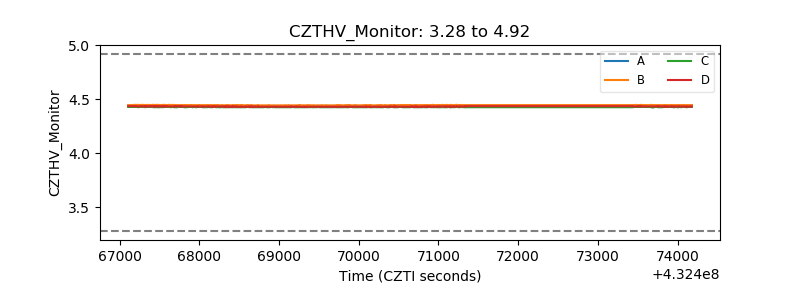 |
| D_VDD | 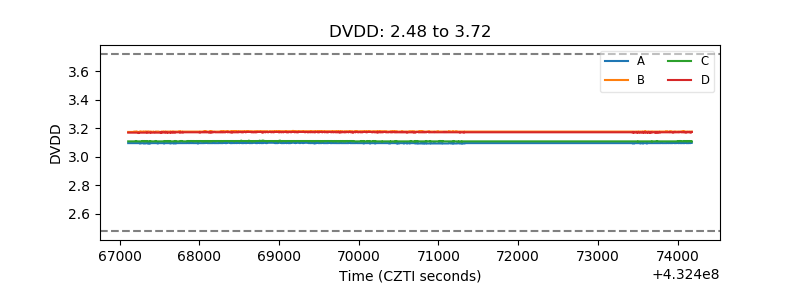 |
| Temperature 1 | 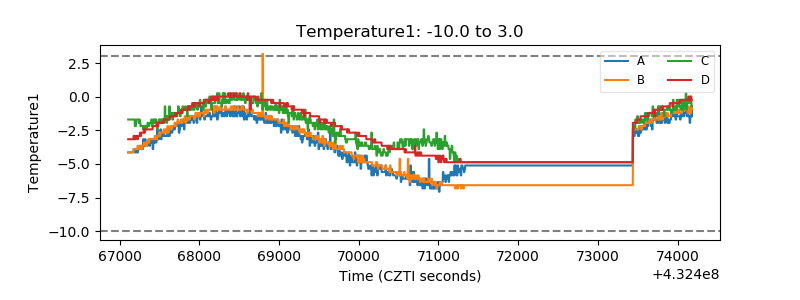 |
| Veto HV Monitor | 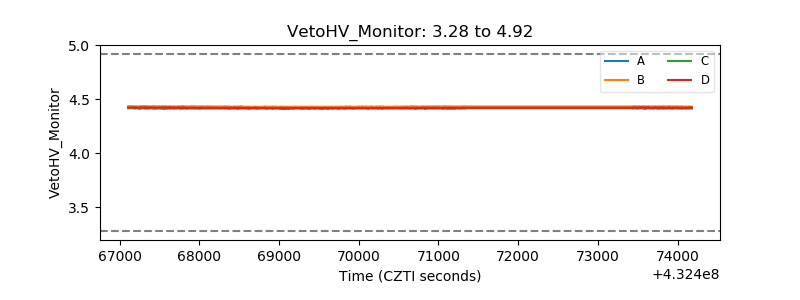 |
| Veto LLD | 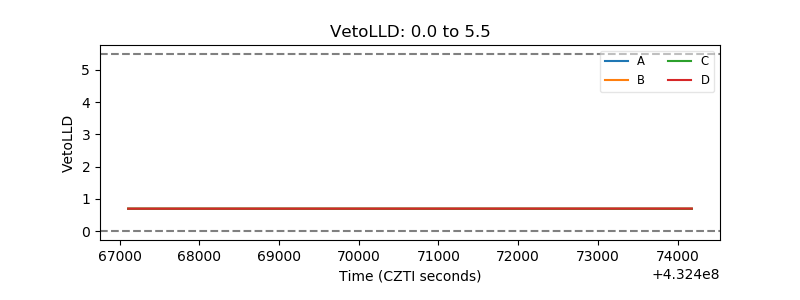 |
| Alpha Counter | 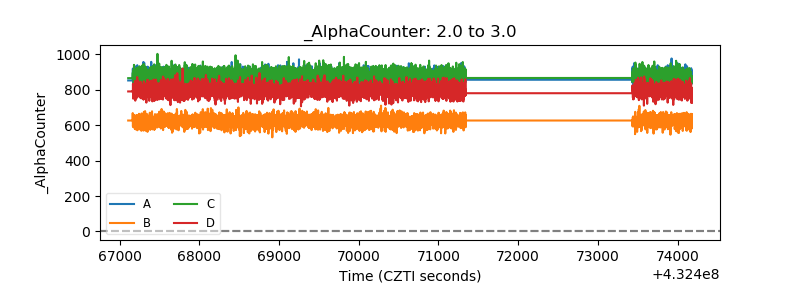 |
| _CPM_Rate | 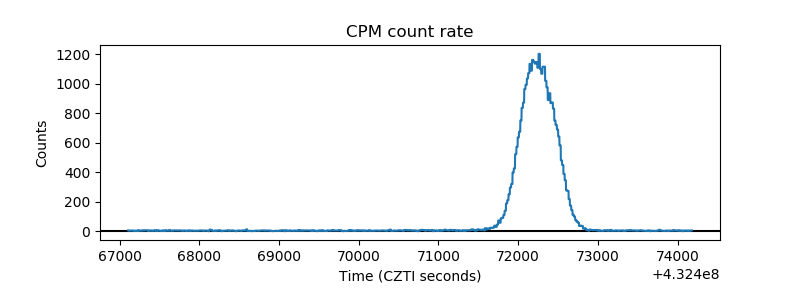 |
| CZT Counter | 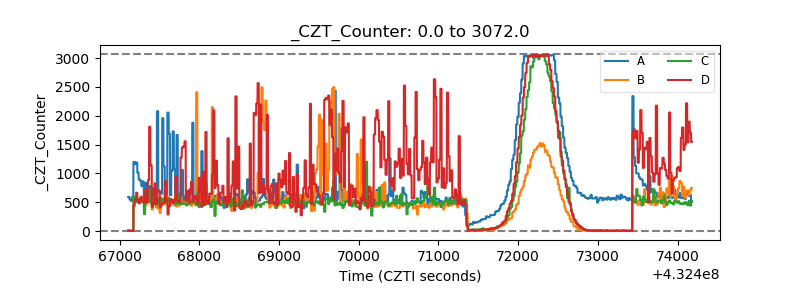 |
| +2.5 Volts monitor | 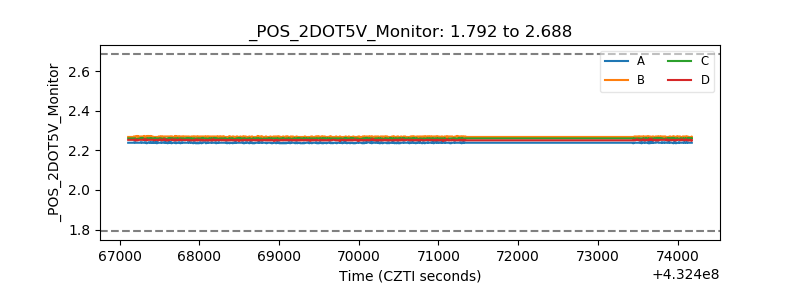 |
| +5 Volts monitor | 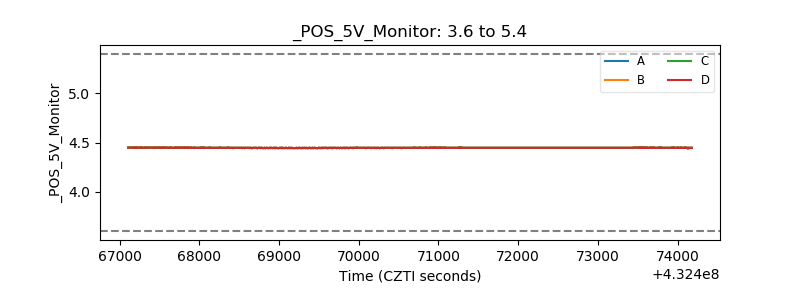 |
| _ROLL_ROT | 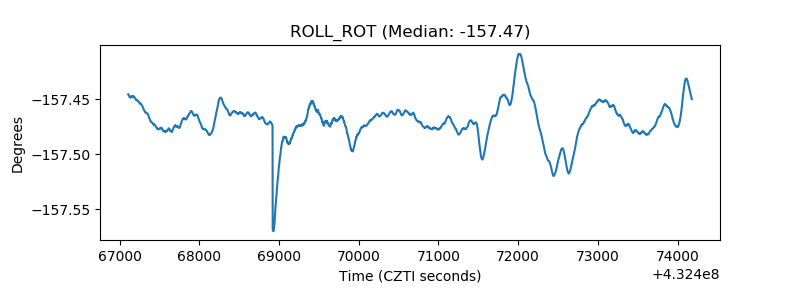 |
| _Roll_DEC | 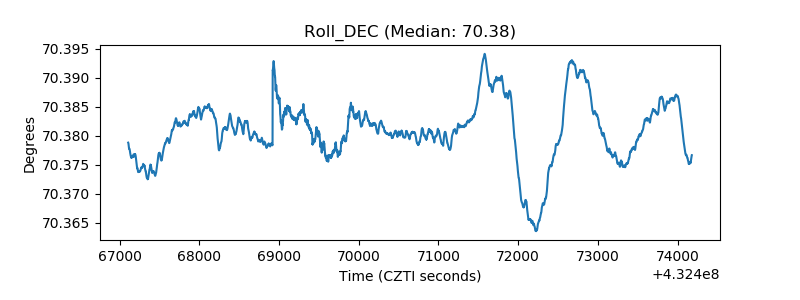 |
| _Roll_RA | 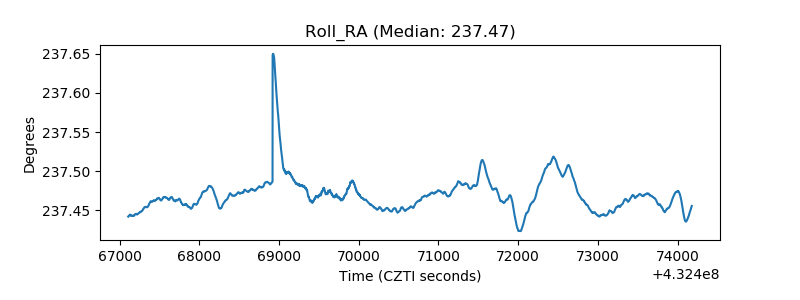 |
| Veto Counter | 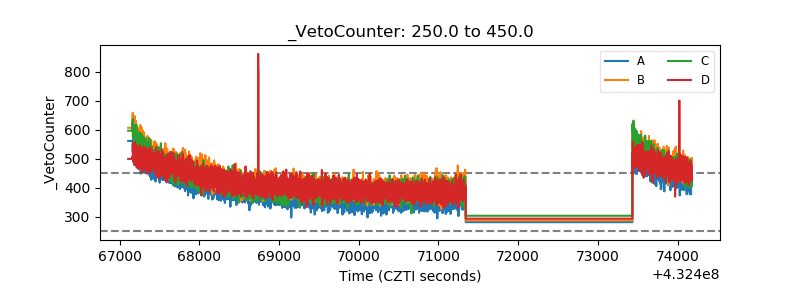 |