| Param | Original file | Final file |
|---|---|---|
| Filename | modeM0/AS1C07_001T10_9000005844_43069cztM0_level2.fits | modeM0/AS1C07_001T10_9000005844_43069cztM0_level2_quad_clean.evt |
| Size (bytes) | 425,295,360 | 90,630,720 |
| Size | 405.6 MB | 86.4 MB |
| Events in quadrant A | 4,085,514 | 628,566 |
| Events in quadrant B | 2,611,207 | 651,943 |
| Events in quadrant C | 2,501,206 | 604,278 |
| Events in quadrant D | 6,141,567 | 495,652 |
| Mode SS | |||
|---|---|---|---|
| Quadrant | BADHDUFLAG | Total packets | Discarded packets |
| A | 0 | 106 | 0 |
| B | 0 | 106 | 0 |
| C | 0 | 106 | 0 |
| D | 0 | 106 | 0 |
| Mode M9 | |||
|---|---|---|---|
| Quadrant | BADHDUFLAG | Total packets | Discarded packets |
| A | 0 | 25 | 0 |
| B | 0 | 26 | 0 |
| C | 0 | 26 | 0 |
| D | 0 | 26 | 0 |
| Mode M0 | |||
|---|---|---|---|
| Quadrant | BADHDUFLAG | Total packets | Discarded packets |
| A | 0 | 15604 | 2 |
| B | 0 | 11161 | 2 |
| C | 0 | 10470 | 2 |
| D | 0 | 21830 | 7 |
| Quadrant | Total seconds | Saturated seconds | Saturation percentage |
|---|---|---|---|
| A | 5192 | 223 | 4.295069% |
| B | 5192 | 36 | 0.693374% |
| C | 5192 | 3 | 0.057781% |
| D | 5191 | 911 | 17.549605% |
Noise dominated data is calculated using 1-second bins in cleaned event files. If a bin has >2000 counts, and if more than 50% of those come from <1% of pixels, then it is considered to be noise-dominated and hence unusable.
| Quadrant | # 1 sec bins | Bins with >0 counts | Bins with >2000 counts | High rate bins dominated by noise | Noise dominated (total time) | Noise dominated (detector-on time) | Marked lightcurve |
|---|---|---|---|---|---|---|---|
| A | 7343 | 5193 | 181 | 181 | 2.46% | 3.49% | 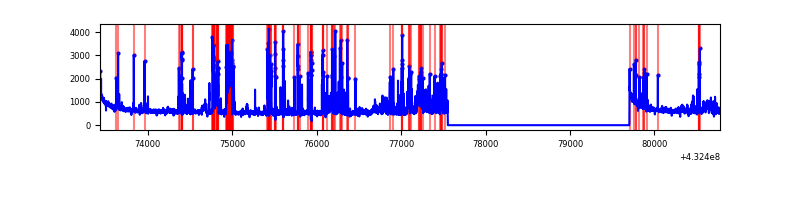 |
| B | 7343 | 5193 | 21 | 21 | 0.29% | 0.40% | 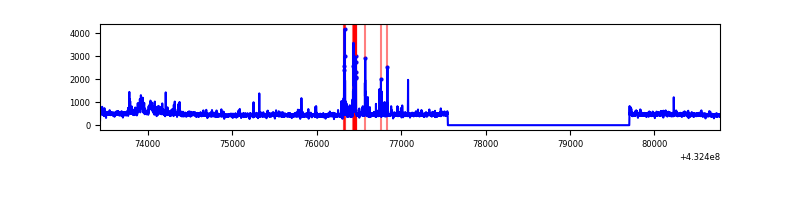 |
| C | 7343 | 5193 | 0 | 0 | 0.00% | 0.00% | 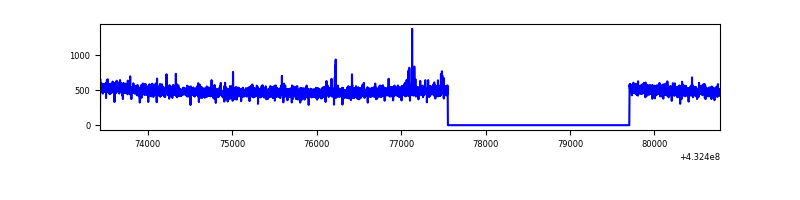 |
| D | 7342 | 5192 | 717 | 717 | 9.77% | 13.81% | 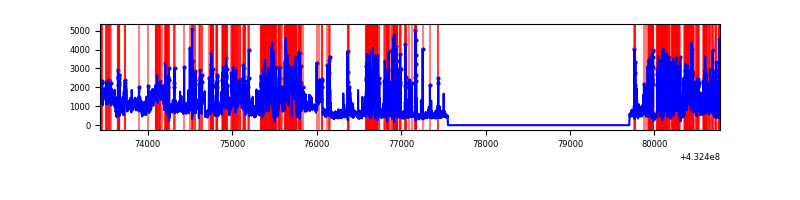 |
Top three noisy pixels from each quadrant. If the there are fewer than three noisy pixels in the level2.evt file, extra rows are filled as -1
| Pixel properties | Quadrant properties | ||||||
|---|---|---|---|---|---|---|---|
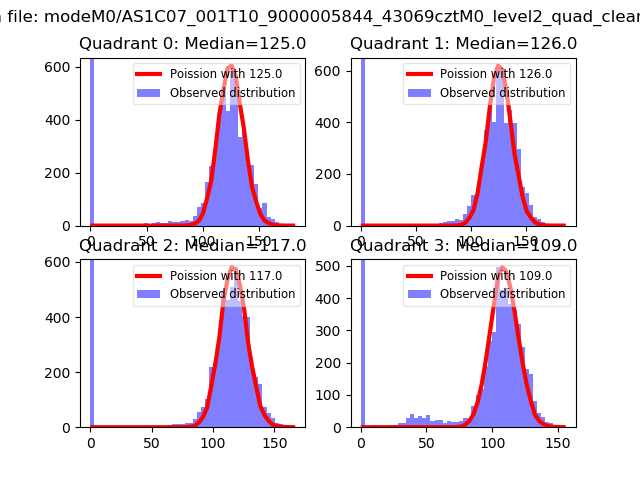
| Quadrant | DetID | PixID | Counts | Sigma | Mean | Median | Sigma |
| A | 10 | 83 | 624164 | 5256.07 | 584 | 573 | 118.6 |
| A | 15 | 237 | 553609 | 4661.38 | 584 | 573 | 118.6 |
| A | 13 | 248 | 343713 | 2892.23 | 584 | 573 | 118.6 |
| B | 5 | 255 | 130535 | 1186.31 | 583 | 570 | 109.6 |
| B | 0 | 229 | 74467 | 674.53 | 583 | 570 | 109.6 |
| B | 0 | 155 | 30445 | 272.7 | 583 | 570 | 109.6 |
| C | 15 | 214 | 234409 | 1782.64 | 570 | 572 | 131.2 |
| C | 1 | 128 | 24070 | 179.14 | 570 | 572 | 131.2 |
| C | 14 | 254 | 6448 | 44.8 | 570 | 572 | 131.2 |
| D | 13 | 249 | 1504200 | 11528.6 | 538 | 523 | 130.4 |
| D | 2 | 16 | 1133789 | 8688.68 | 538 | 523 | 130.4 |
| D | 1 | 52 | 1008781 | 7730.25 | 538 | 523 | 130.4 |
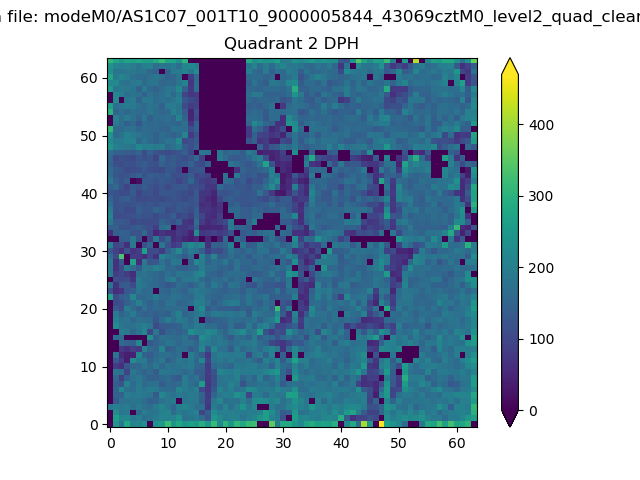
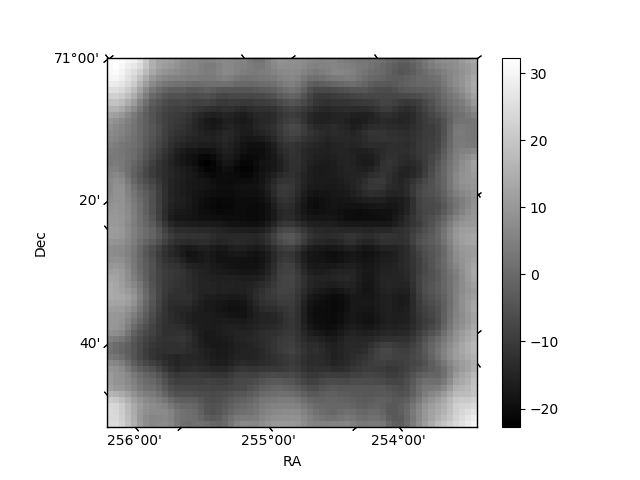
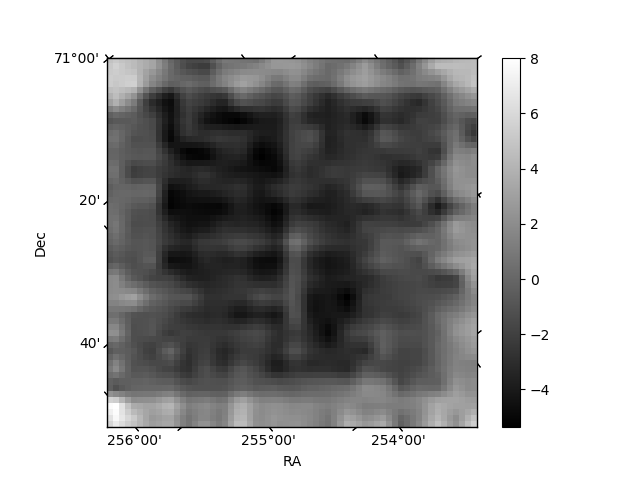
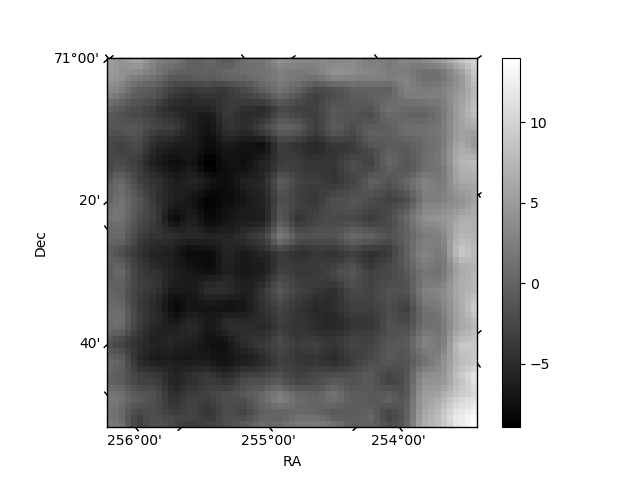
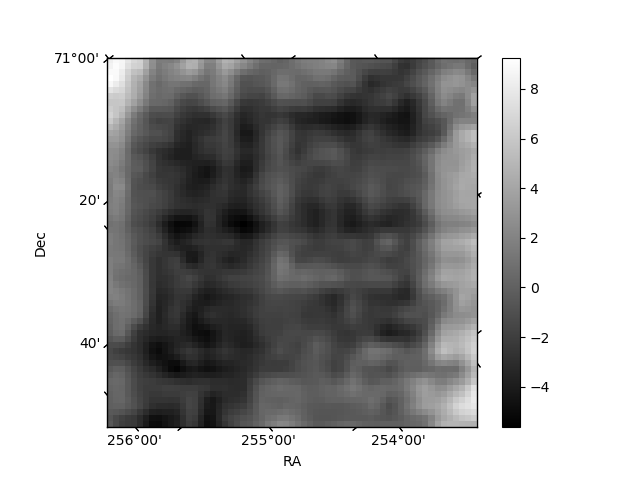
Histogram calculated using DETX and DETY for each event in the final _common_clean file
| Quadrant A | 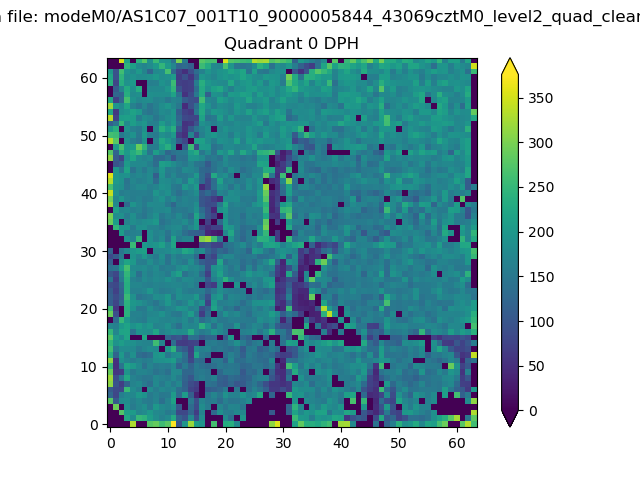 |
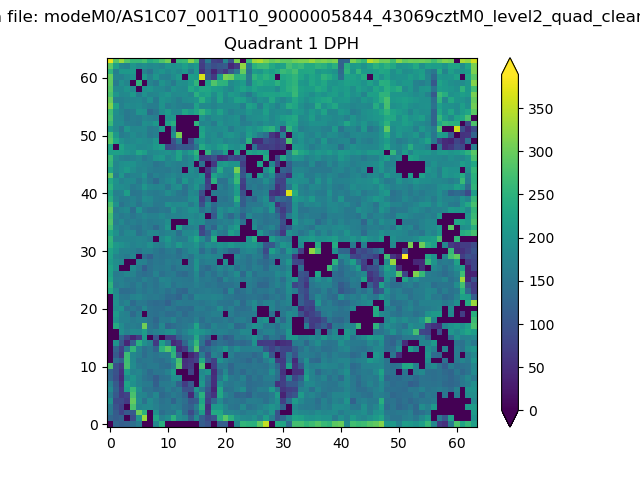 |
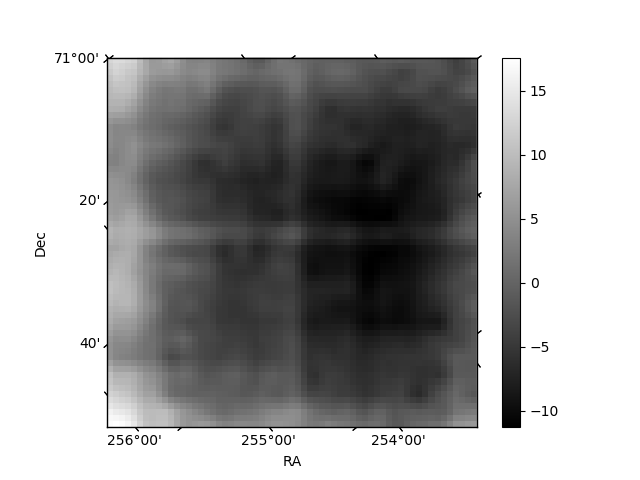
Quadrant B |
|---|---|---|---|
| Quadrant D | 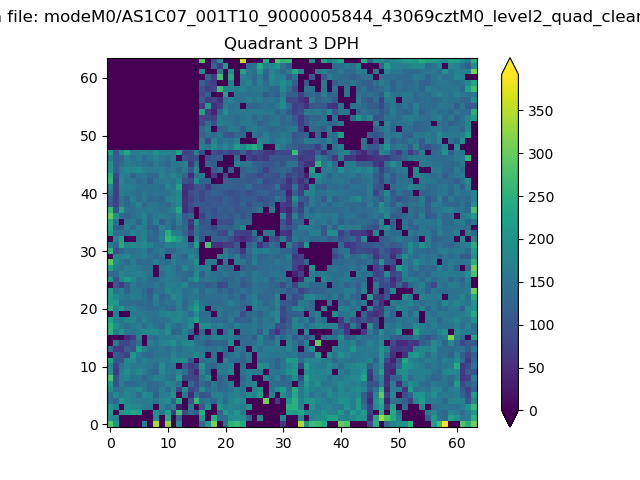 |
 |
Quadrant C |
| Plot type | Count rate plots | Images |
|---|---|---|
| Comparison with Poisson distribution Blue bars denote a histogram of data divided into 1 sec bins. Red curve is a Poisson curve with rate = median count rate of data. |
 |
 |
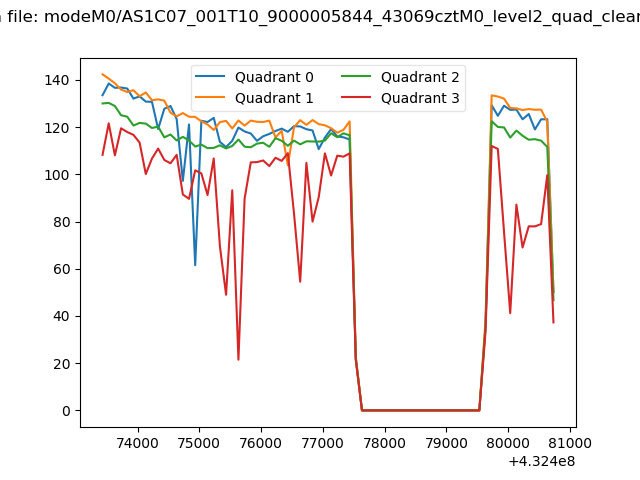
| Quadrant-wise count rates Data is divided into 100 sec bins |
 |
|
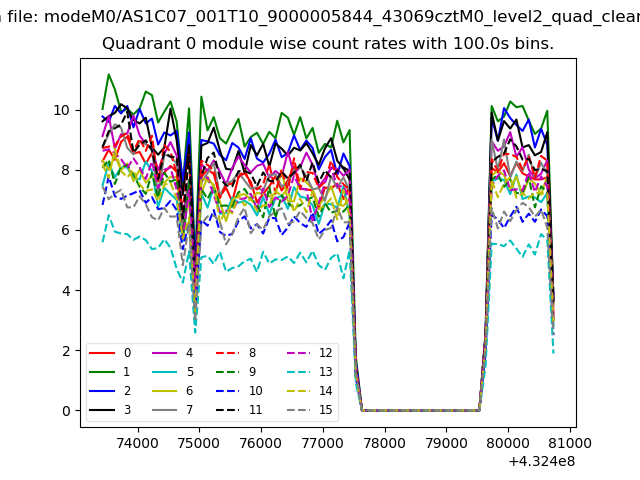
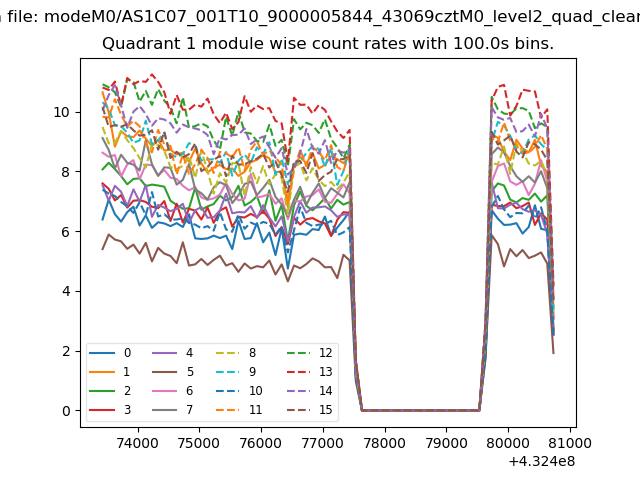
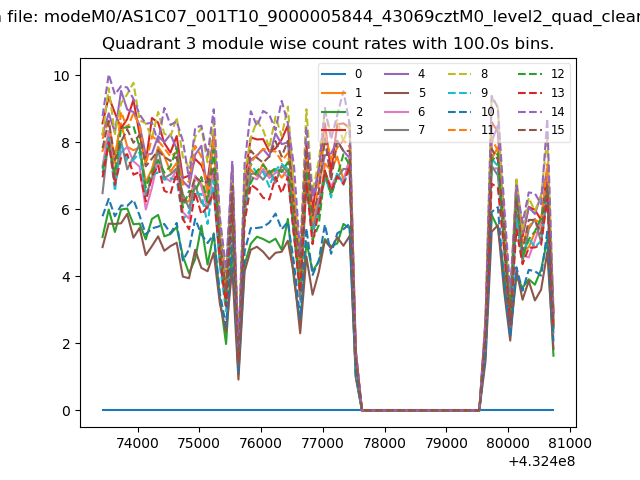
| Module-wise count rates for Quadrant A Data is divided into 100 sec bins |
 |
 |
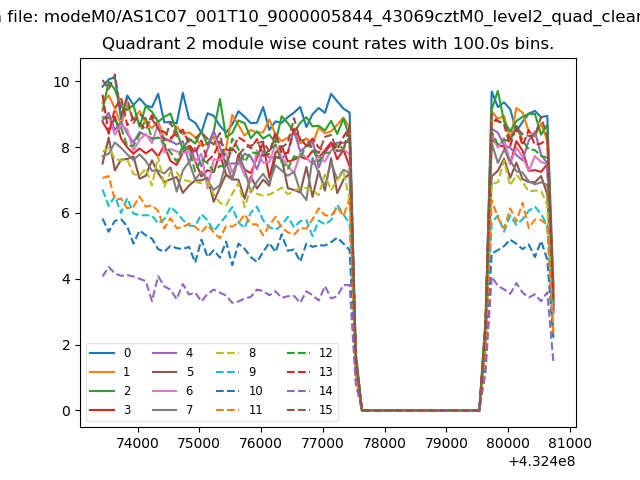
| Module-wise count rates for Quadrant B Data is divided into 100 sec bins |
 |
 |
| Module-wise count rates for Quadrant C Data is divided into 100 sec bins |
 |
 |
| Module-wise count rates for Quadrant D Data is divided into 100 sec bins |
 |
 |
| Parameter | Plot |
|---|---|
| CZT HV Monitor | 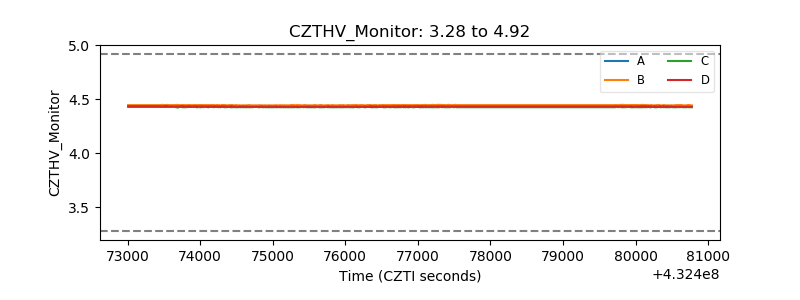 |
| D_VDD | 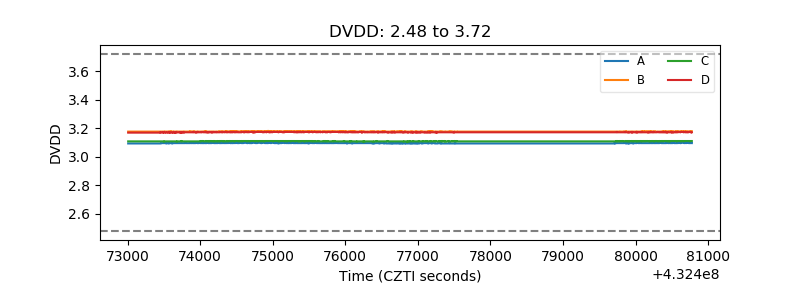 |
| Temperature 1 | 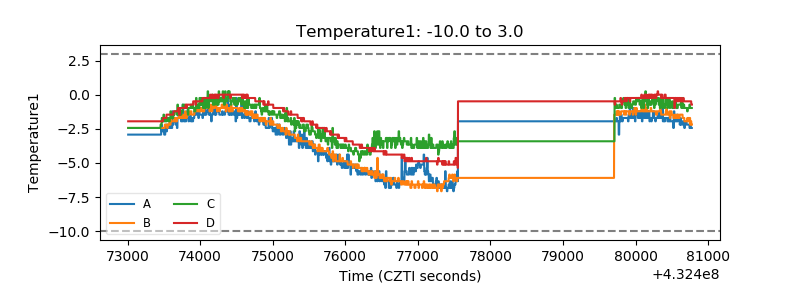 |
| Veto HV Monitor | 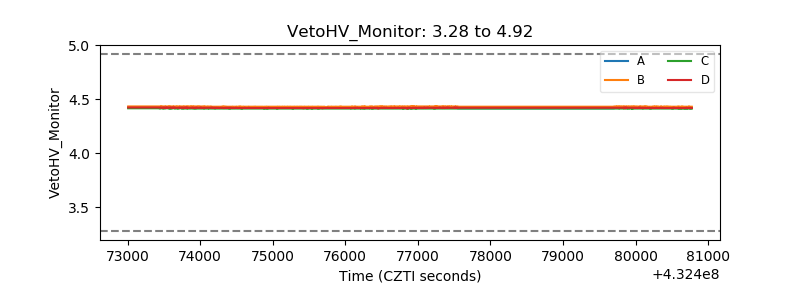 |
| Veto LLD | 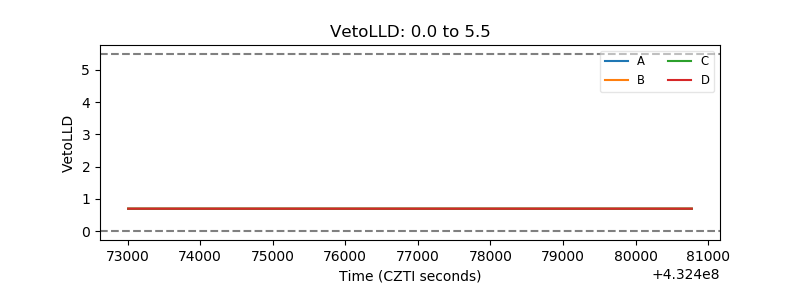 |
| Alpha Counter | 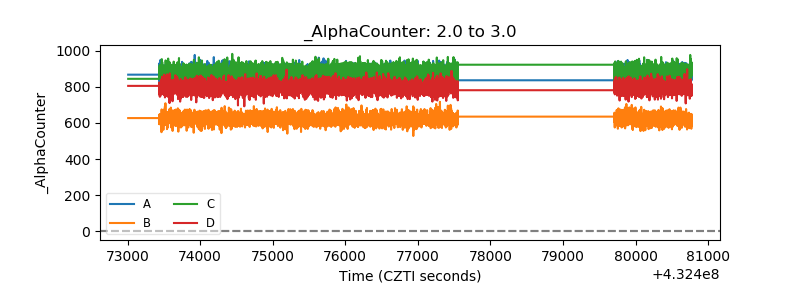 |
| _CPM_Rate | 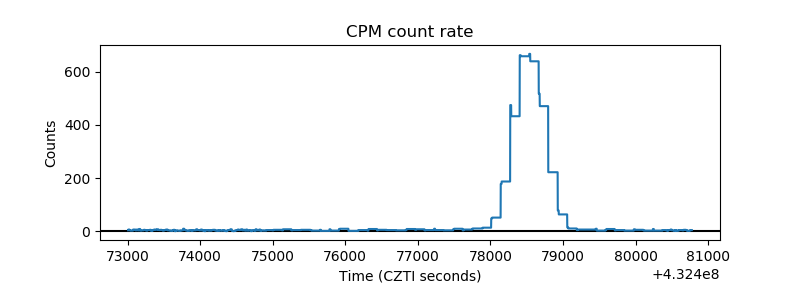 |
| CZT Counter | 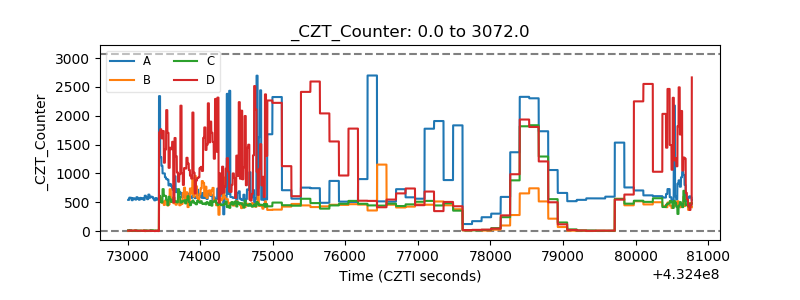 |
| +2.5 Volts monitor | 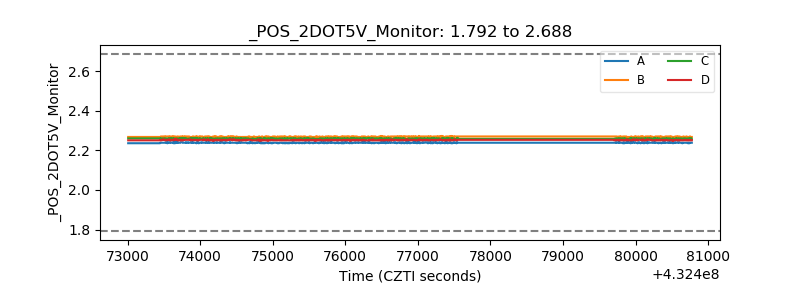 |
| +5 Volts monitor | 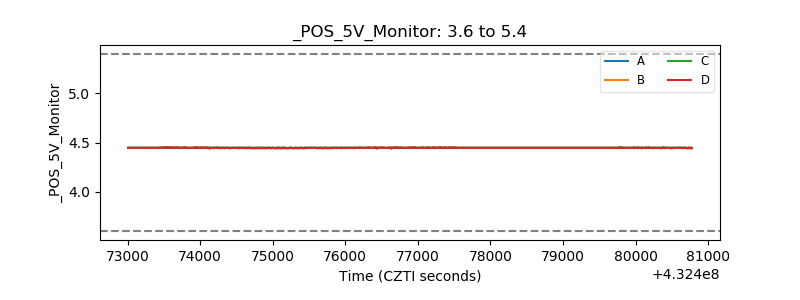 |
| _ROLL_ROT | 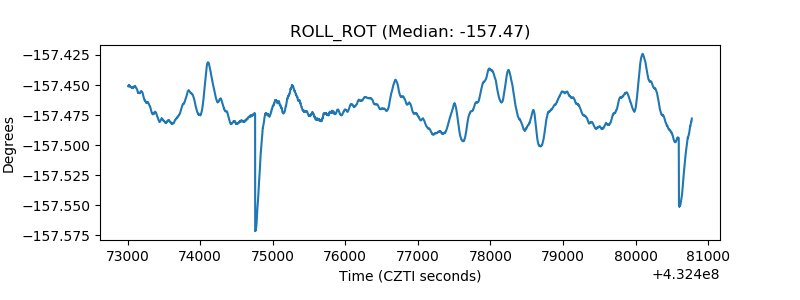 |
| _Roll_DEC | 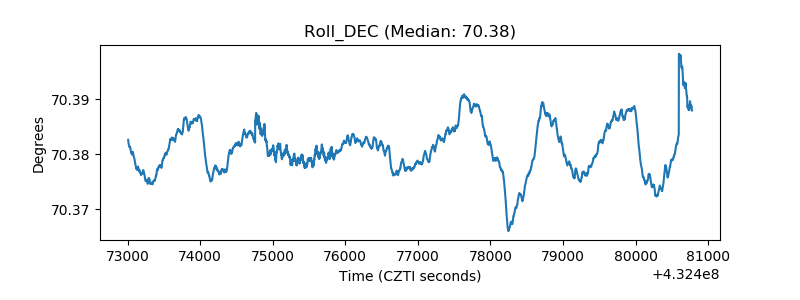 |
| _Roll_RA | 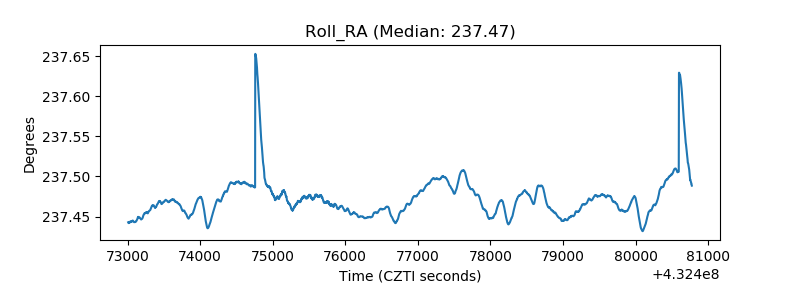 |
| Veto Counter | 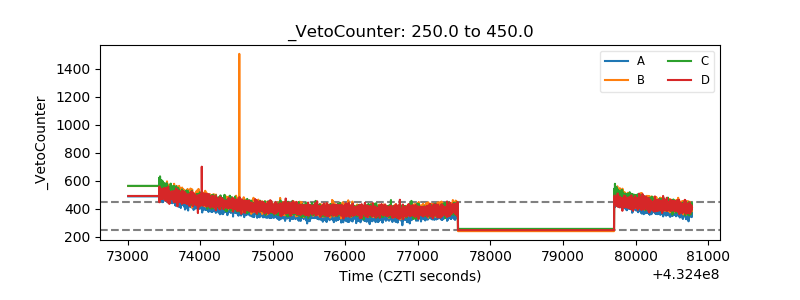 |