| Param | Original file | Final file |
|---|---|---|
| Filename | modeM0/AS1C07_001T10_9000005844_43070cztM0_level2.fits | modeM0/AS1C07_001T10_9000005844_43070cztM0_level2_quad_clean.evt |
| Size (bytes) | 395,403,840 | 82,330,560 |
| Size | 377.1 MB | 78.5 MB |
| Events in quadrant A | 3,620,019 | 566,338 |
| Events in quadrant B | 3,096,677 | 577,082 |
| Events in quadrant C | 2,380,563 | 557,518 |
| Events in quadrant D | 5,151,308 | 442,253 |
| Mode SS | |||
|---|---|---|---|
| Quadrant | BADHDUFLAG | Total packets | Discarded packets |
| A | 0 | 102 | 0 |
| B | 0 | 102 | 0 |
| C | 0 | 102 | 0 |
| D | 0 | 102 | 0 |
| Mode M9 | |||
|---|---|---|---|
| Quadrant | BADHDUFLAG | Total packets | Discarded packets |
| A | 0 | 21 | 0 |
| B | 0 | 21 | 0 |
| C | 0 | 21 | 0 |
| D | 0 | 21 | 0 |
| Mode M0 | |||
|---|---|---|---|
| Quadrant | BADHDUFLAG | Total packets | Discarded packets |
| A | 0 | 14032 | 1 |
| B | 0 | 12512 | 1 |
| C | 0 | 10116 | 1 |
| D | 0 | 18817 | 1 |
| Quadrant | Total seconds | Saturated seconds | Saturation percentage |
|---|---|---|---|
| A | 4983 | 234 | 4.695966% |
| B | 4983 | 235 | 4.716035% |
| C | 4984 | 5 | 0.100321% |
| D | 4984 | 968 | 19.422151% |
Noise dominated data is calculated using 1-second bins in cleaned event files. If a bin has >2000 counts, and if more than 50% of those come from <1% of pixels, then it is considered to be noise-dominated and hence unusable.
| Quadrant | # 1 sec bins | Bins with >0 counts | Bins with >2000 counts | High rate bins dominated by noise | Noise dominated (total time) | Noise dominated (detector-on time) | Marked lightcurve |
|---|---|---|---|---|---|---|---|
| A | 7076 | 4984 | 204 | 204 | 2.88% | 4.09% | 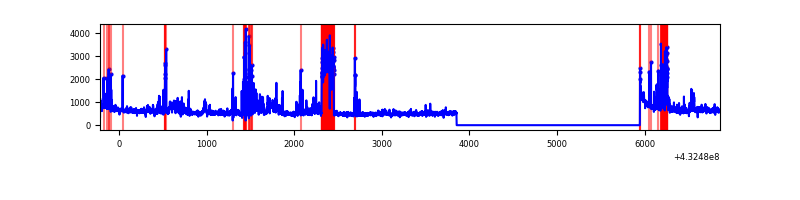 |
| B | 7076 | 4984 | 184 | 184 | 2.60% | 3.69% | 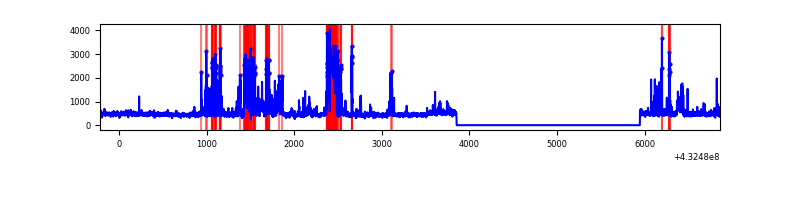 |
| C | 7077 | 4985 | 2 | 2 | 0.03% | 0.04% | 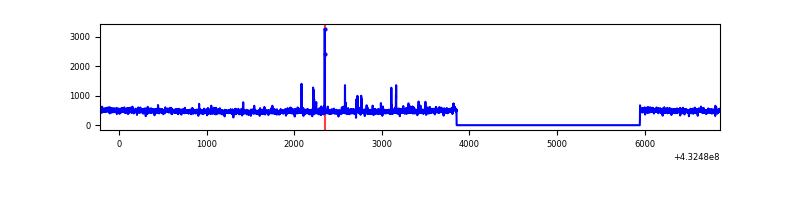 |
| D | 7077 | 4985 | 735 | 735 | 10.39% | 14.74% | 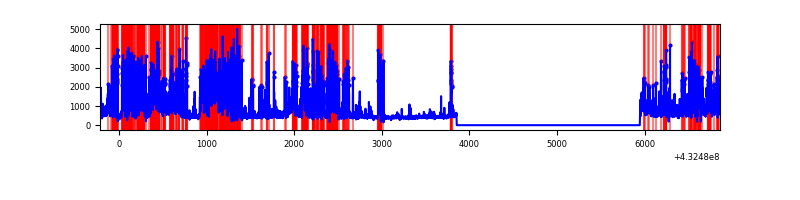 |
Top three noisy pixels from each quadrant. If the there are fewer than three noisy pixels in the level2.evt file, extra rows are filled as -1
| Pixel properties | Quadrant properties | ||||||
|---|---|---|---|---|---|---|---|
| Quadrant | DetID | PixID | Counts | Sigma | Mean | Median | Sigma |
| A | 15 | 237 | 701443 | 6359.14 | 537 | 525 | 110.2 |
| A | 10 | 83 | 553832 | 5019.92 | 537 | 525 | 110.2 |
| A | 12 | 189 | 261995 | 2372.21 | 537 | 525 | 110.2 |
| B | 5 | 255 | 816335 | 8124.29 | 533 | 519 | 100.4 |
| B | 0 | 229 | 117375 | 1163.71 | 533 | 519 | 100.4 |
| B | 0 | 245 | 18471 | 178.77 | 533 | 519 | 100.4 |
| C | 15 | 214 | 222903 | 1801.21 | 534 | 538 | 123.5 |
| C | 1 | 128 | 25062 | 198.65 | 534 | 538 | 123.5 |
| C | 14 | 254 | 19663 | 154.92 | 534 | 538 | 123.5 |
| D | 13 | 249 | 1763295 | 14665.45 | 491 | 478 | 120.2 |
| D | 1 | 52 | 1081481 | 8993.22 | 491 | 478 | 120.2 |
| D | 2 | 249 | 227992 | 1892.76 | 491 | 478 | 120.2 |
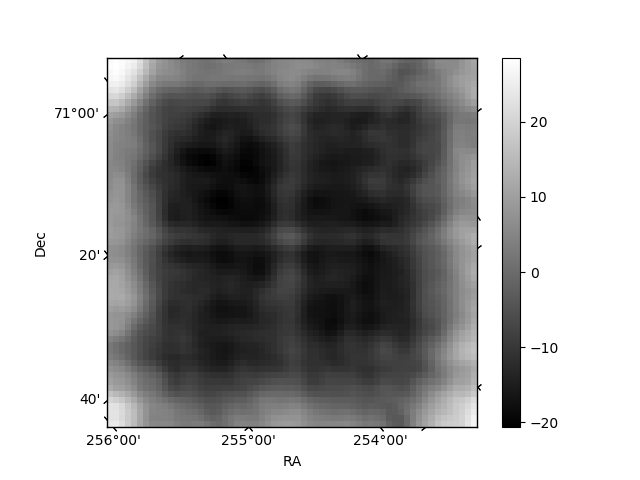
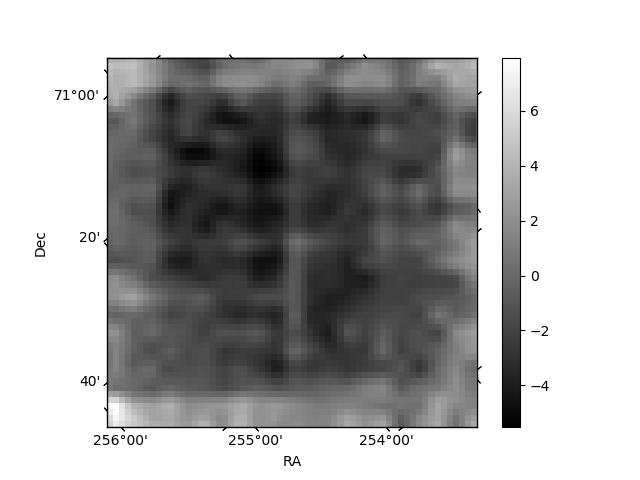
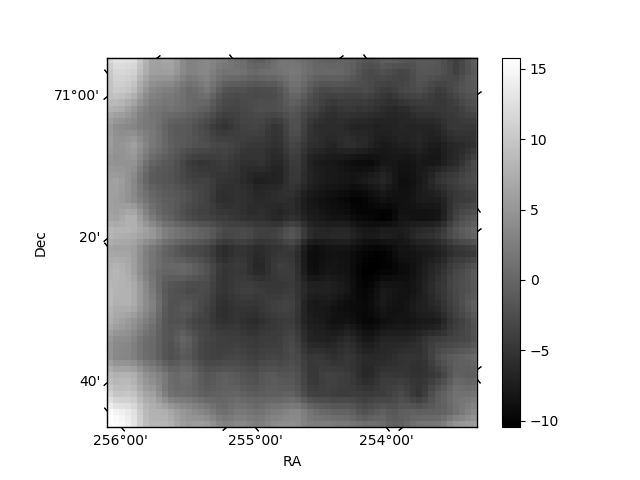
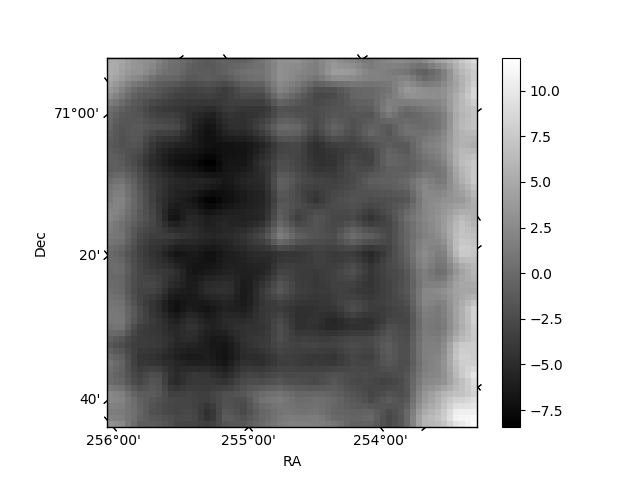
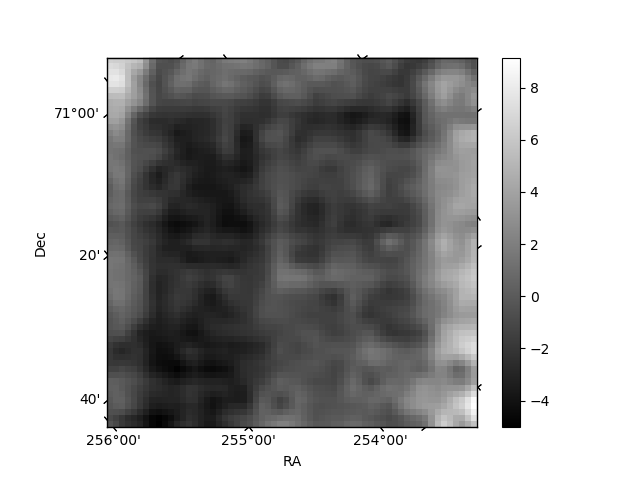
Histogram calculated using DETX and DETY for each event in the final _common_clean file
| Quadrant A | 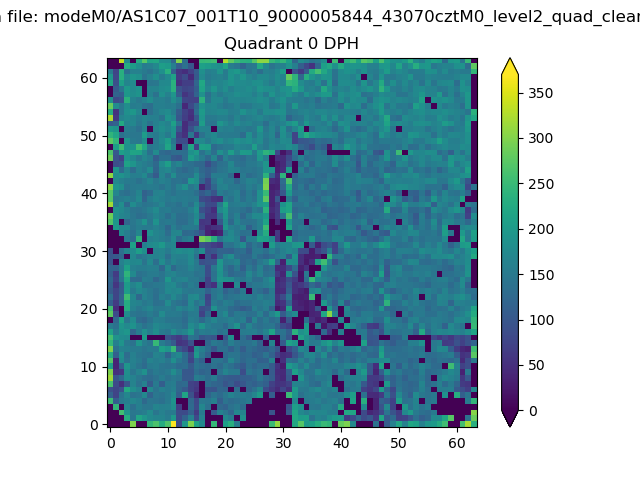 |
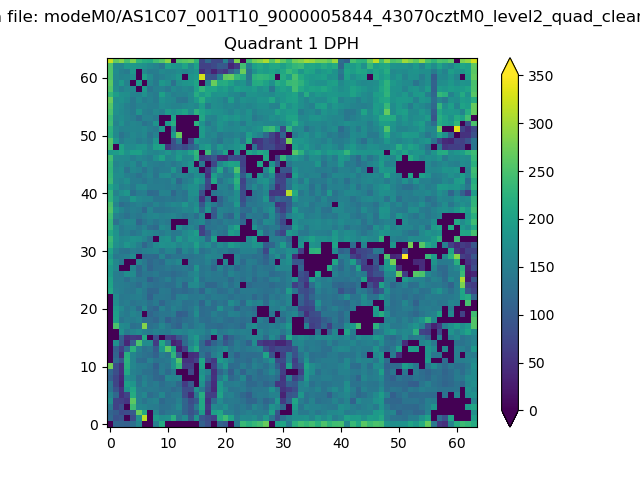 |
Quadrant B |
|---|---|---|---|
| Quadrant D | 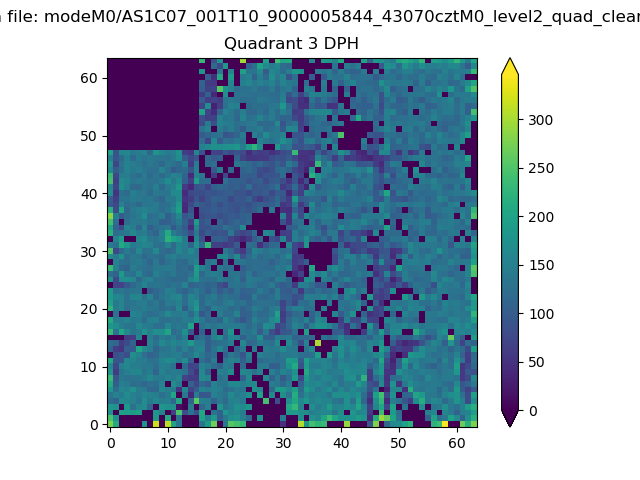 |
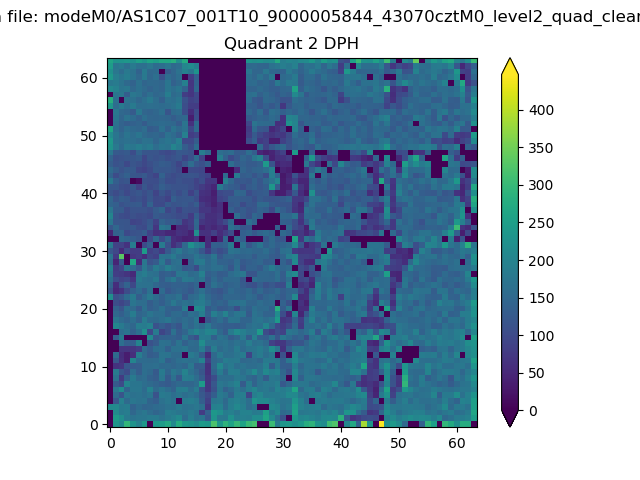 |
Quadrant C |
| Plot type | Count rate plots | Images |
|---|---|---|
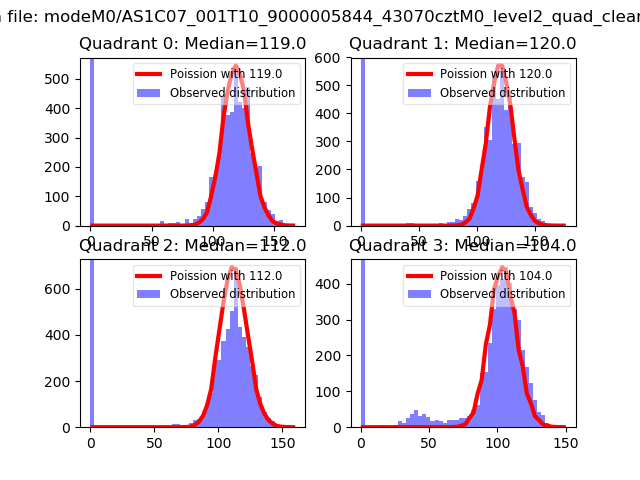
| Comparison with Poisson distribution Blue bars denote a histogram of data divided into 1 sec bins. Red curve is a Poisson curve with rate = median count rate of data. |
 |
 |
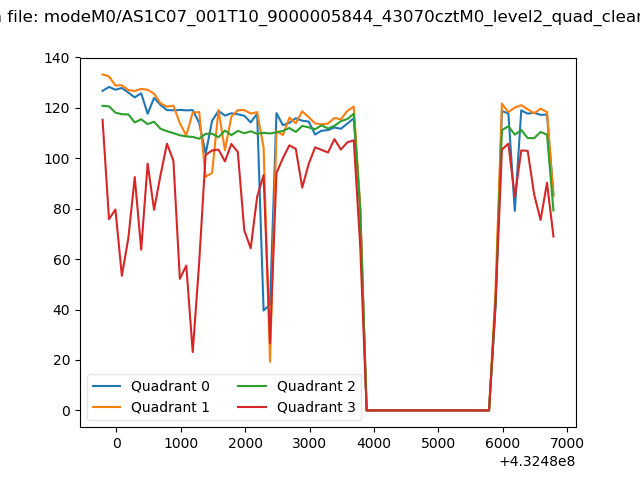
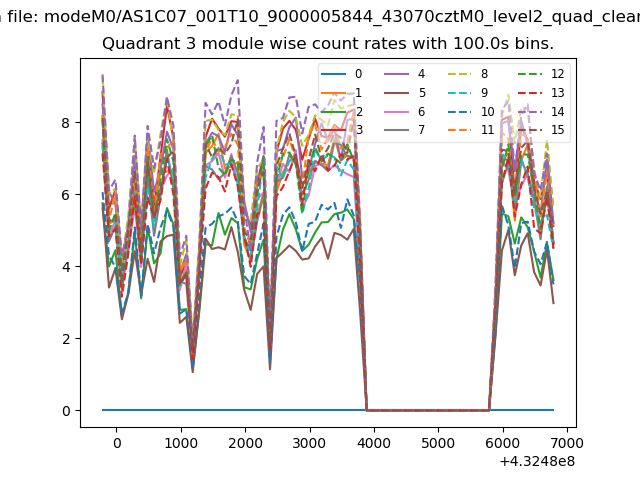
| Quadrant-wise count rates Data is divided into 100 sec bins |
 |
|
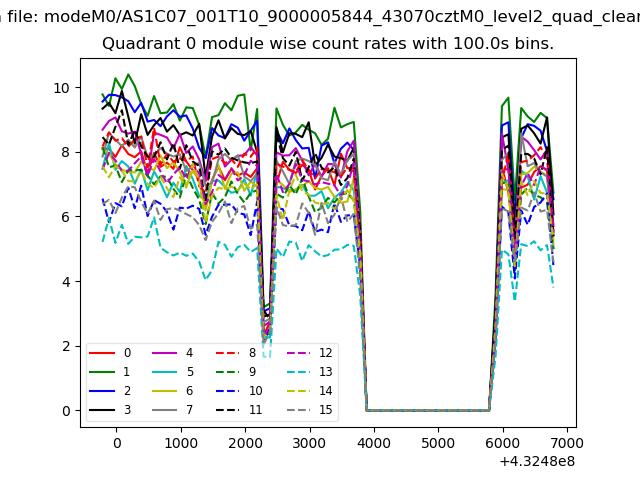
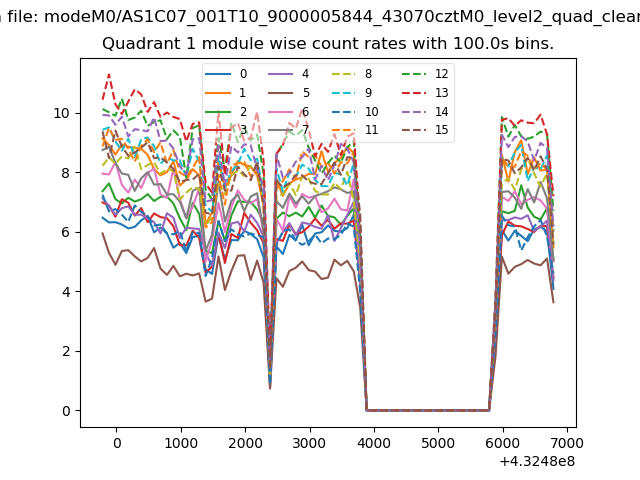
| Module-wise count rates for Quadrant A Data is divided into 100 sec bins |
 |
 |
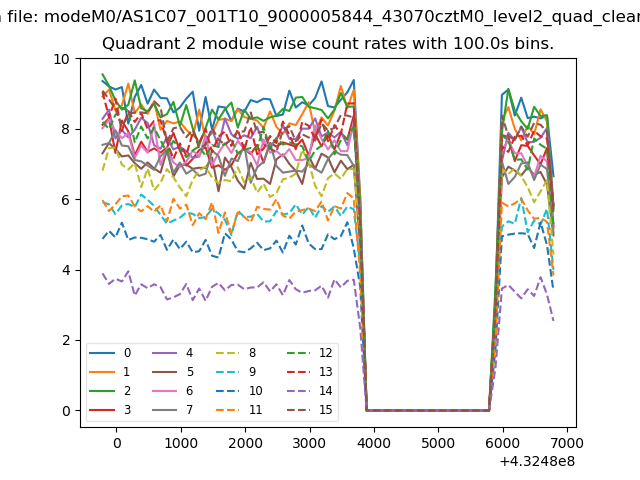
| Module-wise count rates for Quadrant B Data is divided into 100 sec bins |
 |
 |
| Module-wise count rates for Quadrant C Data is divided into 100 sec bins |
 |
 |
| Module-wise count rates for Quadrant D Data is divided into 100 sec bins |
 |
 |
| Parameter | Plot |
|---|---|
| CZT HV Monitor | 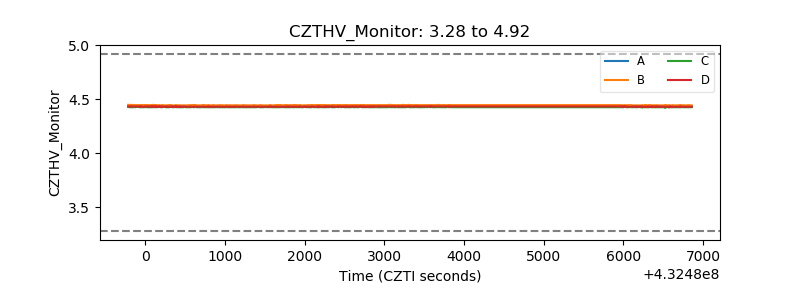 |
| D_VDD |  |
| Temperature 1 | 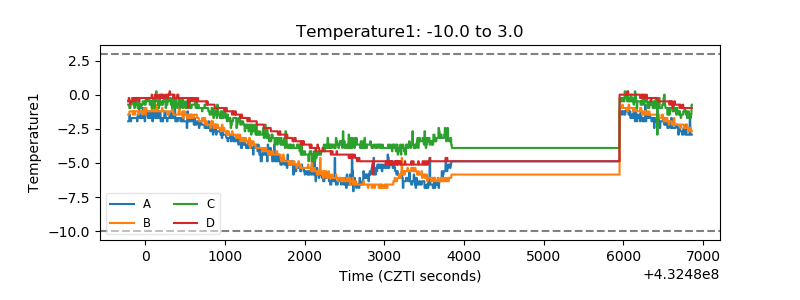 |
| Veto HV Monitor | 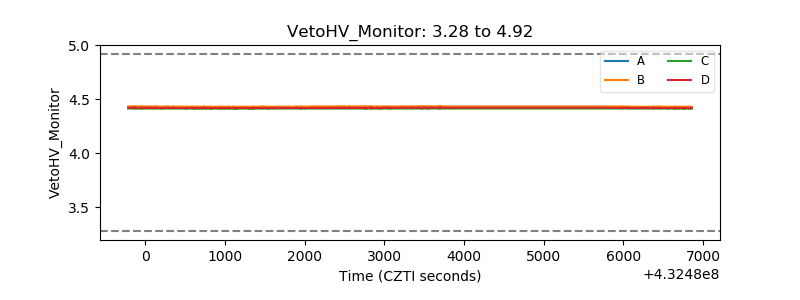 |
| Veto LLD | 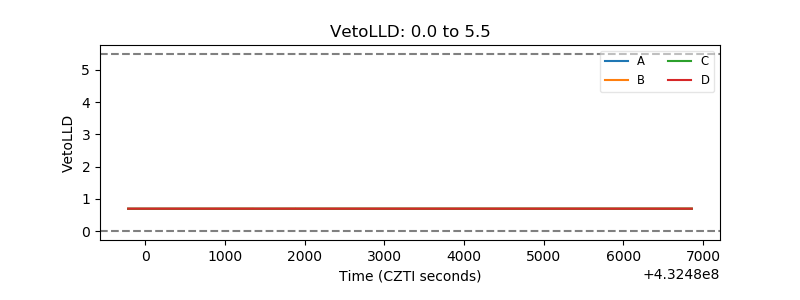 |
| Alpha Counter | 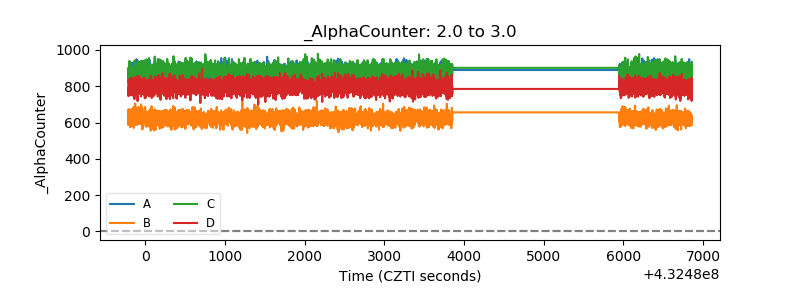 |
| _CPM_Rate | 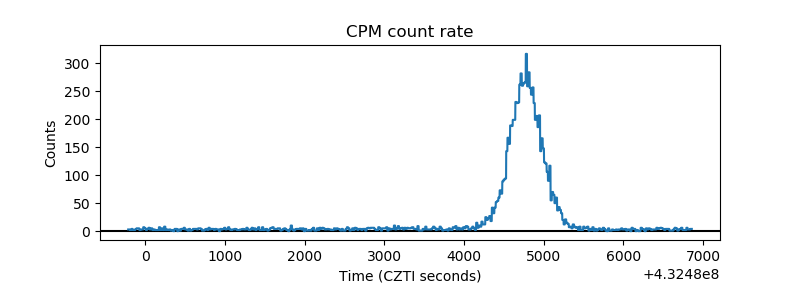 |
| CZT Counter | 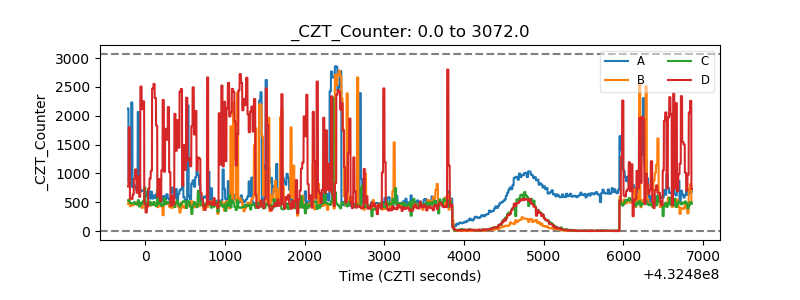 |
| +2.5 Volts monitor | 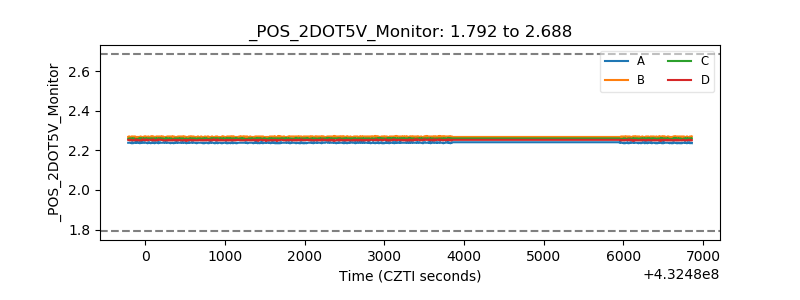 |
| +5 Volts monitor | 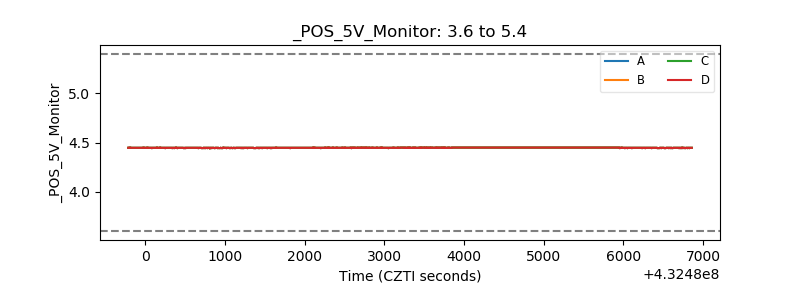 |
| _ROLL_ROT | 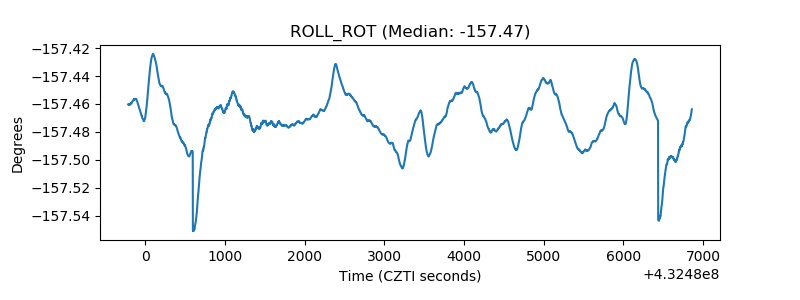 |
| _Roll_DEC | 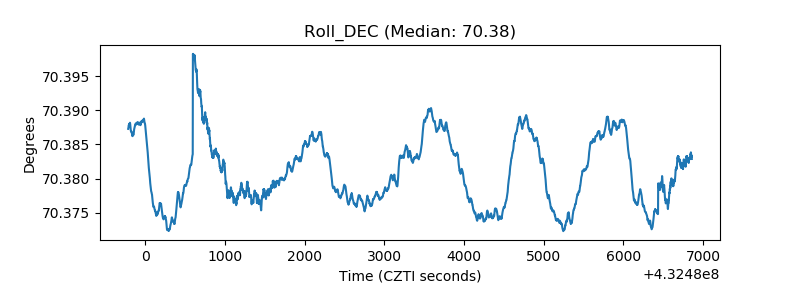 |
| _Roll_RA | 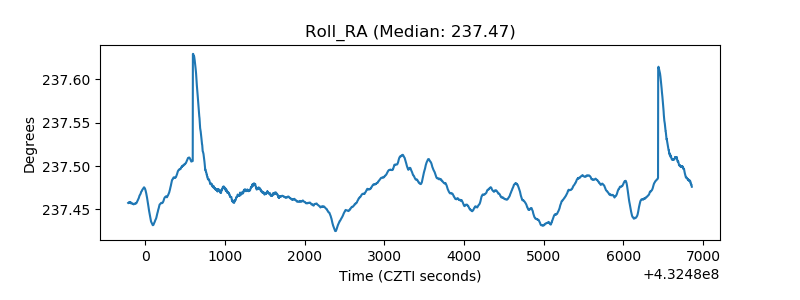 |
| Veto Counter | 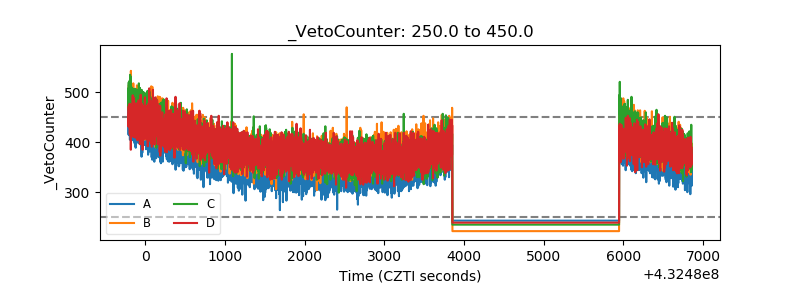 |