| Param | Original file | Final file |
|---|---|---|
| Filename | modeM0/AS1C07_001T10_9000005844_43071cztM0_level2.fits | modeM0/AS1C07_001T10_9000005844_43071cztM0_level2_quad_clean.evt |
| Size (bytes) | 353,923,200 | 86,575,680 |
| Size | 337.5 MB | 82.6 MB |
| Events in quadrant A | 3,477,964 | 585,085 |
| Events in quadrant B | 2,534,083 | 601,109 |
| Events in quadrant C | 2,426,046 | 566,812 |
| Events in quadrant D | 4,252,724 | 499,737 |
| Mode SS | |||
|---|---|---|---|
| Quadrant | BADHDUFLAG | Total packets | Discarded packets |
| A | 0 | 106 | 0 |
| B | 0 | 106 | 0 |
| C | 0 | 106 | 0 |
| D | 0 | 106 | 0 |
| Mode M9 | |||
|---|---|---|---|
| Quadrant | BADHDUFLAG | Total packets | Discarded packets |
| A | 0 | 22 | 0 |
| B | 0 | 23 | 0 |
| C | 0 | 23 | 0 |
| D | 0 | 23 | 0 |
| Mode M0 | |||
|---|---|---|---|
| Quadrant | BADHDUFLAG | Total packets | Discarded packets |
| A | 0 | 13839 | 2 |
| B | 0 | 11190 | 2 |
| C | 0 | 10584 | 2 |
| D | 0 | 16353 | 3 |
| Quadrant | Total seconds | Saturated seconds | Saturation percentage |
|---|---|---|---|
| A | 5268 | 115 | 2.182992% |
| B | 5268 | 29 | 0.550494% |
| C | 5268 | 2 | 0.037965% |
| D | 5267 | 422 | 8.012151% |
Noise dominated data is calculated using 1-second bins in cleaned event files. If a bin has >2000 counts, and if more than 50% of those come from <1% of pixels, then it is considered to be noise-dominated and hence unusable.
| Quadrant | # 1 sec bins | Bins with >0 counts | Bins with >2000 counts | High rate bins dominated by noise | Noise dominated (total time) | Noise dominated (detector-on time) | Marked lightcurve |
|---|---|---|---|---|---|---|---|
| A | 7211 | 5269 | 85 | 85 | 1.18% | 1.61% | 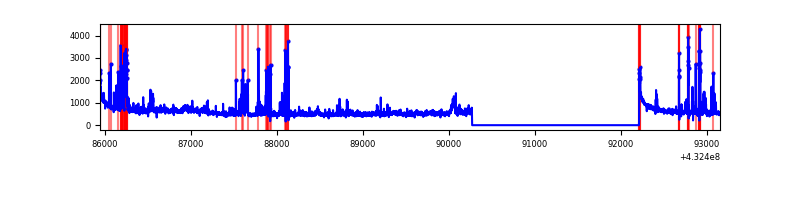 |
| B | 7211 | 5269 | 16 | 16 | 0.22% | 0.30% | 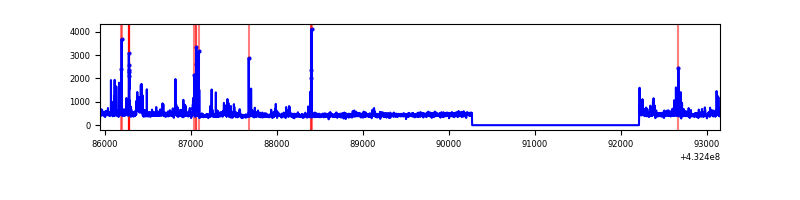 |
| C | 7211 | 5269 | 0 | 0 | 0.00% | 0.00% | 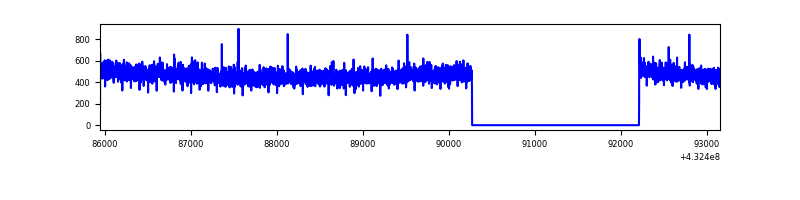 |
| D | 7210 | 5268 | 337 | 337 | 4.67% | 6.40% | 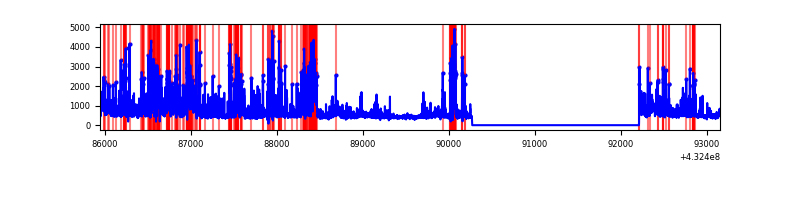 |
Top three noisy pixels from each quadrant. If the there are fewer than three noisy pixels in the level2.evt file, extra rows are filled as -1
| Pixel properties | Quadrant properties | ||||||
|---|---|---|---|---|---|---|---|
| Quadrant | DetID | PixID | Counts | Sigma | Mean | Median | Sigma |
| A | 10 | 83 | 633022 | 5525.7 | 559 | 548 | 114.5 |
| A | 15 | 237 | 399108 | 3482.08 | 559 | 548 | 114.5 |
| A | 12 | 189 | 146715 | 1277.01 | 559 | 548 | 114.5 |
| B | 0 | 229 | 162126 | 1495.14 | 562 | 548 | 108.1 |
| B | 4 | 171 | 62500 | 573.27 | 562 | 548 | 108.1 |
| B | 5 | 255 | 49105 | 449.32 | 562 | 548 | 108.1 |
| C | 15 | 214 | 238343 | 1849.09 | 552 | 556 | 128.6 |
| C | 1 | 128 | 21773 | 164.99 | 552 | 556 | 128.6 |
| C | 12 | 249 | 3853 | 25.64 | 552 | 556 | 128.6 |
| D | 13 | 249 | 1120112 | 8552.6 | 534 | 519 | 130.9 |
| D | 1 | 52 | 727698 | 5554.94 | 534 | 519 | 130.9 |
| D | 10 | 118 | 212834 | 1621.88 | 534 | 519 | 130.9 |
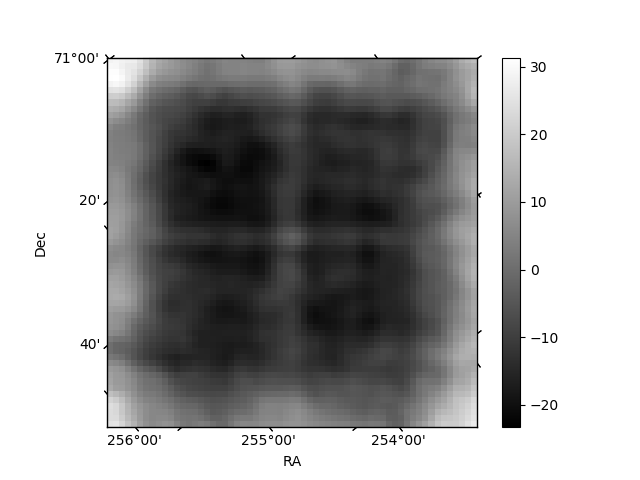
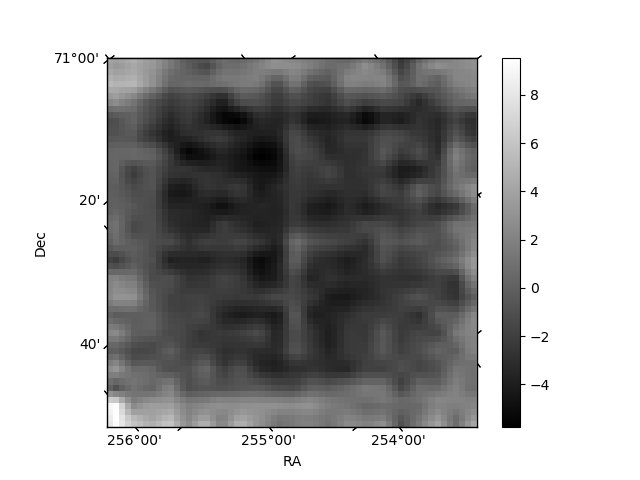
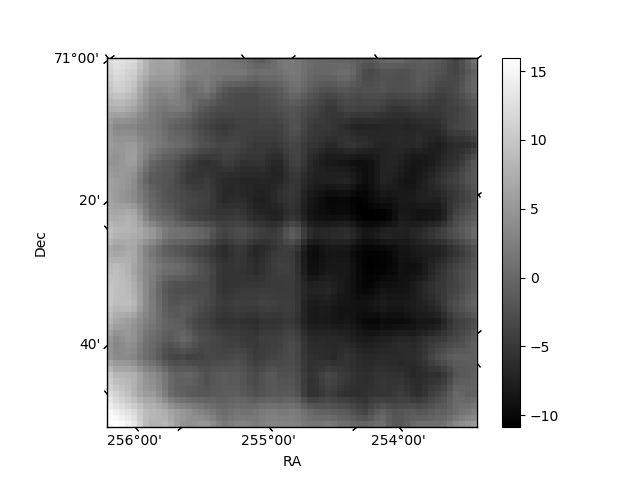
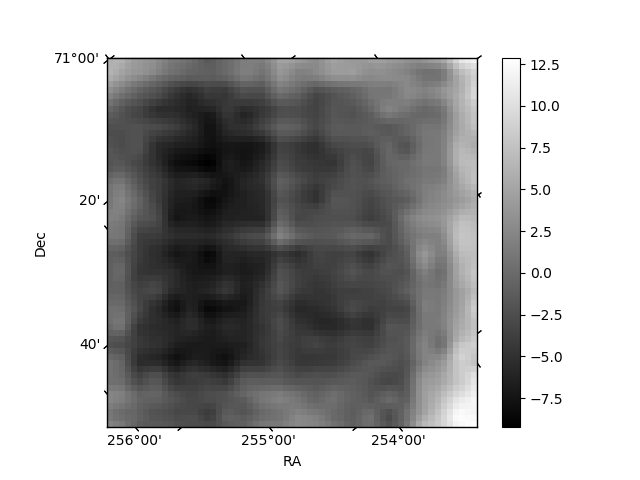
Histogram calculated using DETX and DETY for each event in the final _common_clean file
| Quadrant A | 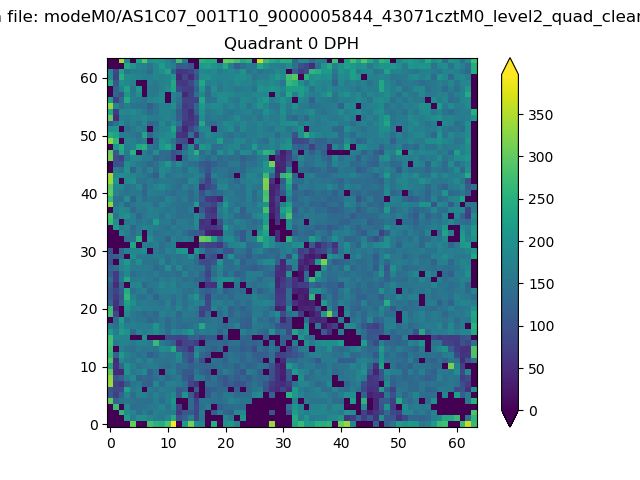 |
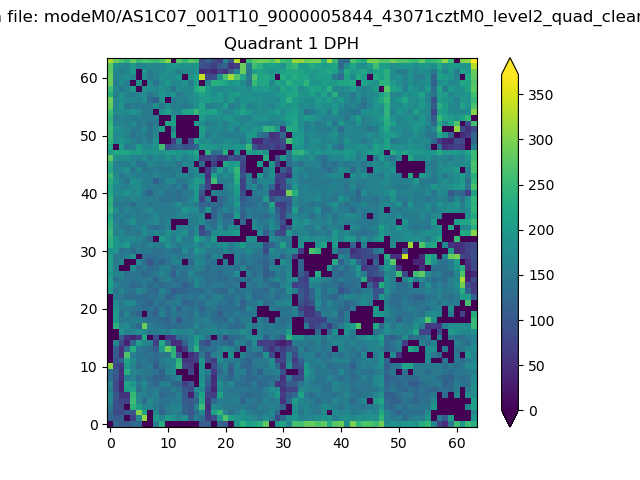 |
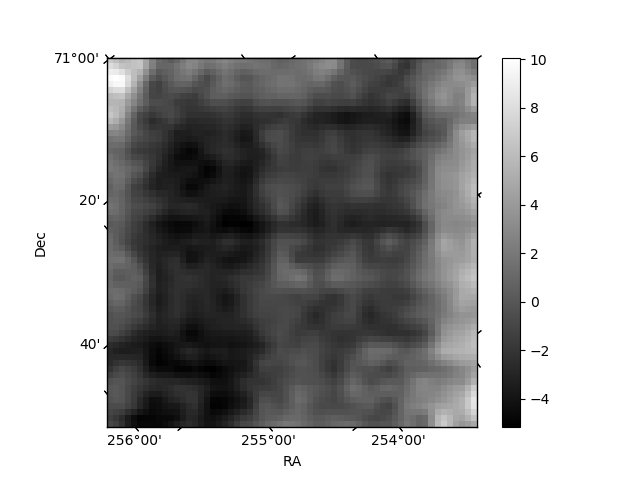
Quadrant B |
|---|---|---|---|
| Quadrant D | 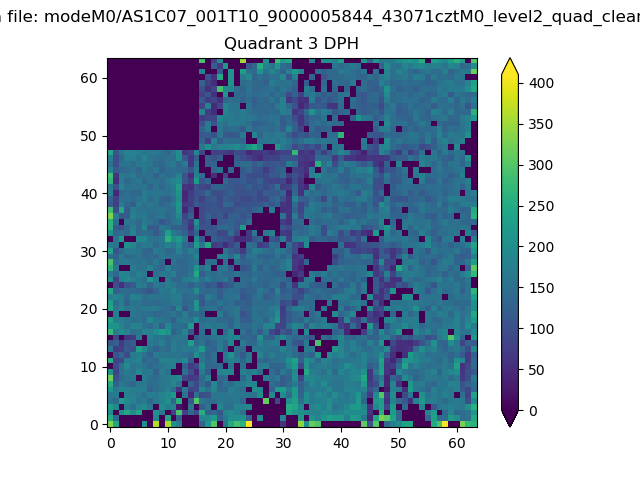 |
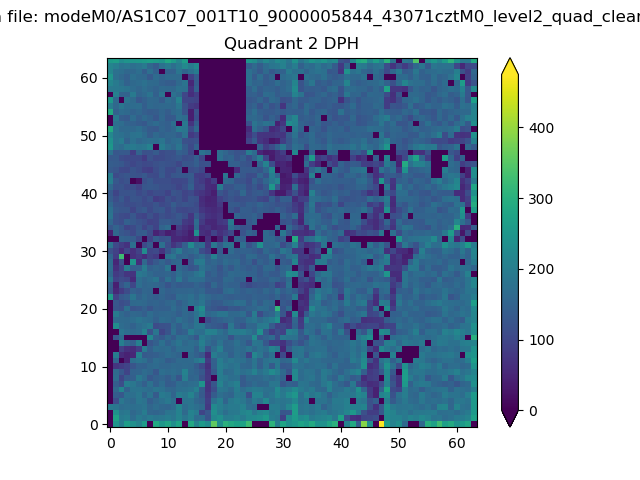 |
Quadrant C |
| Plot type | Count rate plots | Images |
|---|---|---|
| Comparison with Poisson distribution Blue bars denote a histogram of data divided into 1 sec bins. Red curve is a Poisson curve with rate = median count rate of data. |
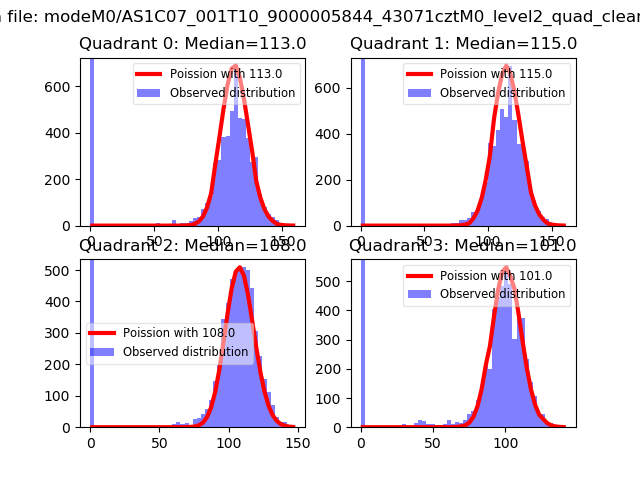 |
 |
| Quadrant-wise count rates Data is divided into 100 sec bins |
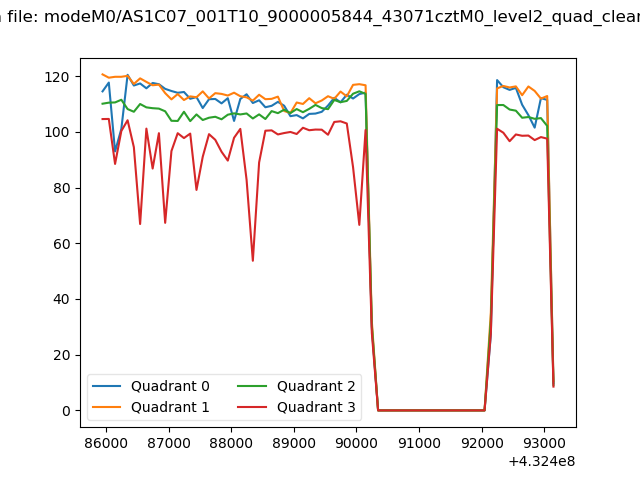 |
|
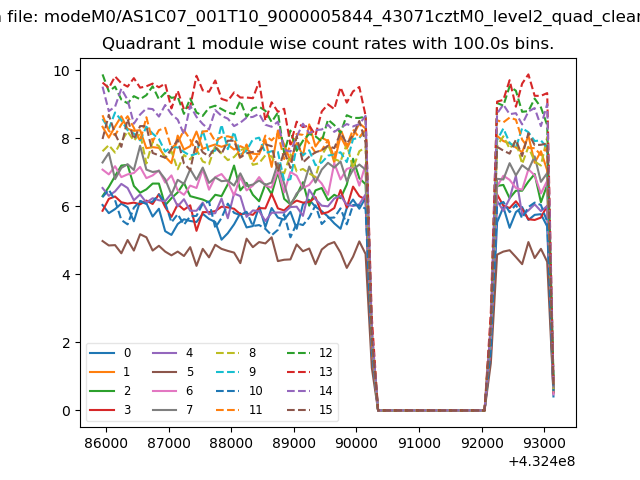
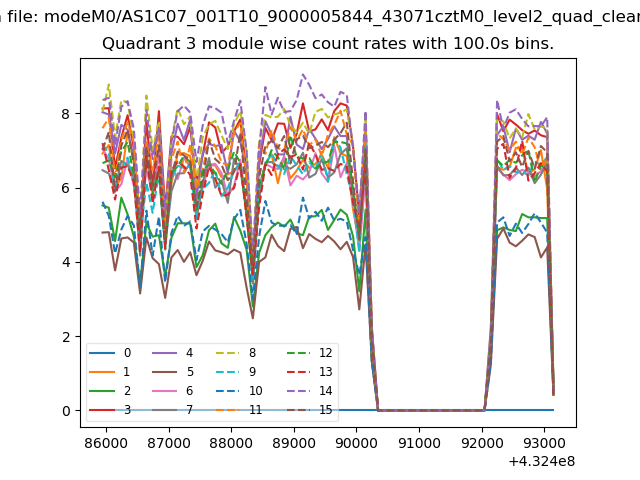
| Module-wise count rates for Quadrant A Data is divided into 100 sec bins |
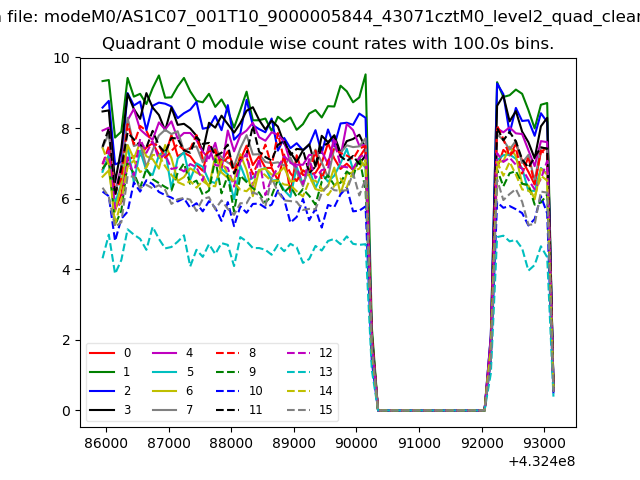 |
 |
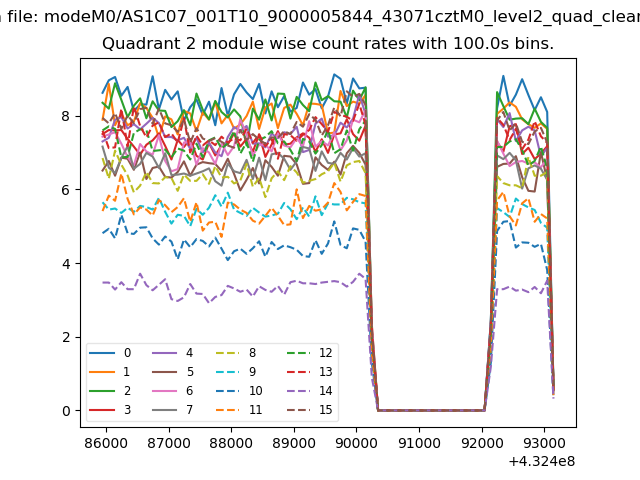
| Module-wise count rates for Quadrant B Data is divided into 100 sec bins |
 |
 |
| Module-wise count rates for Quadrant C Data is divided into 100 sec bins |
 |
 |
| Module-wise count rates for Quadrant D Data is divided into 100 sec bins |
 |
 |
| Parameter | Plot |
|---|---|
| CZT HV Monitor | 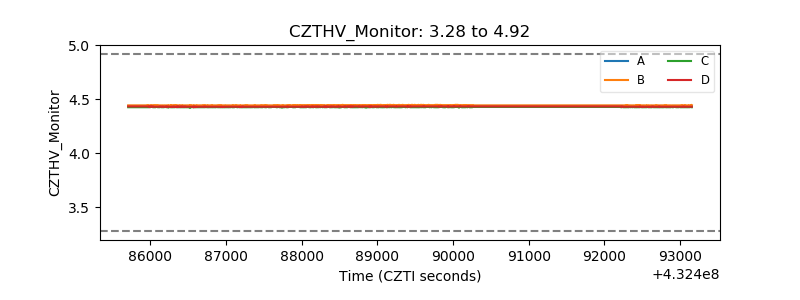 |
| D_VDD | 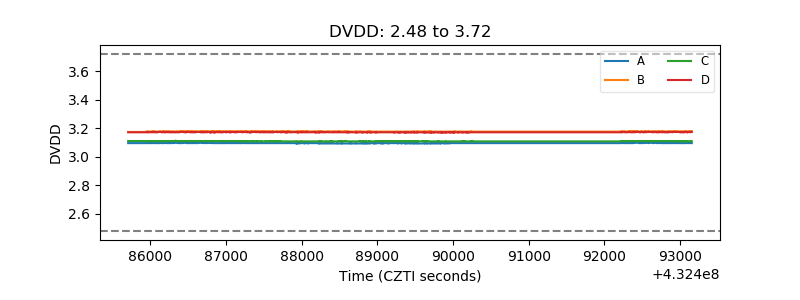 |
| Temperature 1 | 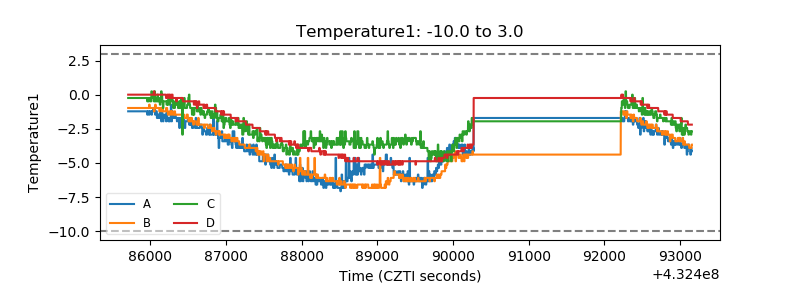 |
| Veto HV Monitor | 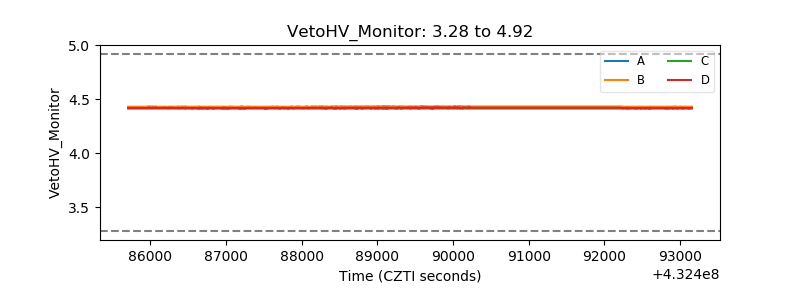 |
| Veto LLD | 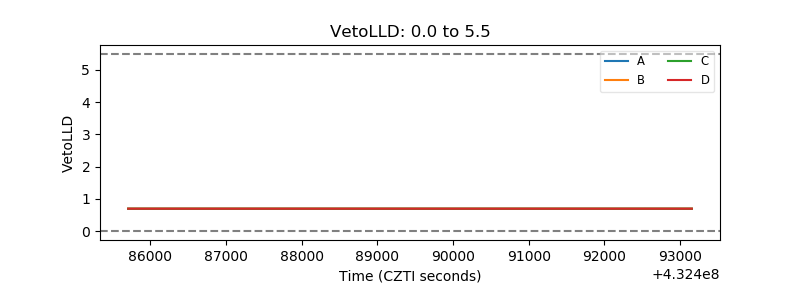 |
| Alpha Counter | 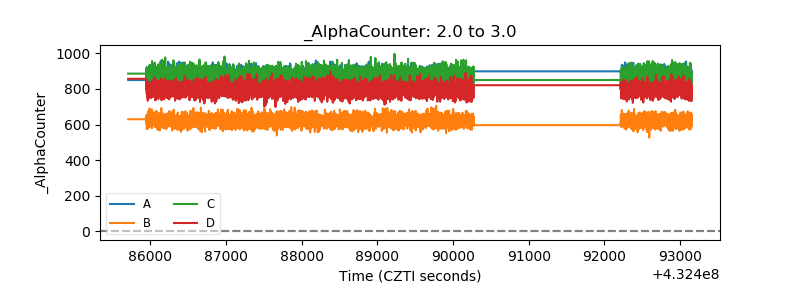 |
| _CPM_Rate | 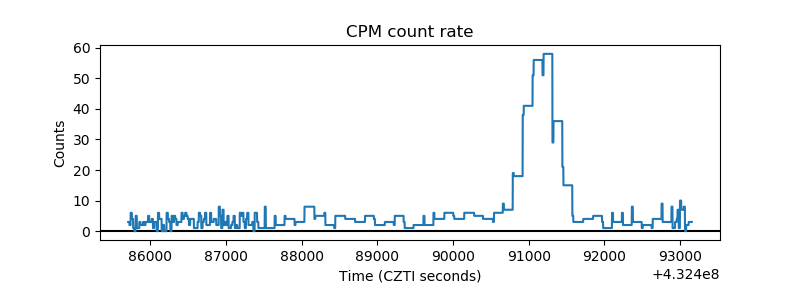 |
| CZT Counter | 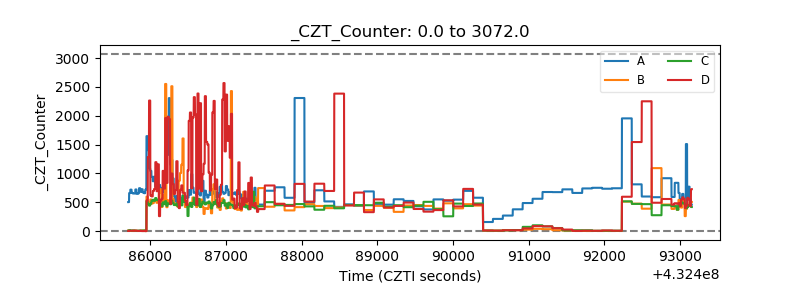 |
| +2.5 Volts monitor |  |
| +5 Volts monitor | 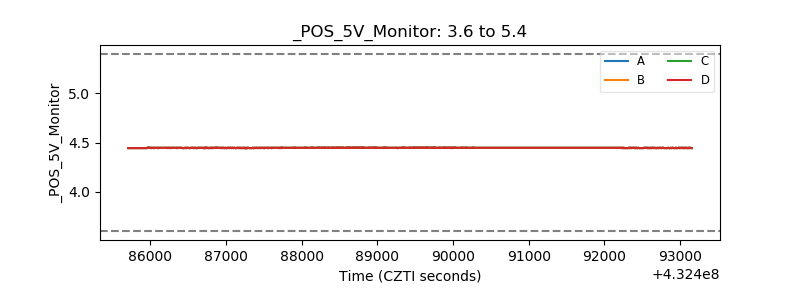 |
| _ROLL_ROT | 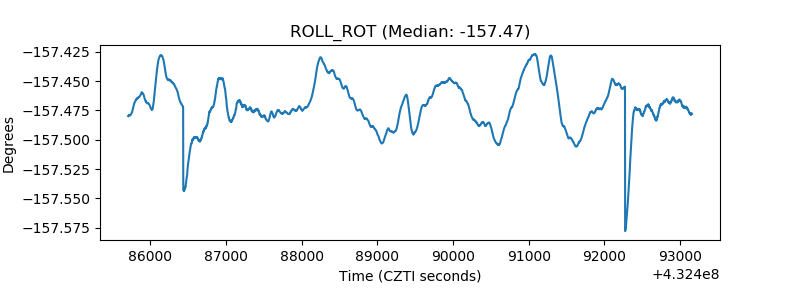 |
| _Roll_DEC | 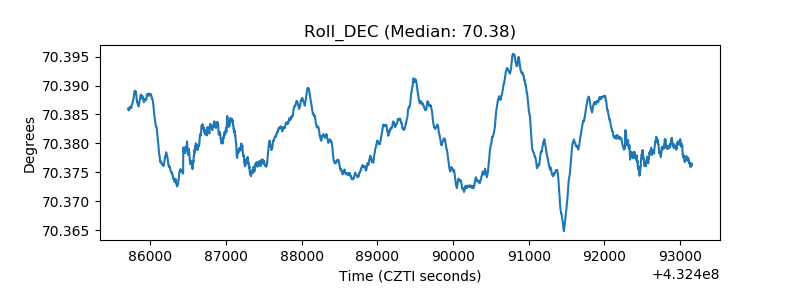 |
| _Roll_RA | 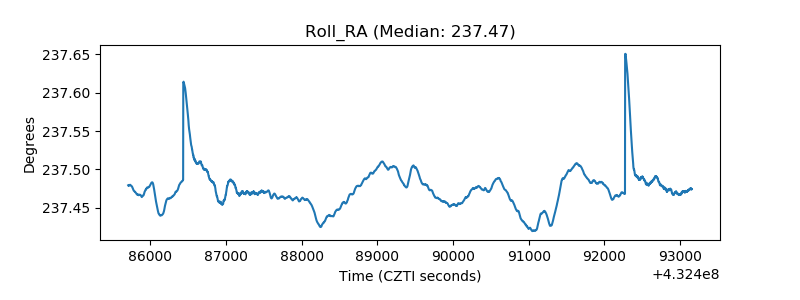 |
| Veto Counter | 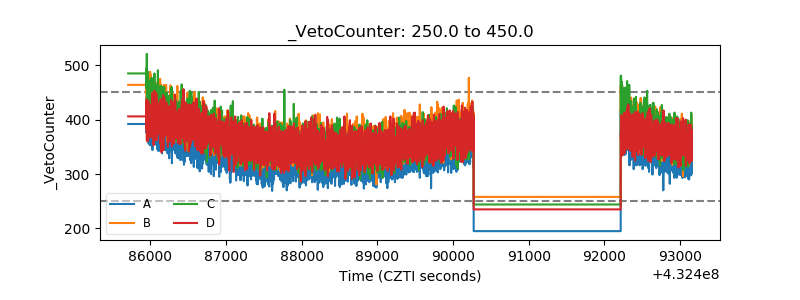 |