| Param | Original file | Final file |
|---|---|---|
| Filename | modeM0/AS1C07_001T10_9000005844_43072cztM0_level2.fits | modeM0/AS1C07_001T10_9000005844_43072cztM0_level2_quad_clean.evt |
| Size (bytes) | 332,150,400 | 87,693,120 |
| Size | 316.8 MB | 83.6 MB |
| Events in quadrant A | 3,323,081 | 584,731 |
| Events in quadrant B | 2,603,812 | 598,626 |
| Events in quadrant C | 2,449,126 | 571,709 |
| Events in quadrant D | 3,499,751 | 523,179 |
| Mode SS | |||
|---|---|---|---|
| Quadrant | BADHDUFLAG | Total packets | Discarded packets |
| A | 0 | 110 | 0 |
| B | 0 | 110 | 0 |
| C | 0 | 110 | 0 |
| D | 0 | 110 | 0 |
| Mode M9 | |||
|---|---|---|---|
| Quadrant | BADHDUFLAG | Total packets | Discarded packets |
| A | 0 | 21 | 0 |
| B | 0 | 22 | 0 |
| C | 0 | 22 | 0 |
| D | 0 | 22 | 0 |
| Mode M0 | |||
|---|---|---|---|
| Quadrant | BADHDUFLAG | Total packets | Discarded packets |
| A | 0 | 13283 | 2 |
| B | 0 | 11473 | 3 |
| C | 0 | 10825 | 2 |
| D | 0 | 14234 | 2 |
| Quadrant | Total seconds | Saturated seconds | Saturation percentage |
|---|---|---|---|
| A | 5383 | 123 | 2.284971% |
| B | 5382 | 23 | 0.427350% |
| C | 5382 | 4 | 0.074322% |
| D | 5382 | 175 | 3.251579% |
Noise dominated data is calculated using 1-second bins in cleaned event files. If a bin has >2000 counts, and if more than 50% of those come from <1% of pixels, then it is considered to be noise-dominated and hence unusable.
| Quadrant | # 1 sec bins | Bins with >0 counts | Bins with >2000 counts | High rate bins dominated by noise | Noise dominated (total time) | Noise dominated (detector-on time) | Marked lightcurve |
|---|---|---|---|---|---|---|---|
| A | 6995 | 5384 | 86 | 86 | 1.23% | 1.60% | 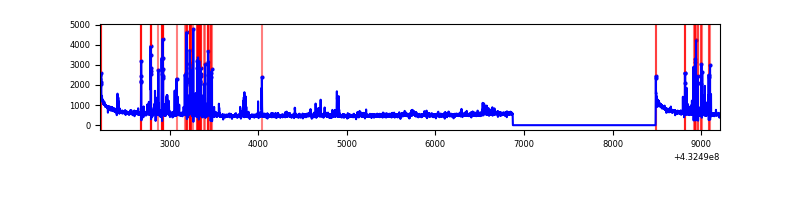 |
| B | 6994 | 5383 | 13 | 13 | 0.19% | 0.24% | 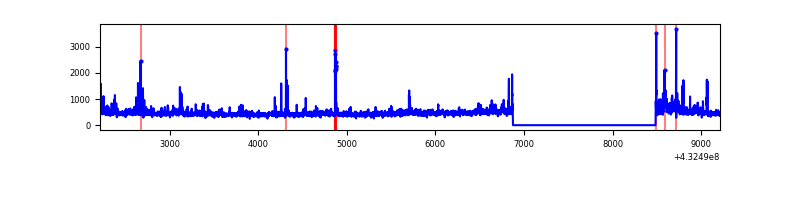 |
| C | 6994 | 5383 | 1 | 1 | 0.01% | 0.02% | 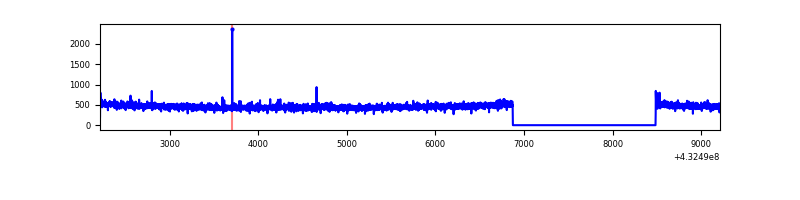 |
| D | 6994 | 5383 | 173 | 173 | 2.47% | 3.21% | 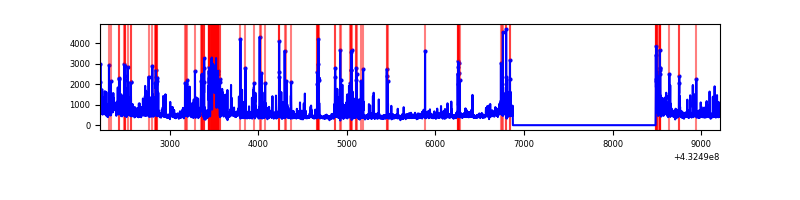 |
Top three noisy pixels from each quadrant. If the there are fewer than three noisy pixels in the level2.evt file, extra rows are filled as -1
| Pixel properties | Quadrant properties | ||||||
|---|---|---|---|---|---|---|---|
| Quadrant | DetID | PixID | Counts | Sigma | Mean | Median | Sigma |
| A | 10 | 83 | 612826 | 5305.68 | 564 | 551 | 115.4 |
| A | 15 | 237 | 379146 | 3280.72 | 564 | 551 | 115.4 |
| A | 12 | 189 | 65555 | 563.29 | 564 | 551 | 115.4 |
| B | 0 | 186 | 88125 | 798.28 | 570 | 555 | 109.7 |
| B | 0 | 229 | 86705 | 785.34 | 570 | 555 | 109.7 |
| B | 5 | 255 | 77885 | 704.94 | 570 | 555 | 109.7 |
| C | 15 | 214 | 241386 | 1835.89 | 560 | 563 | 131.2 |
| C | 1 | 128 | 8312 | 59.07 | 560 | 563 | 131.2 |
| C | 12 | 2 | 6125 | 42.4 | 560 | 563 | 131.2 |
| D | 1 | 52 | 528494 | 3886.85 | 556 | 539 | 135.8 |
| D | 13 | 249 | 507516 | 3732.41 | 556 | 539 | 135.8 |
| D | 5 | 32 | 188356 | 1382.73 | 556 | 539 | 135.8 |
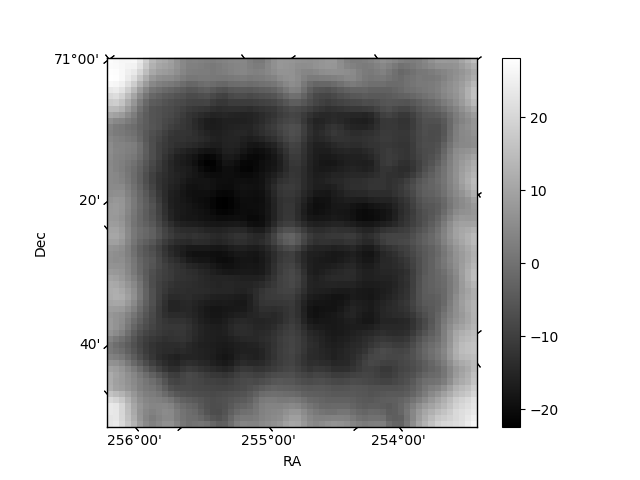
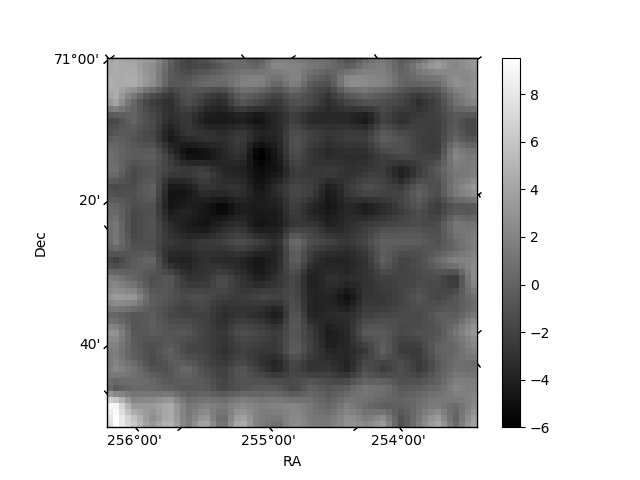
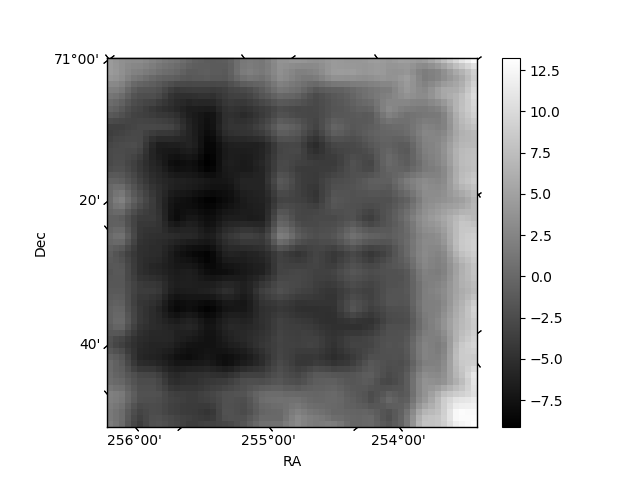
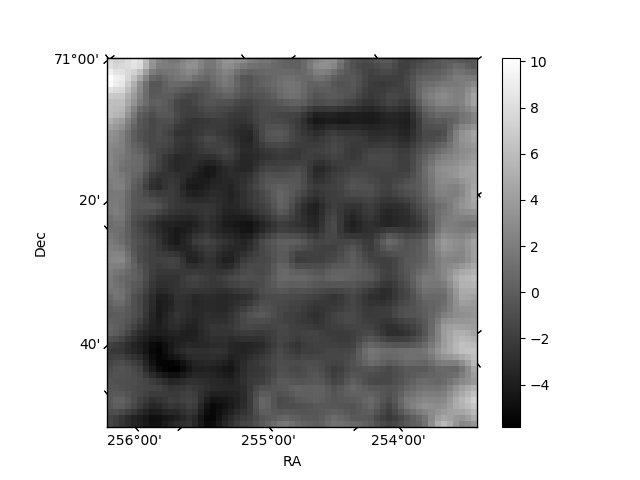
Histogram calculated using DETX and DETY for each event in the final _common_clean file
| Quadrant A | 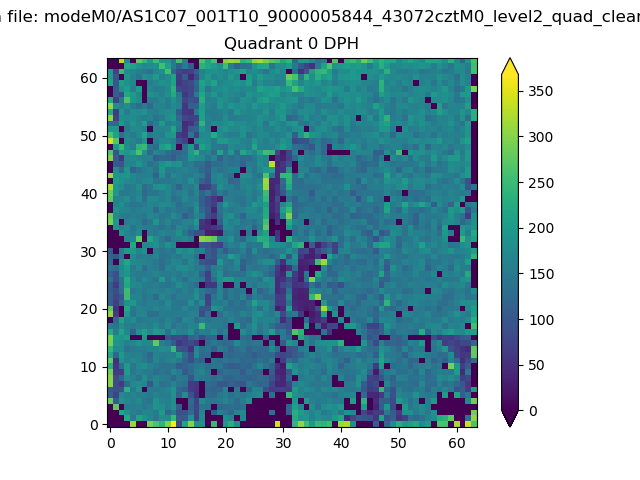 |
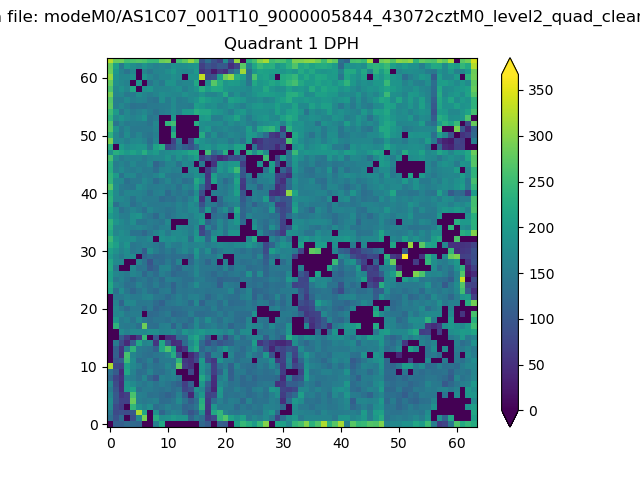 |
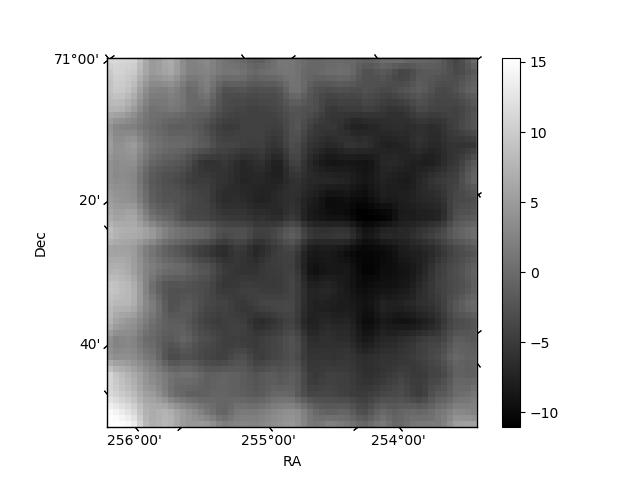
Quadrant B |
|---|---|---|---|
| Quadrant D | 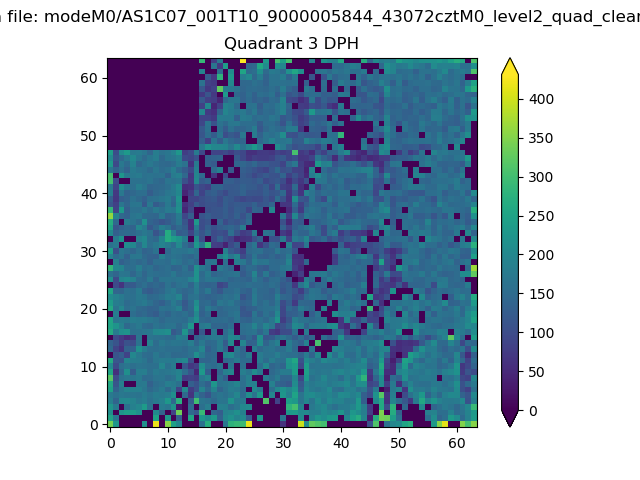 |
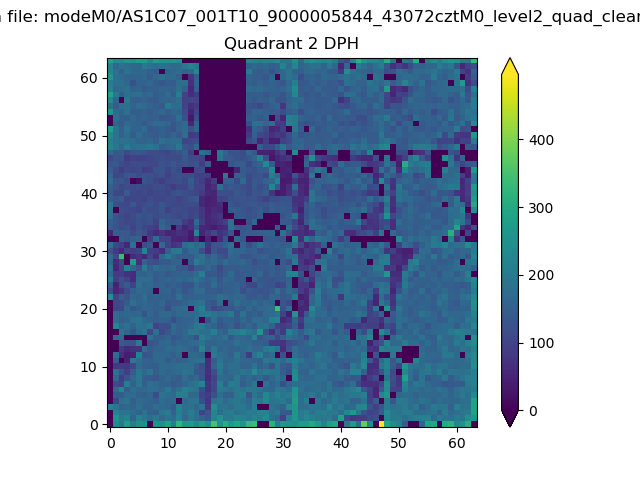 |
Quadrant C |
| Plot type | Count rate plots | Images |
|---|---|---|
| Comparison with Poisson distribution Blue bars denote a histogram of data divided into 1 sec bins. Red curve is a Poisson curve with rate = median count rate of data. |
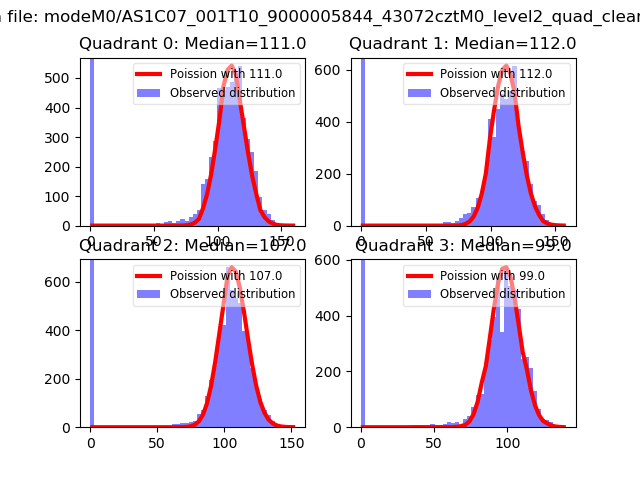 |
 |
| Quadrant-wise count rates Data is divided into 100 sec bins |
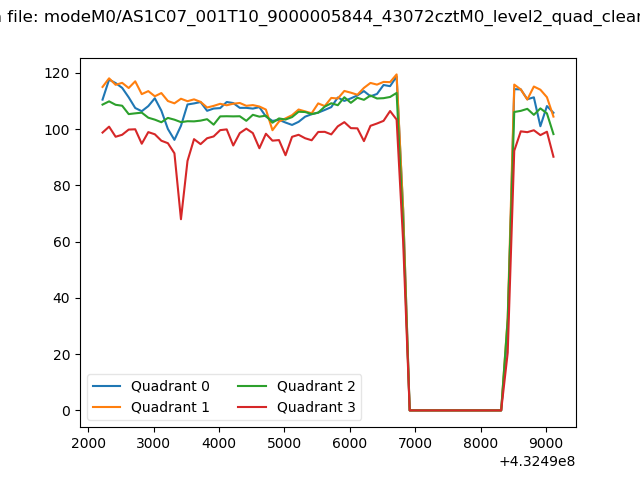 |
|
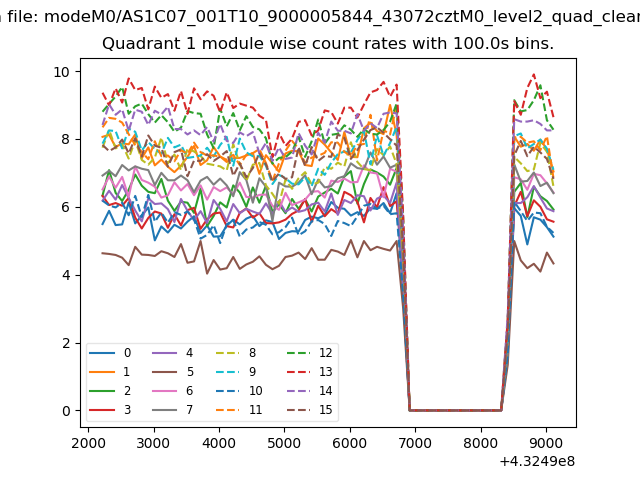
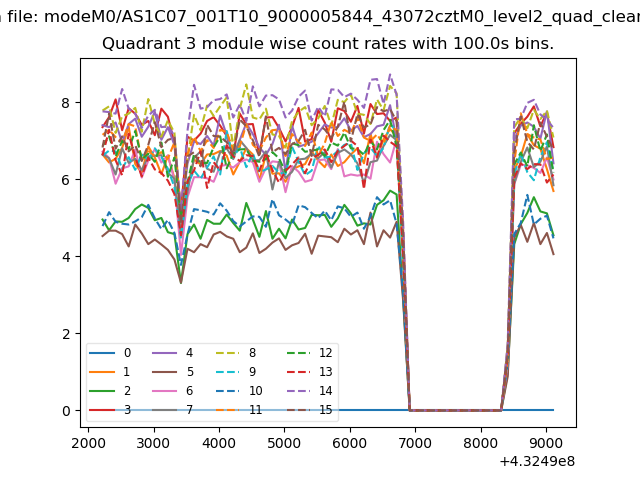
| Module-wise count rates for Quadrant A Data is divided into 100 sec bins |
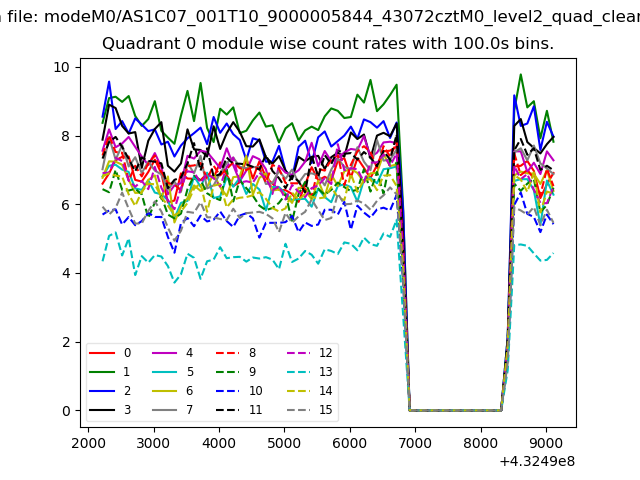 |
 |
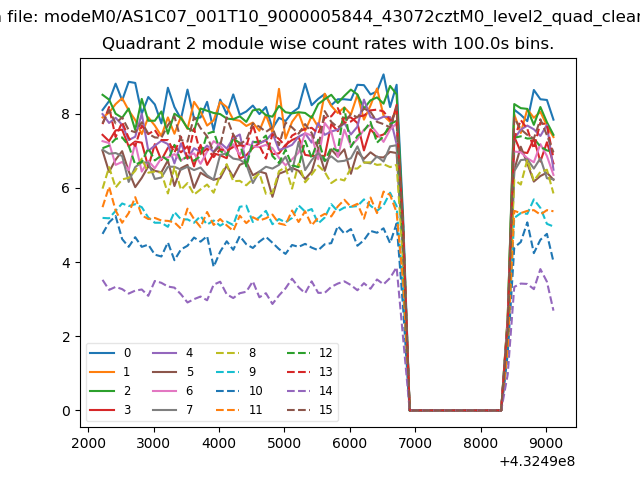
| Module-wise count rates for Quadrant B Data is divided into 100 sec bins |
 |
 |
| Module-wise count rates for Quadrant C Data is divided into 100 sec bins |
 |
 |
| Module-wise count rates for Quadrant D Data is divided into 100 sec bins |
 |
 |
| Parameter | Plot |
|---|---|
| CZT HV Monitor | 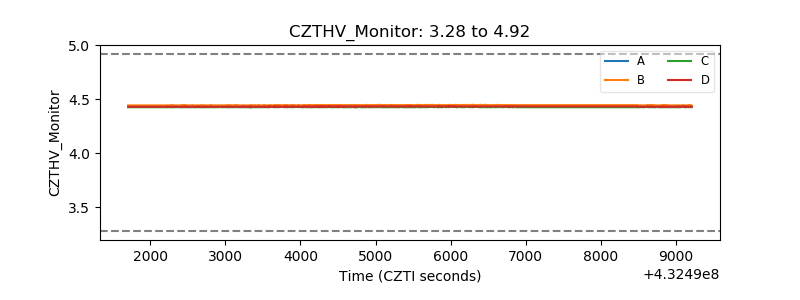 |
| D_VDD | 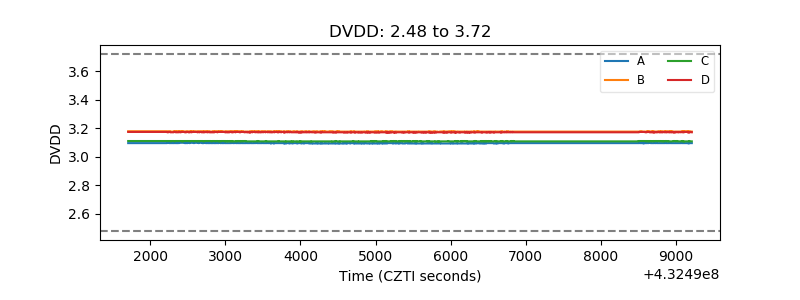 |
| Temperature 1 | 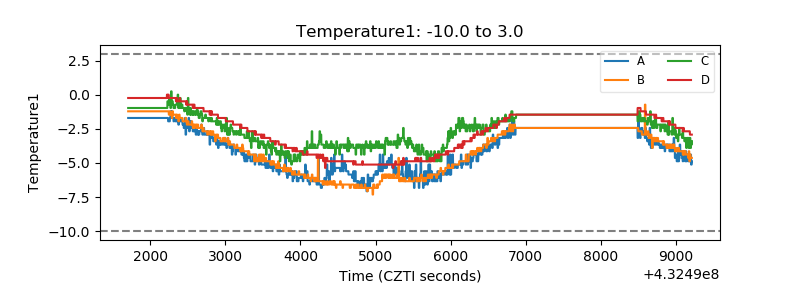 |
| Veto HV Monitor | 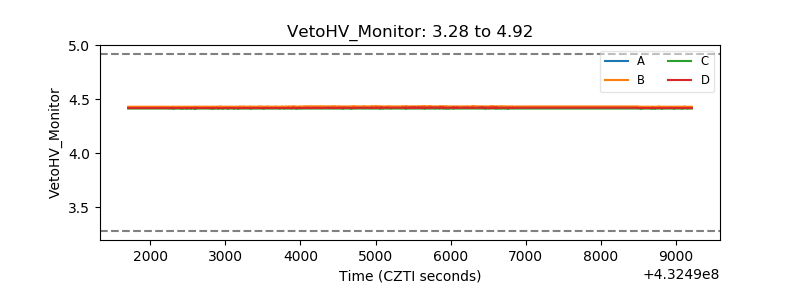 |
| Veto LLD | 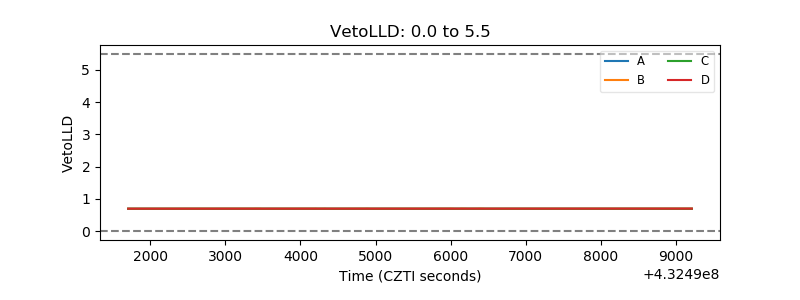 |
| Alpha Counter | 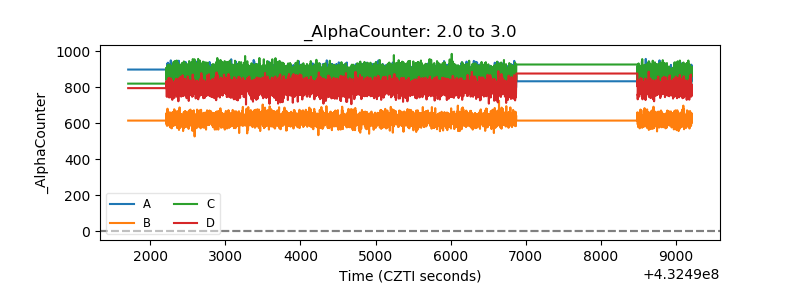 |
| _CPM_Rate |  |
| CZT Counter | 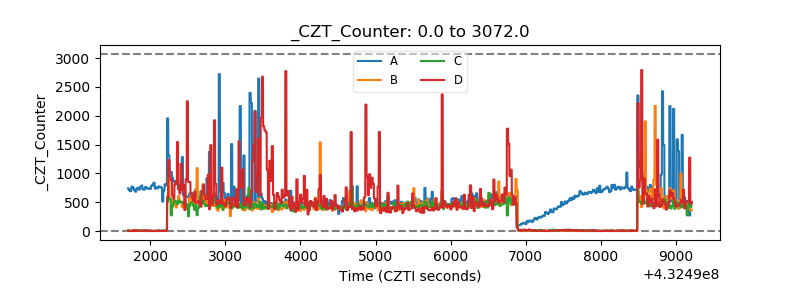 |
| +2.5 Volts monitor | 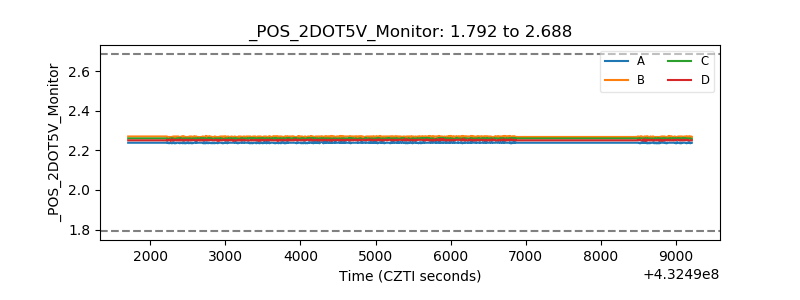 |
| +5 Volts monitor | 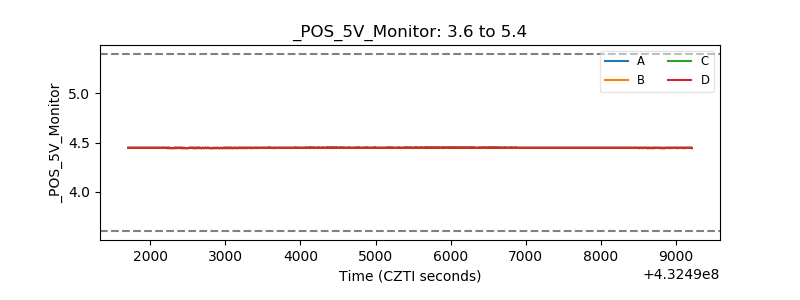 |
| _ROLL_ROT | 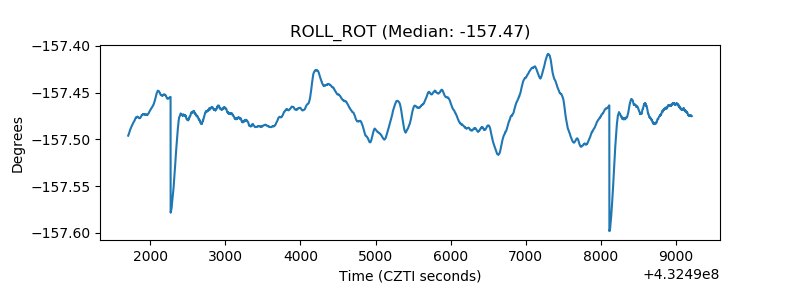 |
| _Roll_DEC | 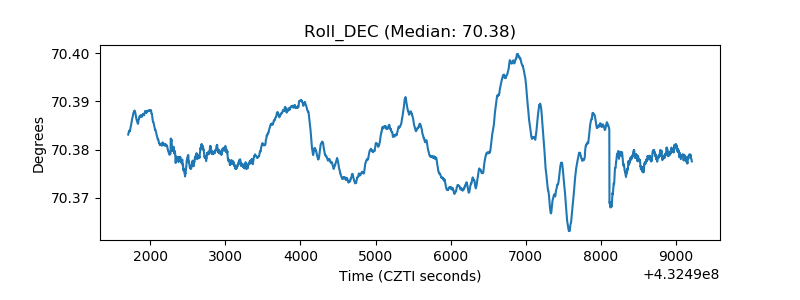 |
| _Roll_RA | 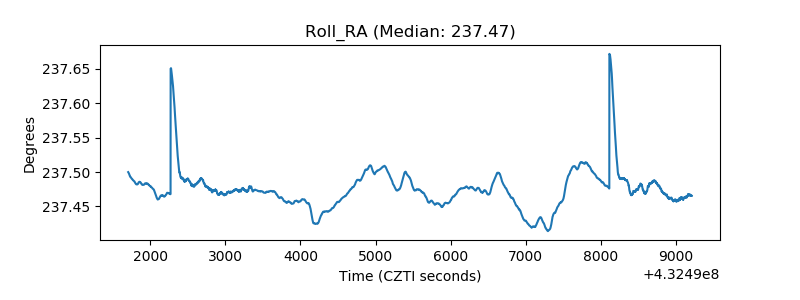 |
| Veto Counter | 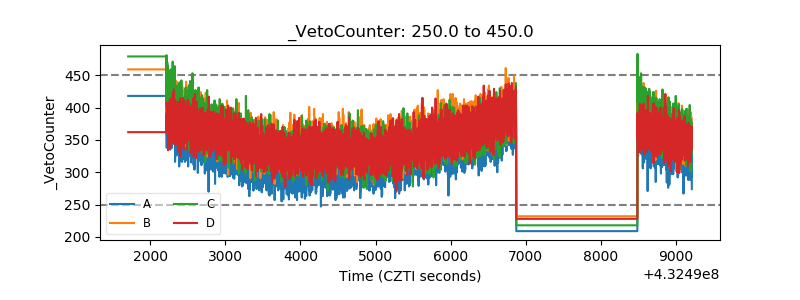 |