| Param | Original file | Final file |
|---|---|---|
| Filename | modeM0/AS1C07_001T10_9000005844_43073cztM0_level2.fits | modeM0/AS1C07_001T10_9000005844_43073cztM0_level2_quad_clean.evt |
| Size (bytes) | 350,804,160 | 94,322,880 |
| Size | 334.6 MB | 90.0 MB |
| Events in quadrant A | 3,417,903 | 631,807 |
| Events in quadrant B | 2,791,806 | 644,215 |
| Events in quadrant C | 2,655,142 | 614,076 |
| Events in quadrant D | 3,667,306 | 558,909 |
| Mode SS | |||
|---|---|---|---|
| Quadrant | BADHDUFLAG | Total packets | Discarded packets |
| A | 0 | 118 | 0 |
| B | 0 | 118 | 0 |
| C | 0 | 118 | 0 |
| D | 0 | 118 | 0 |
| Mode M9 | |||
|---|---|---|---|
| Quadrant | BADHDUFLAG | Total packets | Discarded packets |
| A | 0 | 22 | 0 |
| B | 0 | 23 | 0 |
| C | 0 | 23 | 0 |
| D | 0 | 23 | 0 |
| Mode M0 | |||
|---|---|---|---|
| Quadrant | BADHDUFLAG | Total packets | Discarded packets |
| A | 0 | 13868 | 2 |
| B | 0 | 12410 | 2 |
| C | 0 | 11709 | 2 |
| D | 0 | 15066 | 2 |
| Quadrant | Total seconds | Saturated seconds | Saturation percentage |
|---|---|---|---|
| A | 5823 | 72 | 1.236476% |
| B | 5823 | 29 | 0.498025% |
| C | 5823 | 3 | 0.051520% |
| D | 5823 | 230 | 3.949854% |
Noise dominated data is calculated using 1-second bins in cleaned event files. If a bin has >2000 counts, and if more than 50% of those come from <1% of pixels, then it is considered to be noise-dominated and hence unusable.
| Quadrant | # 1 sec bins | Bins with >0 counts | Bins with >2000 counts | High rate bins dominated by noise | Noise dominated (total time) | Noise dominated (detector-on time) | Marked lightcurve |
|---|---|---|---|---|---|---|---|
| A | 7166 | 5824 | 48 | 48 | 0.67% | 0.82% | 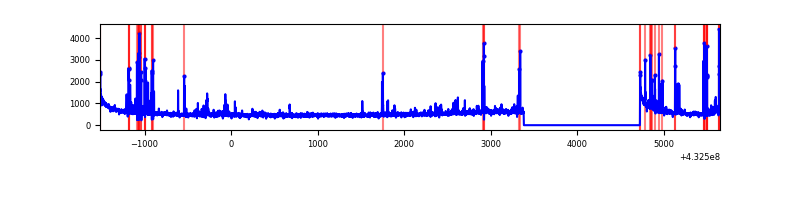 |
| B | 7166 | 5824 | 17 | 17 | 0.24% | 0.29% | 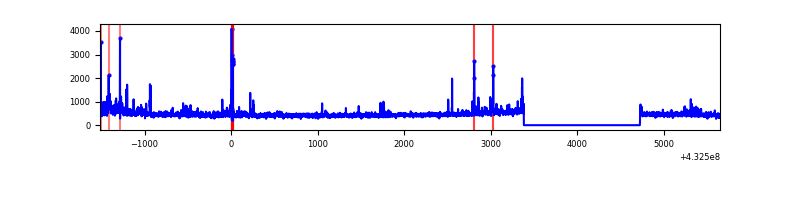 |
| C | 7166 | 5824 | 0 | 0 | 0.00% | 0.00% | 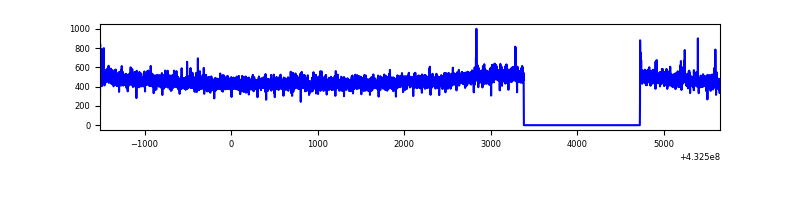 |
| D | 7166 | 5824 | 168 | 168 | 2.34% | 2.88% | 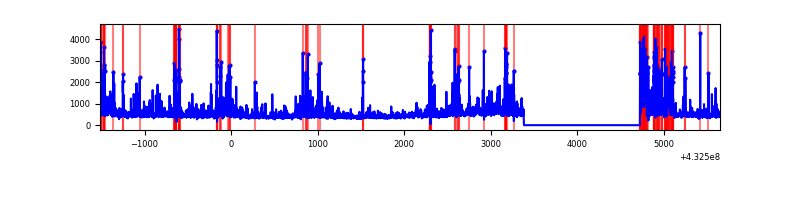 |
Top three noisy pixels from each quadrant. If the there are fewer than three noisy pixels in the level2.evt file, extra rows are filled as -1
| Pixel properties | Quadrant properties | ||||||
|---|---|---|---|---|---|---|---|
| Quadrant | DetID | PixID | Counts | Sigma | Mean | Median | Sigma |
| A | 10 | 83 | 642749 | 5039.41 | 618 | 605 | 127.4 |
| A | 15 | 237 | 235974 | 1847.12 | 618 | 605 | 127.4 |
| A | 12 | 189 | 89792 | 699.92 | 618 | 605 | 127.4 |
| B | 0 | 229 | 96072 | 800.22 | 618 | 600 | 119.3 |
| B | 0 | 186 | 86344 | 718.69 | 618 | 600 | 119.3 |
| B | 5 | 255 | 62797 | 521.32 | 618 | 600 | 119.3 |
| C | 15 | 214 | 260945 | 1821.99 | 608 | 612 | 142.9 |
| C | 12 | 2 | 8047 | 52.04 | 608 | 612 | 142.9 |
| C | 3 | 233 | 4302 | 25.83 | 608 | 612 | 142.9 |
| D | 1 | 52 | 411004 | 2796.22 | 600 | 583 | 146.8 |
| D | 2 | 249 | 341223 | 2320.8 | 600 | 583 | 146.8 |
| D | 5 | 32 | 280773 | 1908.95 | 600 | 583 | 146.8 |
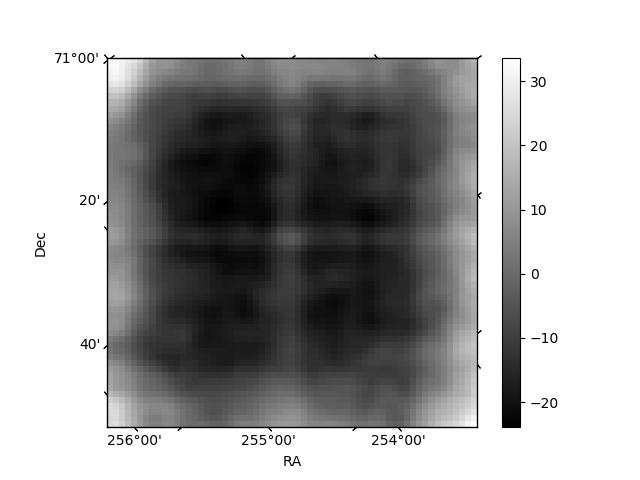
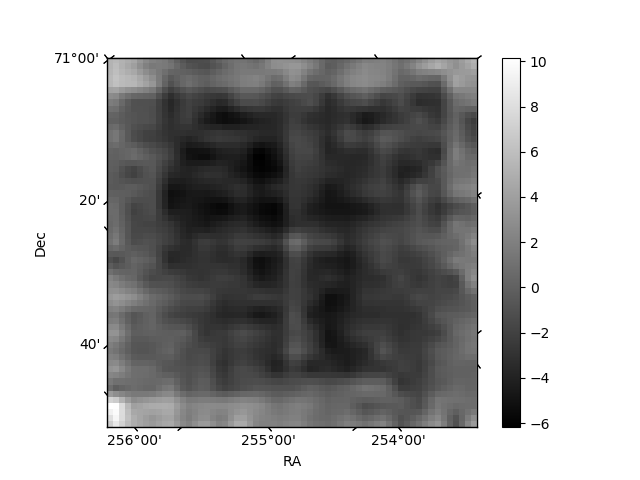
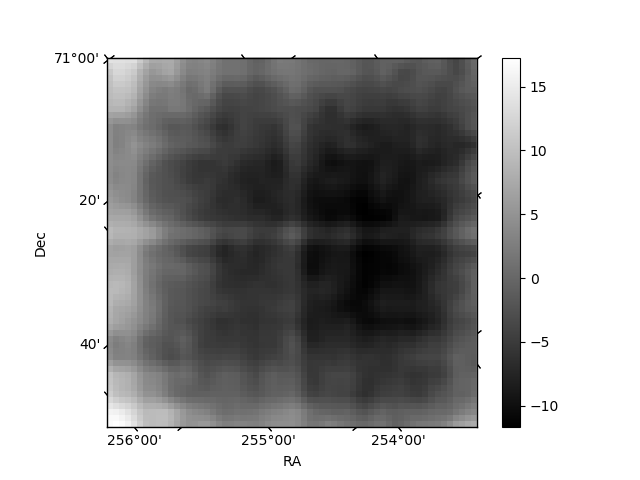
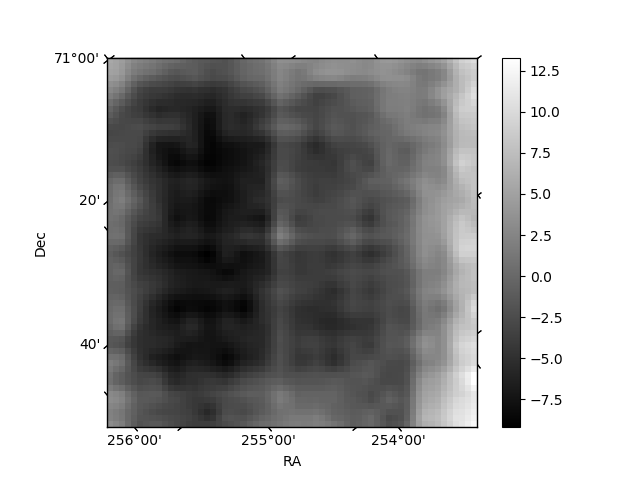
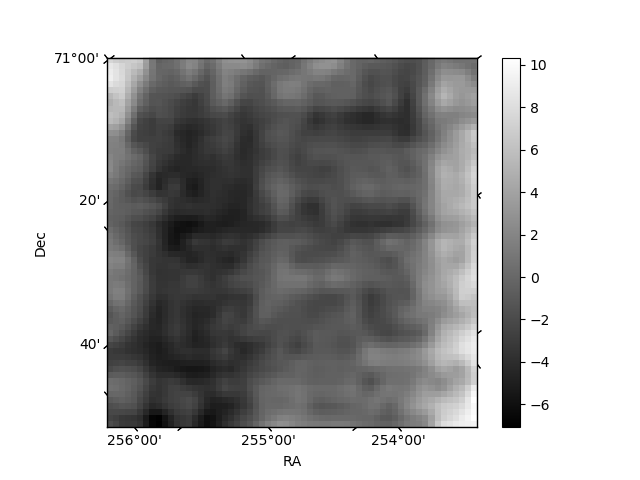
Histogram calculated using DETX and DETY for each event in the final _common_clean file
| Quadrant A | 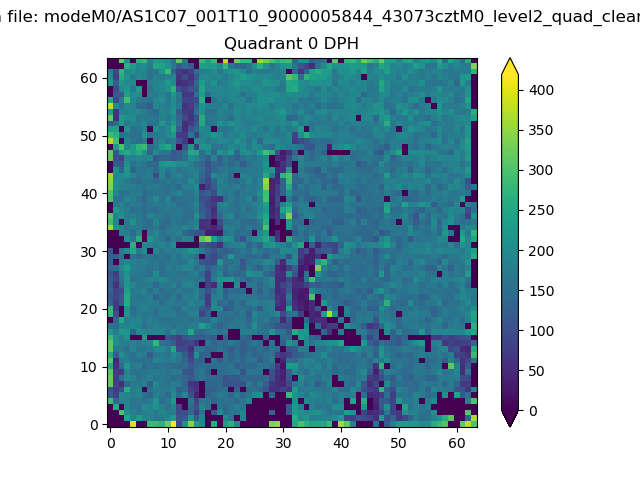 |
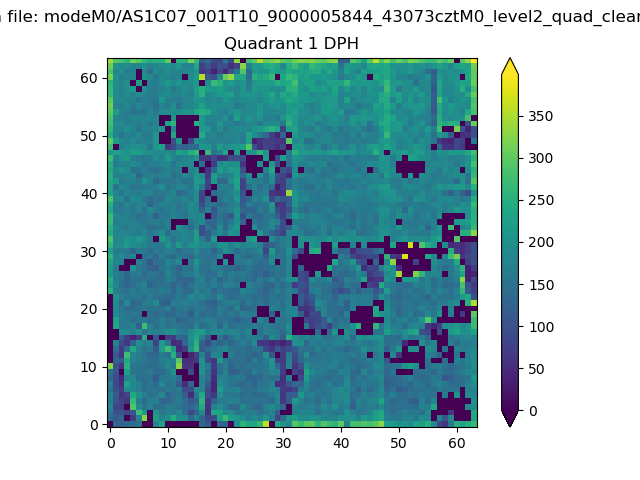 |
Quadrant B |
|---|---|---|---|
| Quadrant D | 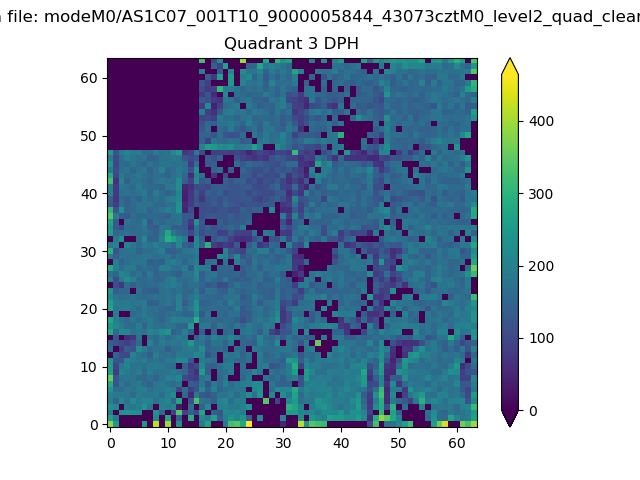 |
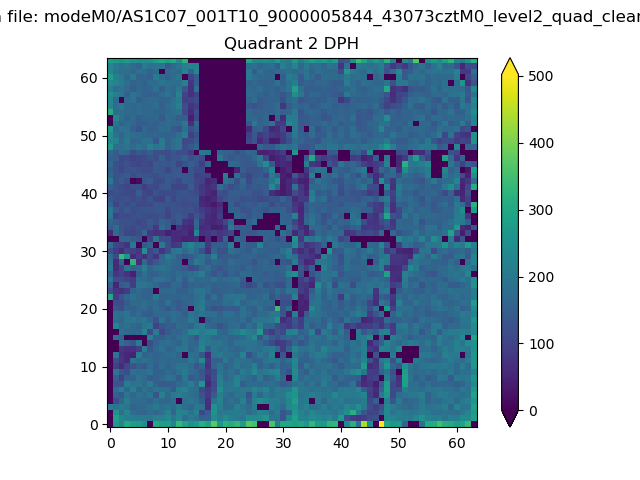 |
Quadrant C |
| Plot type | Count rate plots | Images |
|---|---|---|
| Comparison with Poisson distribution Blue bars denote a histogram of data divided into 1 sec bins. Red curve is a Poisson curve with rate = median count rate of data. |
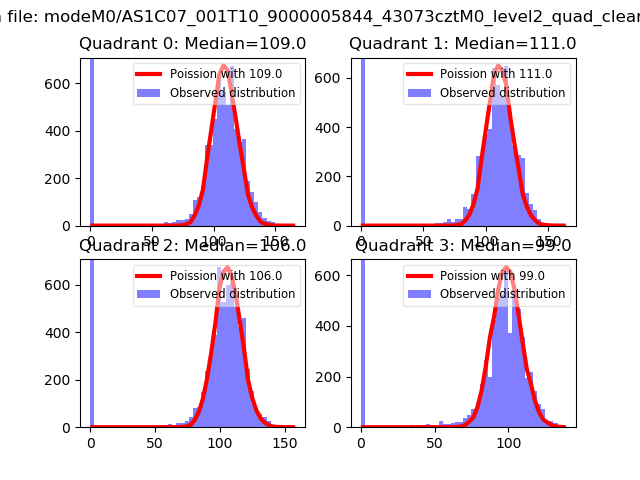 |
 |
| Quadrant-wise count rates Data is divided into 100 sec bins |
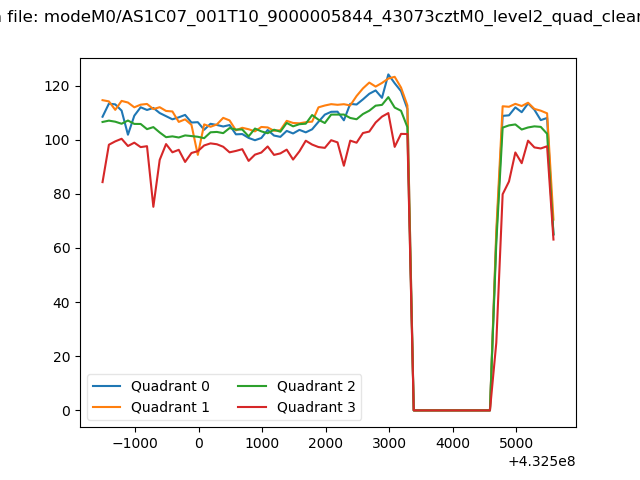 |
|
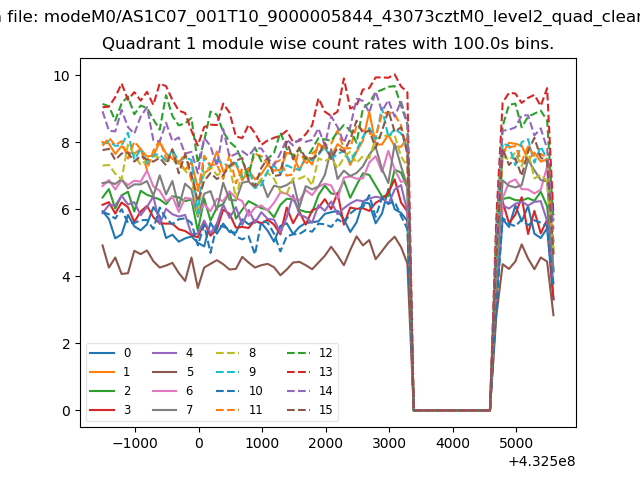
| Module-wise count rates for Quadrant A Data is divided into 100 sec bins |
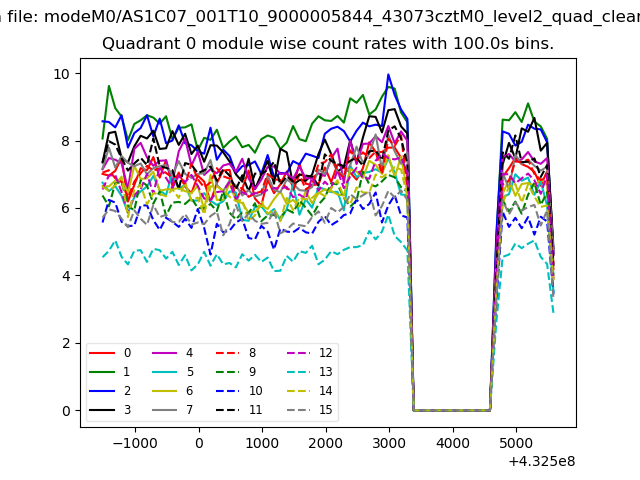 |
 |
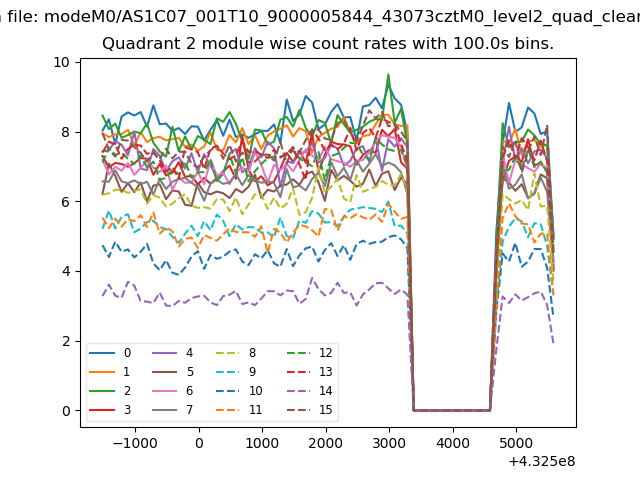
| Module-wise count rates for Quadrant B Data is divided into 100 sec bins |
 |
 |
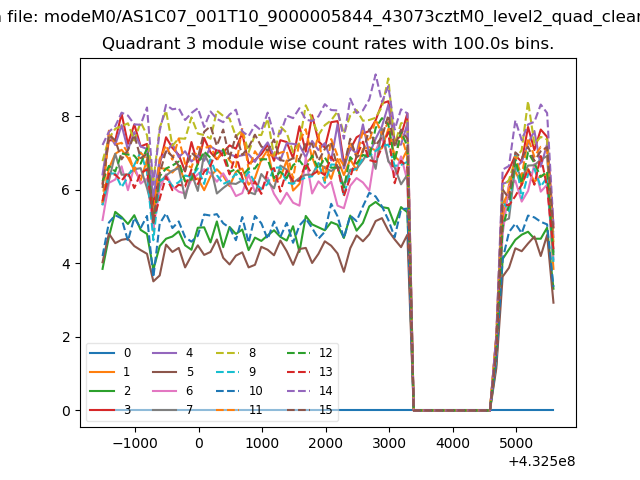
| Module-wise count rates for Quadrant C Data is divided into 100 sec bins |
 |
 |
| Module-wise count rates for Quadrant D Data is divided into 100 sec bins |
 |
 |
| Parameter | Plot |
|---|---|
| CZT HV Monitor | 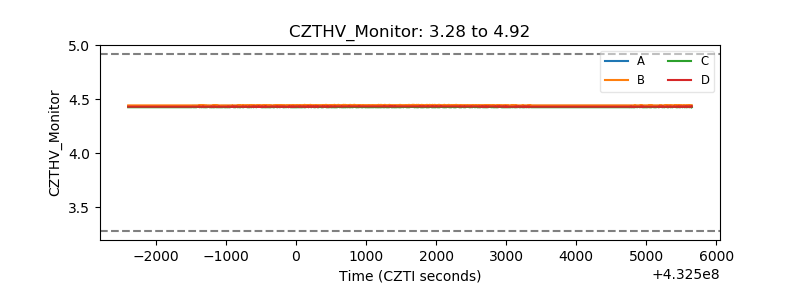 |
| D_VDD | 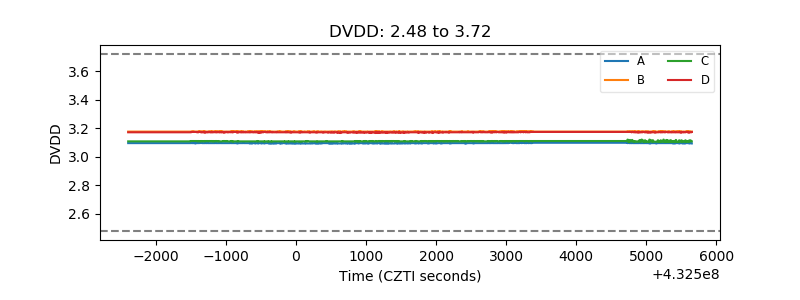 |
| Temperature 1 | 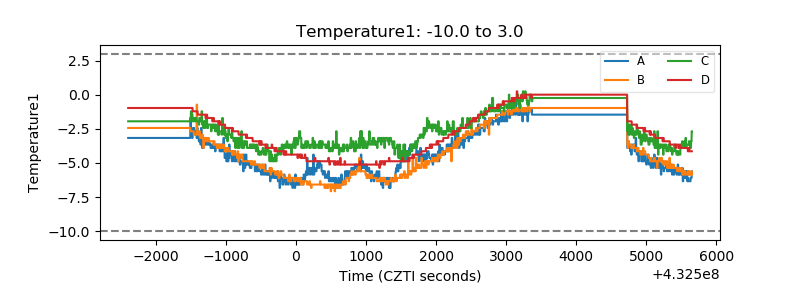 |
| Veto HV Monitor | 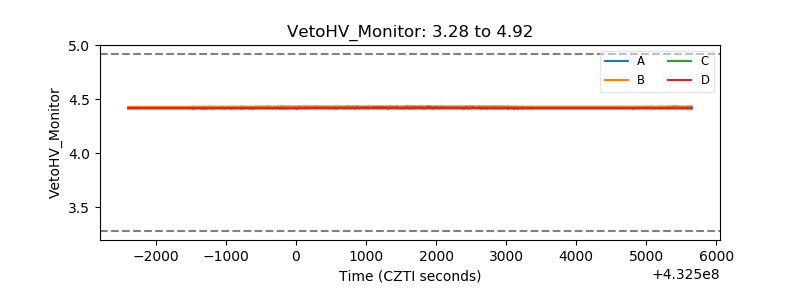 |
| Veto LLD | 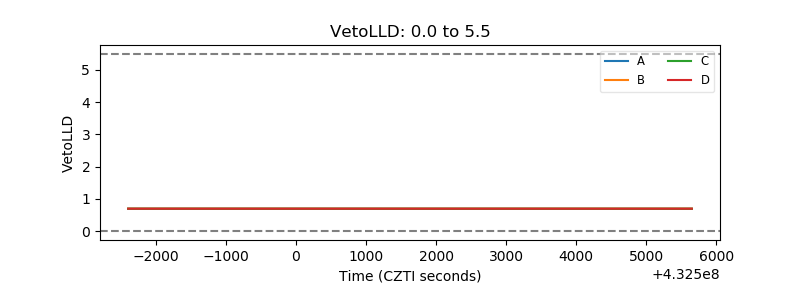 |
| Alpha Counter | 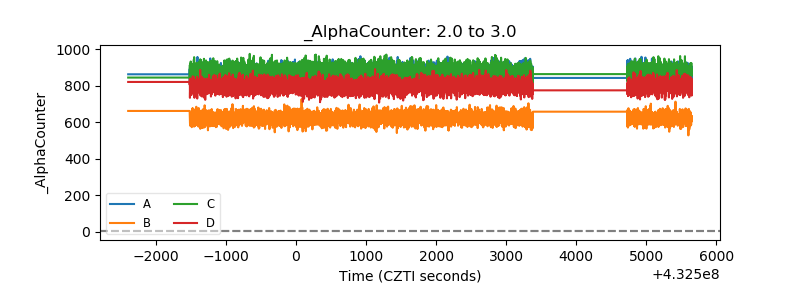 |
| _CPM_Rate | 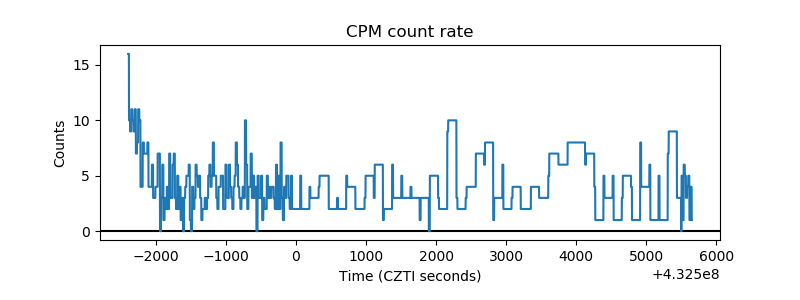 |
| CZT Counter | 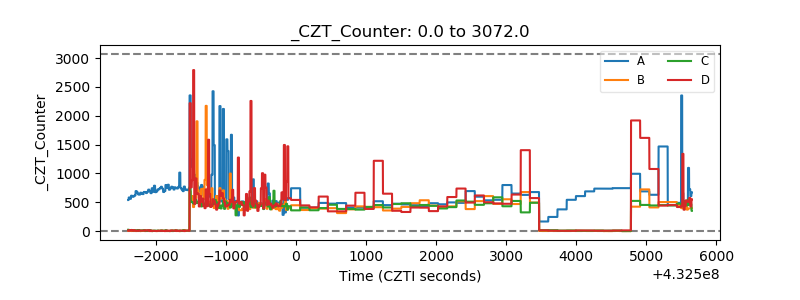 |
| +2.5 Volts monitor | 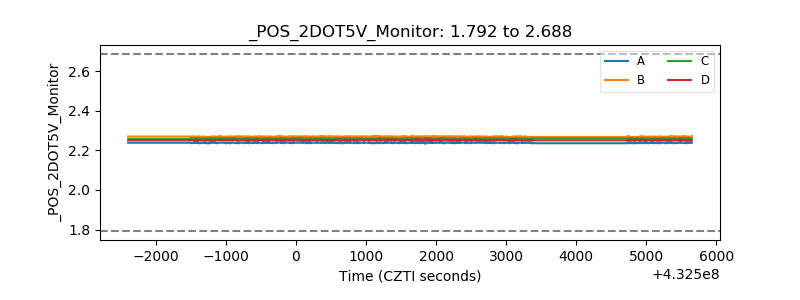 |
| +5 Volts monitor | 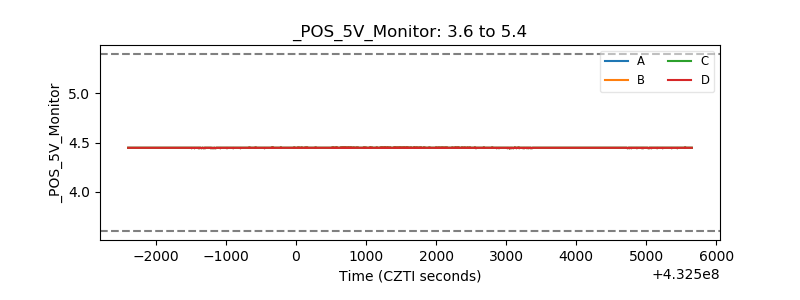 |
| _ROLL_ROT | 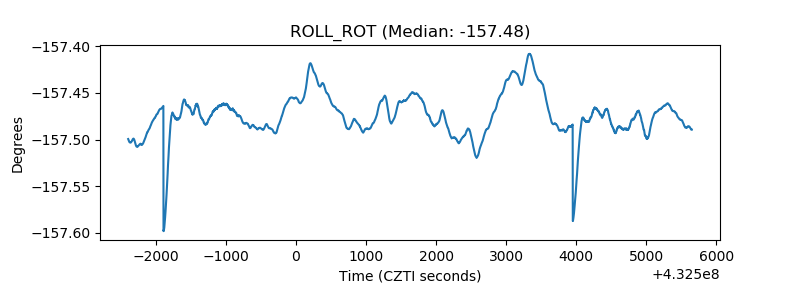 |
| _Roll_DEC | 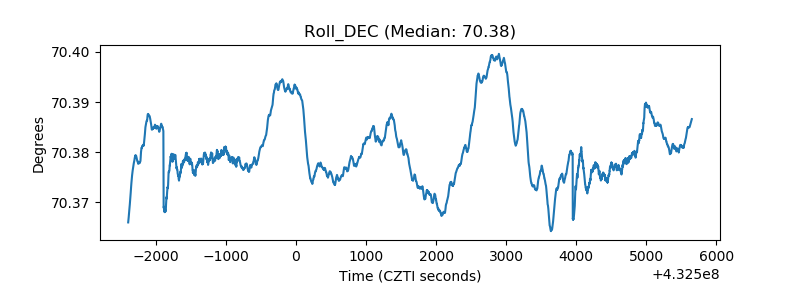 |
| _Roll_RA | 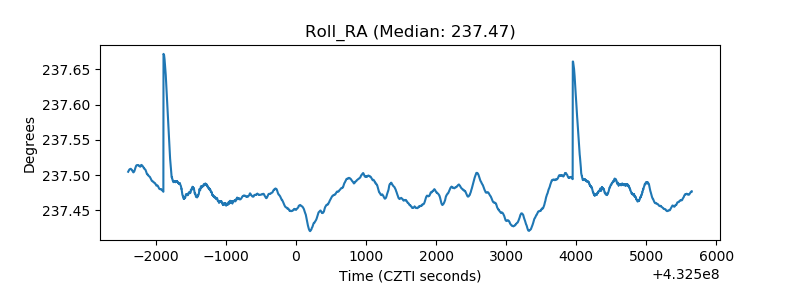 |
| Veto Counter | 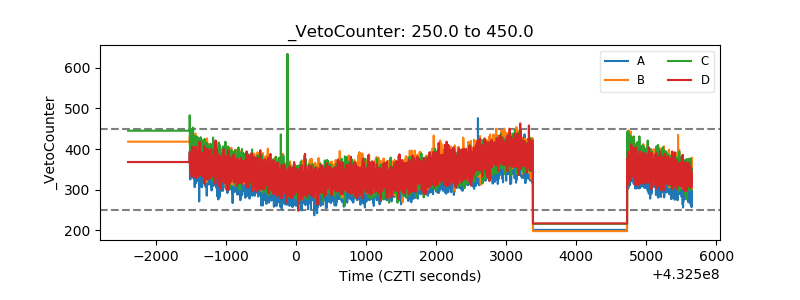 |