| Param | Original file | Final file |
|---|---|---|
| Filename | modeM0/AS1C07_001T10_9000005844_43074cztM0_level2.fits | modeM0/AS1C07_001T10_9000005844_43074cztM0_level2_quad_clean.evt |
| Size (bytes) | 372,637,440 | 96,462,720 |
| Size | 355.4 MB | 92.0 MB |
| Events in quadrant A | 3,481,305 | 645,625 |
| Events in quadrant B | 3,281,945 | 648,391 |
| Events in quadrant C | 2,839,263 | 631,129 |
| Events in quadrant D | 3,722,791 | 574,947 |
| Mode SS | |||
|---|---|---|---|
| Quadrant | BADHDUFLAG | Total packets | Discarded packets |
| A | 0 | 124 | 0 |
| B | 0 | 124 | 0 |
| C | 0 | 124 | 0 |
| D | 0 | 124 | 0 |
| Mode M9 | |||
|---|---|---|---|
| Quadrant | BADHDUFLAG | Total packets | Discarded packets |
| A | 0 | 24 | 0 |
| B | 0 | 25 | 0 |
| C | 0 | 25 | 0 |
| D | 0 | 25 | 0 |
| Mode M0 | |||
|---|---|---|---|
| Quadrant | BADHDUFLAG | Total packets | Discarded packets |
| A | 0 | 14102 | 2 |
| B | 0 | 13909 | 2 |
| C | 0 | 12301 | 3 |
| D | 0 | 15463 | 2 |
| Quadrant | Total seconds | Saturated seconds | Saturation percentage |
|---|---|---|---|
| A | 6017 | 69 | 1.146751% |
| B | 6017 | 146 | 2.426458% |
| C | 6016 | 4 | 0.066489% |
| D | 6016 | 235 | 3.906250% |
Noise dominated data is calculated using 1-second bins in cleaned event files. If a bin has >2000 counts, and if more than 50% of those come from <1% of pixels, then it is considered to be noise-dominated and hence unusable.
| Quadrant | # 1 sec bins | Bins with >0 counts | Bins with >2000 counts | High rate bins dominated by noise | Noise dominated (total time) | Noise dominated (detector-on time) | Marked lightcurve |
|---|---|---|---|---|---|---|---|
| A | 7300 | 6018 | 44 | 44 | 0.60% | 0.73% | 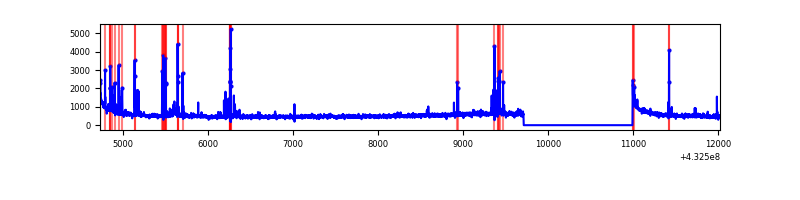 |
| B | 7300 | 6018 | 95 | 95 | 1.30% | 1.58% | 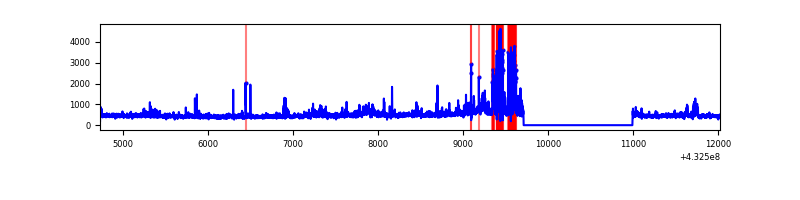 |
| C | 7299 | 6017 | 2 | 2 | 0.03% | 0.03% | 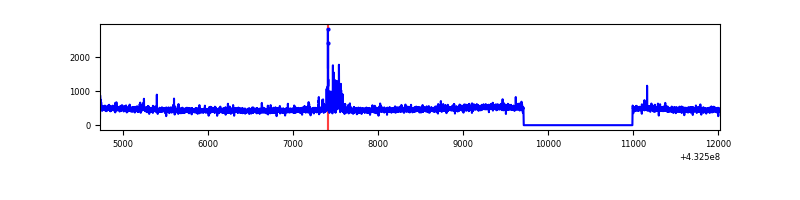 |
| D | 7299 | 6017 | 176 | 176 | 2.41% | 2.93% | 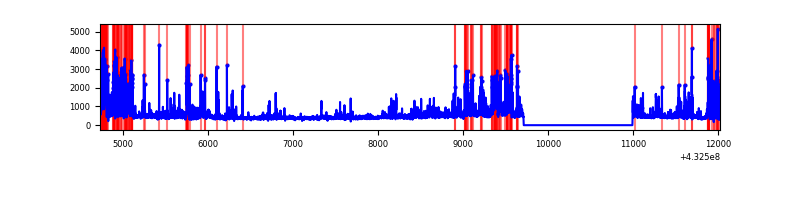 |
Top three noisy pixels from each quadrant. If the there are fewer than three noisy pixels in the level2.evt file, extra rows are filled as -1
| Pixel properties | Quadrant properties | ||||||
|---|---|---|---|---|---|---|---|
| Quadrant | DetID | PixID | Counts | Sigma | Mean | Median | Sigma |
| A | 10 | 83 | 648006 | 4891.09 | 644 | 631 | 132.4 |
| A | 15 | 237 | 175273 | 1319.47 | 644 | 631 | 132.4 |
| A | 12 | 189 | 84165 | 631.12 | 644 | 631 | 132.4 |
| B | 0 | 229 | 638206 | 5154.54 | 636 | 617 | 123.7 |
| B | 5 | 255 | 62156 | 497.51 | 636 | 617 | 123.7 |
| B | 4 | 171 | 28129 | 222.42 | 636 | 617 | 123.7 |
| C | 15 | 214 | 272970 | 1829.36 | 631 | 634 | 148.9 |
| C | 14 | 254 | 73023 | 486.26 | 631 | 634 | 148.9 |
| C | 12 | 2 | 12296 | 78.34 | 631 | 634 | 148.9 |
| D | 2 | 249 | 437979 | 2842.58 | 625 | 607 | 153.9 |
| D | 13 | 249 | 306154 | 1985.82 | 625 | 607 | 153.9 |
| D | 1 | 52 | 284293 | 1843.74 | 625 | 607 | 153.9 |
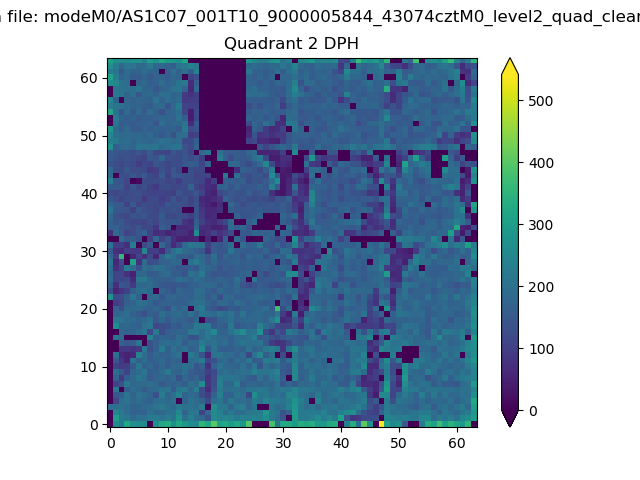
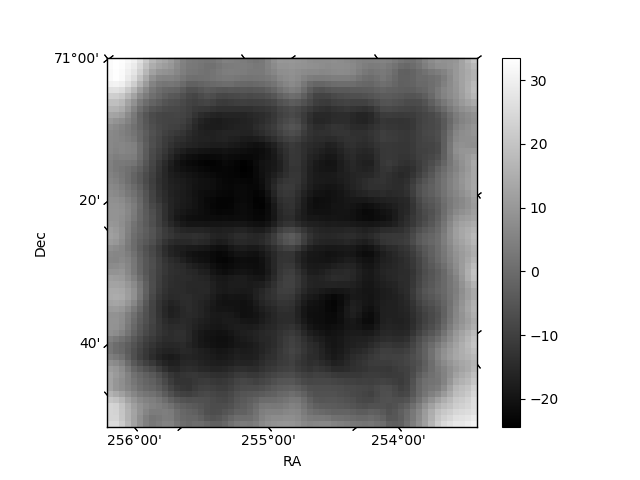
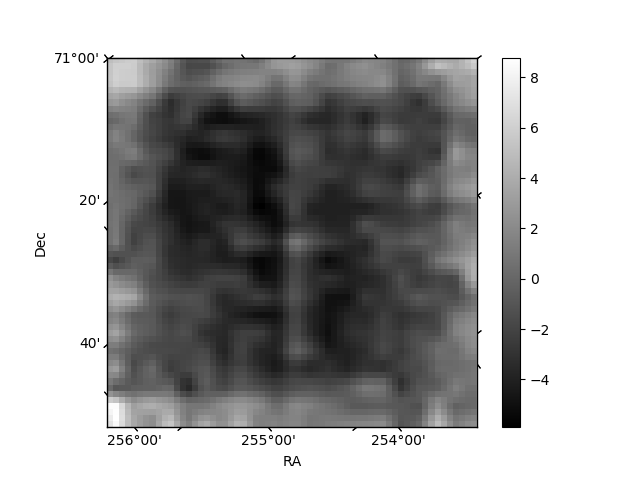
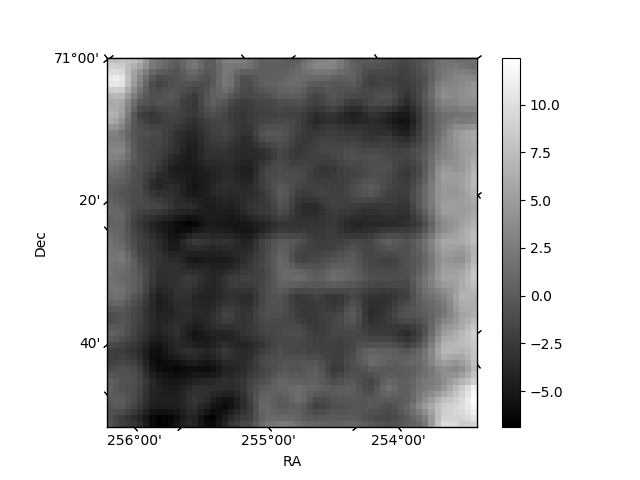
Histogram calculated using DETX and DETY for each event in the final _common_clean file
| Quadrant A | 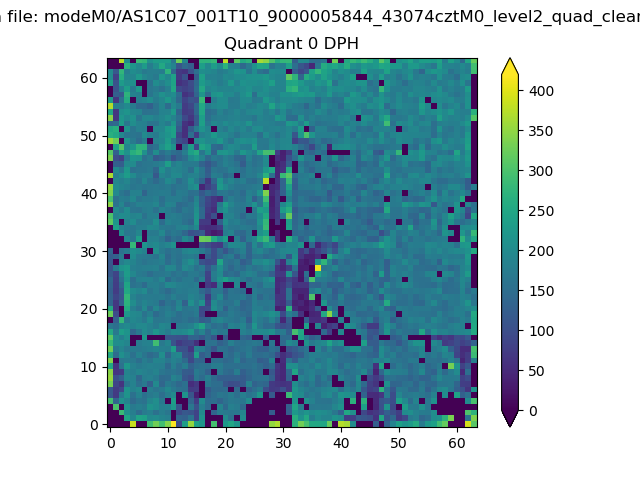 |
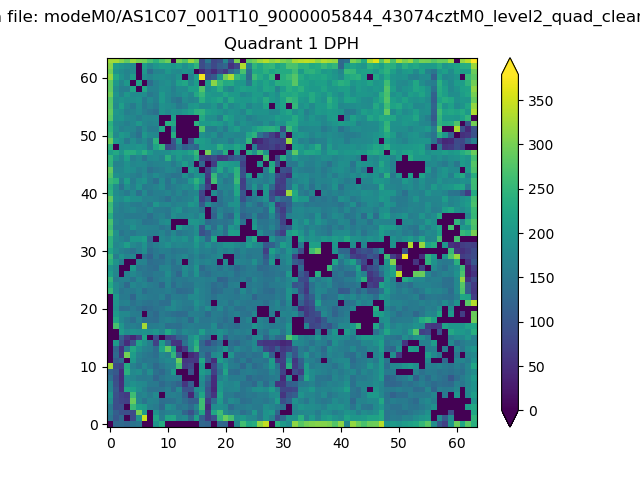 |
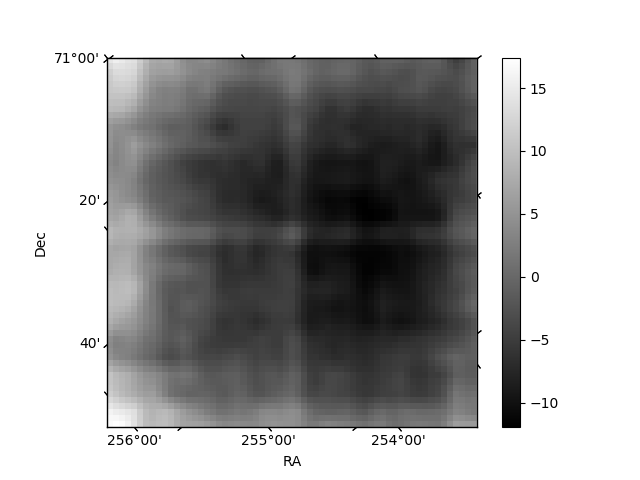
Quadrant B |
|---|---|---|---|
| Quadrant D | 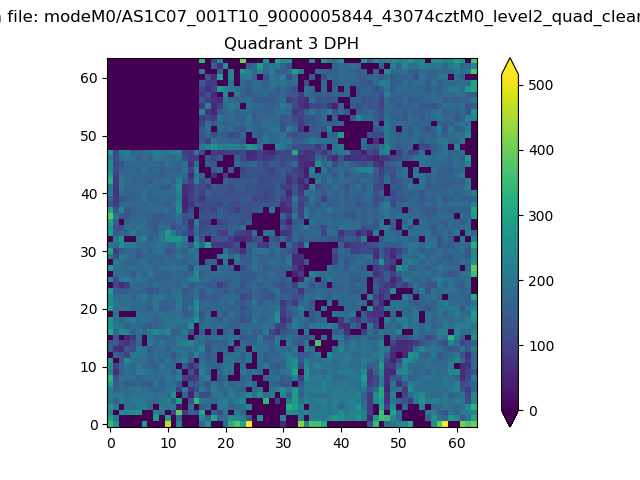 |
 |
Quadrant C |
| Plot type | Count rate plots | Images |
|---|---|---|
| Comparison with Poisson distribution Blue bars denote a histogram of data divided into 1 sec bins. Red curve is a Poisson curve with rate = median count rate of data. |
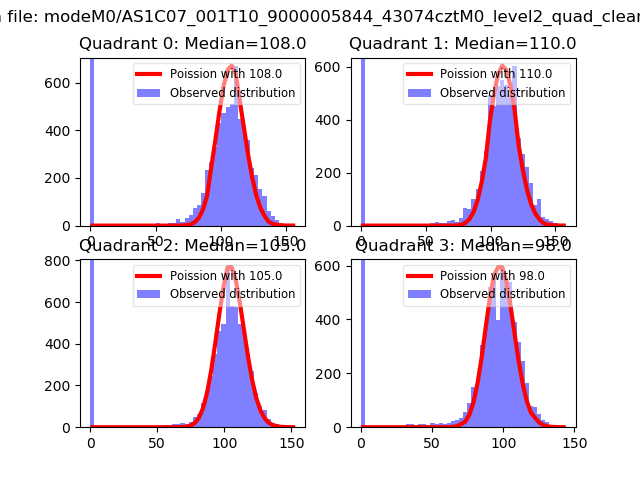 |
 |
| Quadrant-wise count rates Data is divided into 100 sec bins |
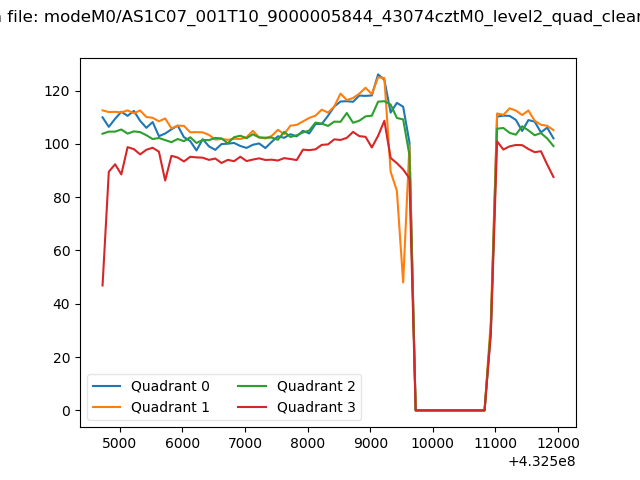 |
|
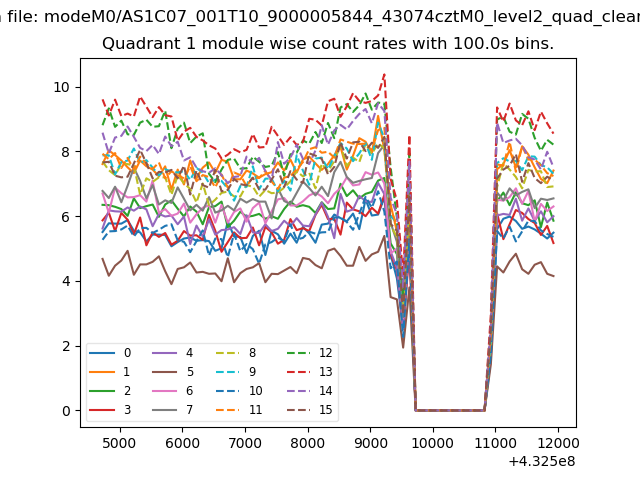
| Module-wise count rates for Quadrant A Data is divided into 100 sec bins |
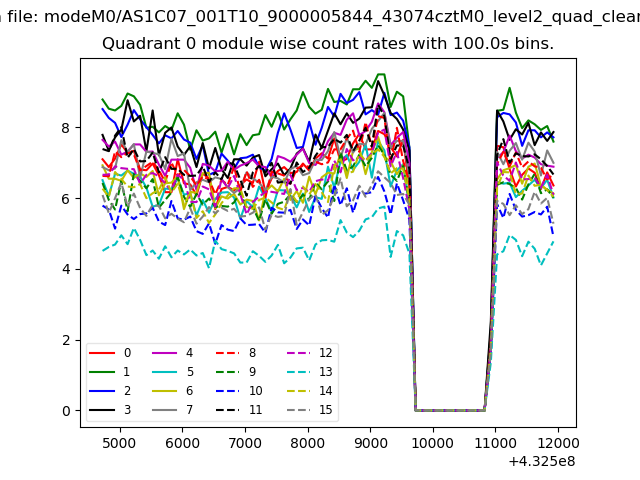 |
 |
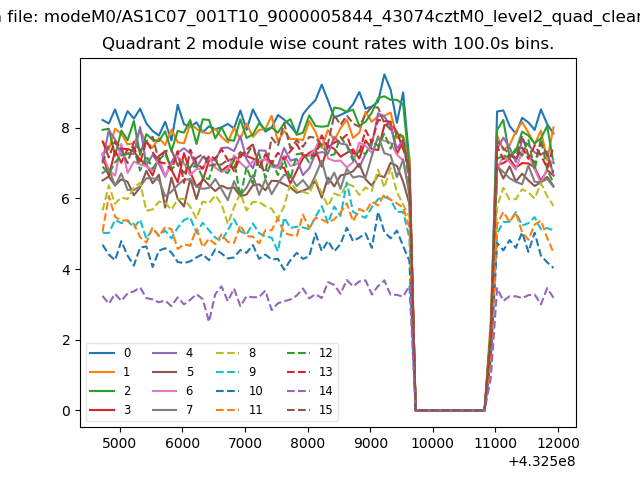
| Module-wise count rates for Quadrant B Data is divided into 100 sec bins |
 |
 |
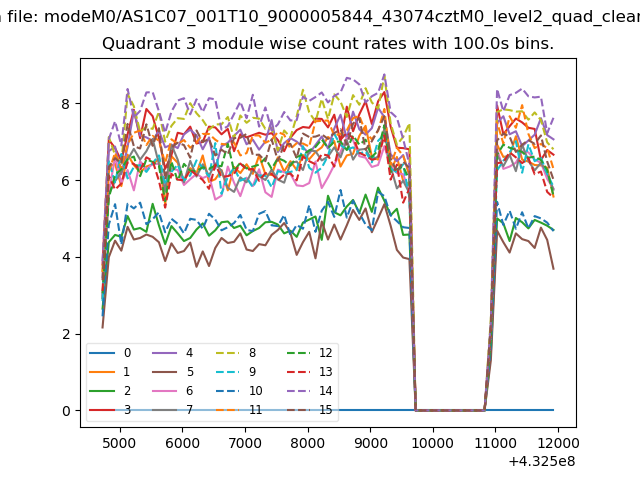
| Module-wise count rates for Quadrant C Data is divided into 100 sec bins |
 |
 |
| Module-wise count rates for Quadrant D Data is divided into 100 sec bins |
 |
 |
| Parameter | Plot |
|---|---|
| CZT HV Monitor | 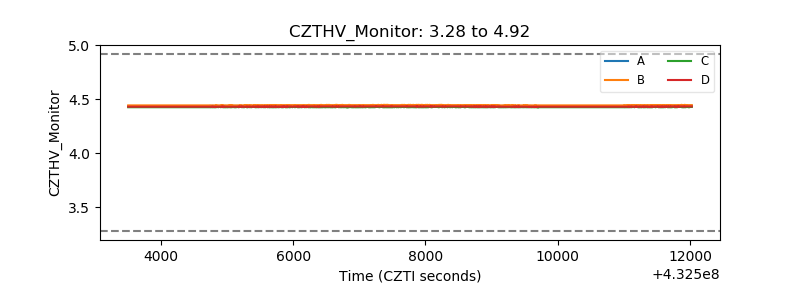 |
| D_VDD | 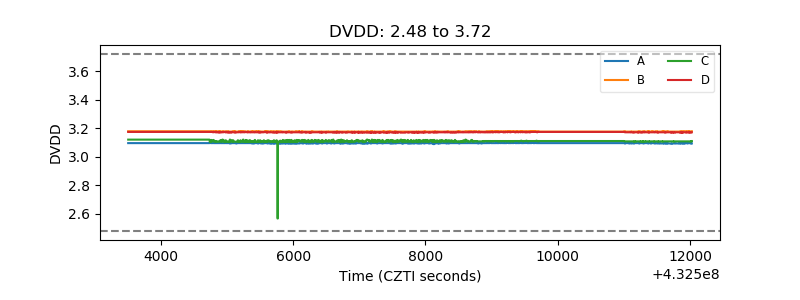 |
| Temperature 1 | 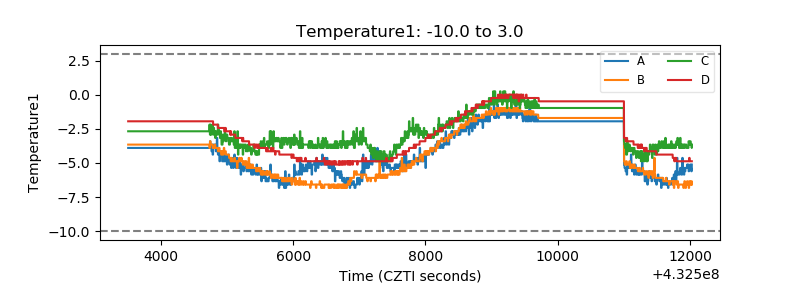 |
| Veto HV Monitor | 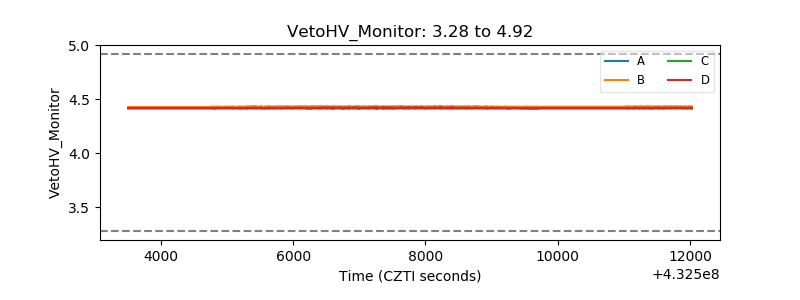 |
| Veto LLD | 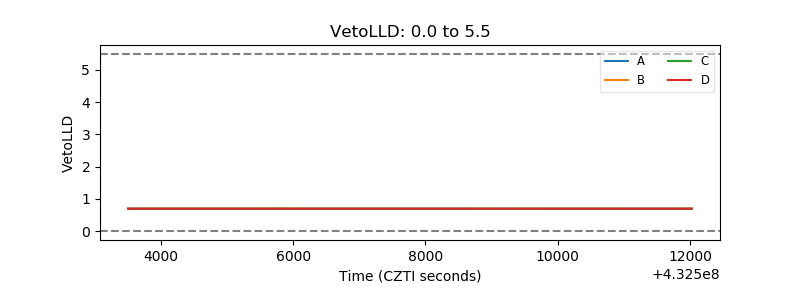 |
| Alpha Counter | 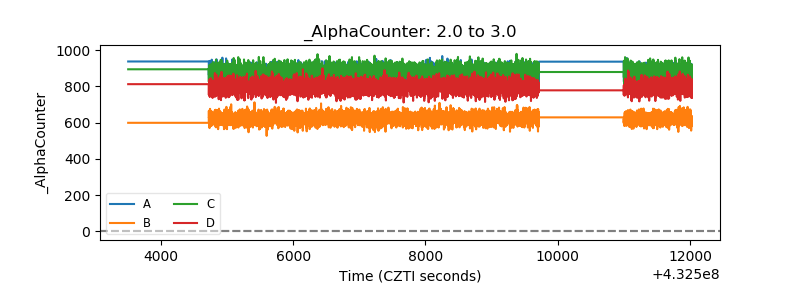 |
| _CPM_Rate | 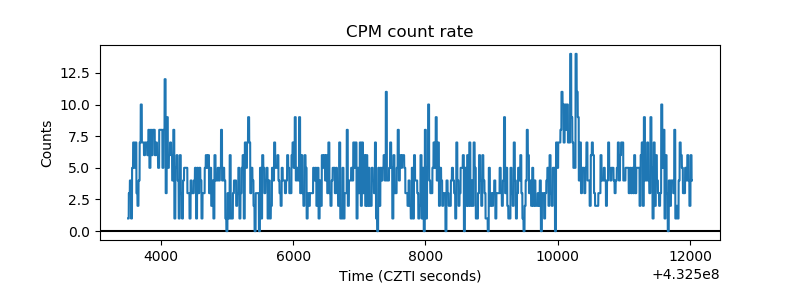 |
| CZT Counter | 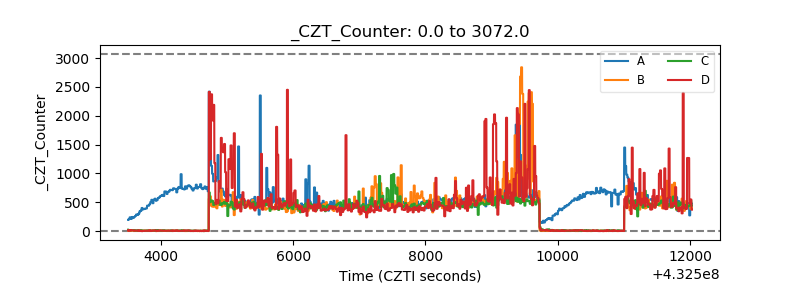 |
| +2.5 Volts monitor | 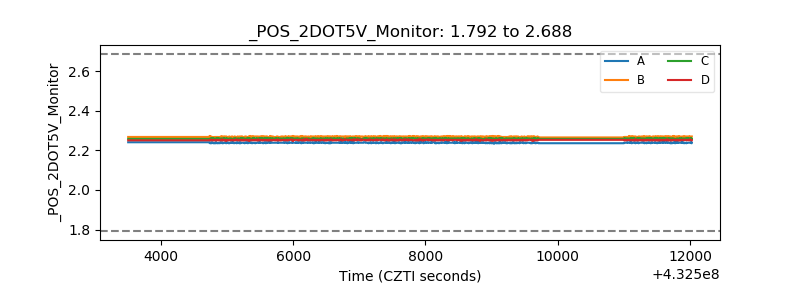 |
| +5 Volts monitor | 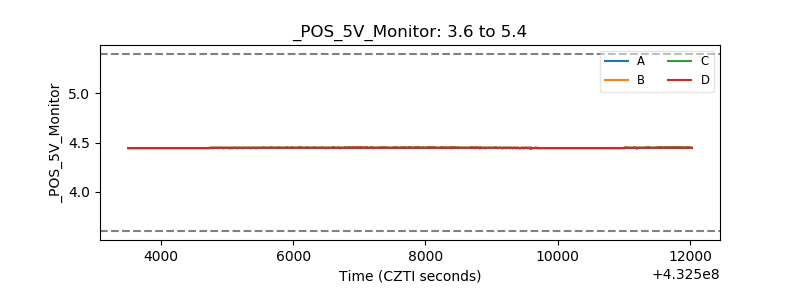 |
| _ROLL_ROT | 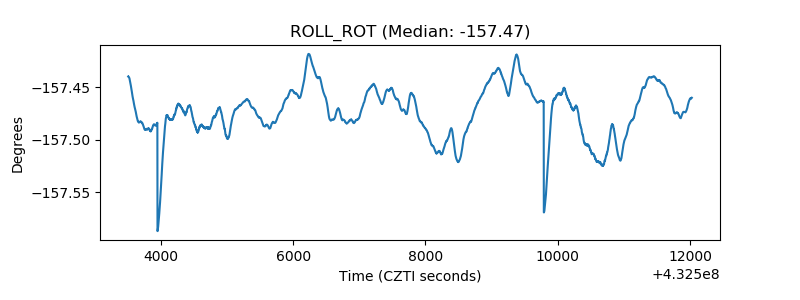 |
| _Roll_DEC | 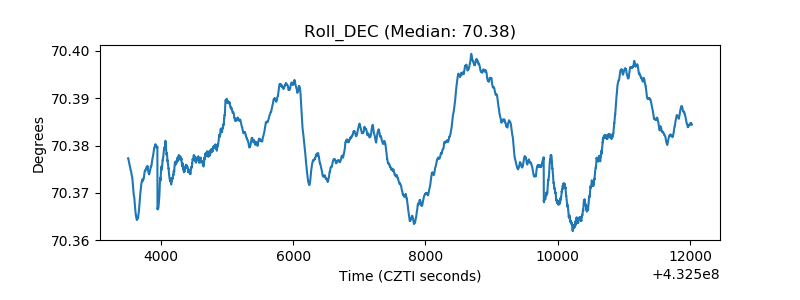 |
| _Roll_RA | 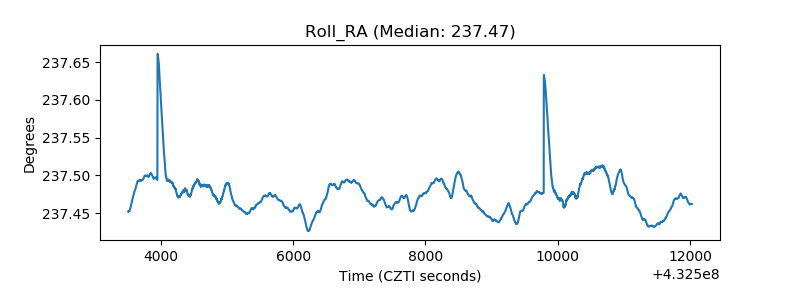 |
| Veto Counter | 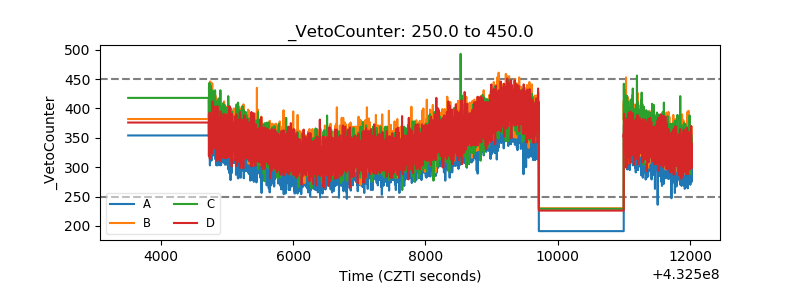 |