| Param | Original file | Final file |
|---|---|---|
| Filename | modeM0/AS1C07_001T10_9000005844_43076cztM0_level2.fits | modeM0/AS1C07_001T10_9000005844_43076cztM0_level2_quad_clean.evt |
| Size (bytes) | 685,100,160 | 170,058,240 |
| Size | 653.4 MB | 162.2 MB |
| Events in quadrant A | 6,024,518 | 1,143,477 |
| Events in quadrant B | 5,020,858 | 1,179,184 |
| Events in quadrant C | 4,985,807 | 1,119,578 |
| Events in quadrant D | 8,490,146 | 957,851 |
| Mode SS | |||
|---|---|---|---|
| Quadrant | BADHDUFLAG | Total packets | Discarded packets |
| A | 0 | 220 | 0 |
| B | 0 | 220 | 0 |
| C | 0 | 220 | 0 |
| D | 0 | 220 | 0 |
| Mode M9 | |||
|---|---|---|---|
| Quadrant | BADHDUFLAG | Total packets | Discarded packets |
| A | 0 | 33 | 0 |
| B | 0 | 34 | 0 |
| C | 0 | 34 | 0 |
| D | 0 | 34 | 0 |
| Mode M0 | |||
|---|---|---|---|
| Quadrant | BADHDUFLAG | Total packets | Discarded packets |
| A | 0 | 24823 | 3 |
| B | 0 | 22416 | 3 |
| C | 0 | 21882 | 3 |
| D | 0 | 33159 | 3 |
| Quadrant | Total seconds | Saturated seconds | Saturation percentage |
|---|---|---|---|
| A | 10813 | 89 | 0.823083% |
| B | 10813 | 18 | 0.166466% |
| C | 10813 | 8 | 0.073985% |
| D | 10813 | 1005 | 9.294368% |
Noise dominated data is calculated using 1-second bins in cleaned event files. If a bin has >2000 counts, and if more than 50% of those come from <1% of pixels, then it is considered to be noise-dominated and hence unusable.
| Quadrant | # 1 sec bins | Bins with >0 counts | Bins with >2000 counts | High rate bins dominated by noise | Noise dominated (total time) | Noise dominated (detector-on time) | Marked lightcurve |
|---|---|---|---|---|---|---|---|
| A | 13588 | 10815 | 63 | 63 | 0.46% | 0.58% | 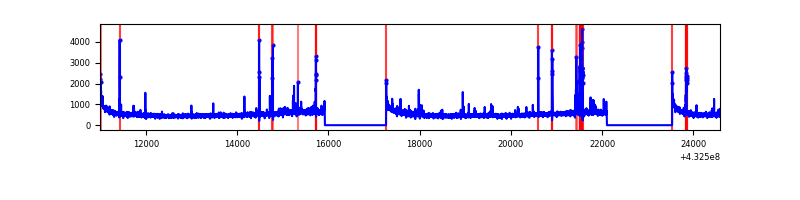 |
| B | 13588 | 10815 | 4 | 4 | 0.03% | 0.04% | 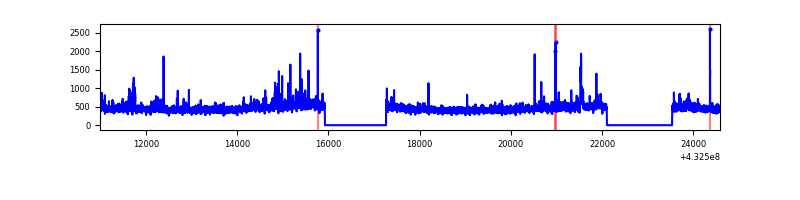 |
| C | 13588 | 10815 | 1 | 1 | 0.01% | 0.01% | 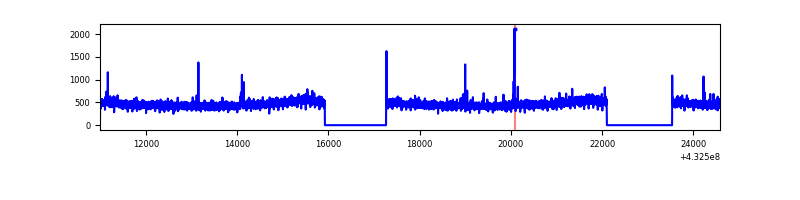 |
| D | 13588 | 10815 | 851 | 851 | 6.26% | 7.87% | 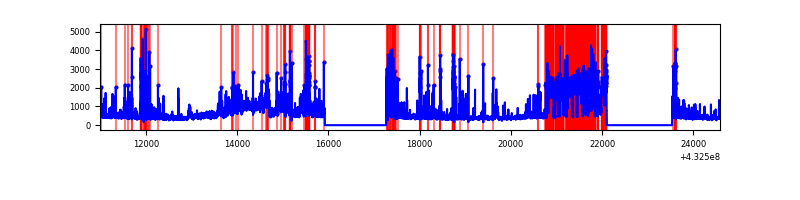 |
Top three noisy pixels from each quadrant. If the there are fewer than three noisy pixels in the level2.evt file, extra rows are filled as -1
| Pixel properties | Quadrant properties | ||||||
|---|---|---|---|---|---|---|---|
| Quadrant | DetID | PixID | Counts | Sigma | Mean | Median | Sigma |
| A | 10 | 83 | 1081957 | 4539.43 | 1164 | 1141 | 238.1 |
| A | 15 | 237 | 272961 | 1141.64 | 1164 | 1141 | 238.1 |
| A | 12 | 189 | 64914 | 267.85 | 1164 | 1141 | 238.1 |
| B | 0 | 229 | 281168 | 1247.44 | 1163 | 1128 | 224.5 |
| B | 5 | 255 | 57890 | 252.85 | 1163 | 1128 | 224.5 |
| B | 0 | 230 | 40387 | 174.88 | 1163 | 1128 | 224.5 |
| C | 15 | 214 | 480053 | 1810.95 | 1138 | 1143 | 264.5 |
| C | 0 | 207 | 21594 | 77.33 | 1138 | 1143 | 264.5 |
| C | 14 | 254 | 14881 | 51.95 | 1138 | 1143 | 264.5 |
| D | 2 | 16 | 2585630 | 9570.67 | 1105 | 1073 | 270.0 |
| D | 13 | 249 | 765376 | 2830.23 | 1105 | 1073 | 270.0 |
| D | 10 | 118 | 305200 | 1126.19 | 1105 | 1073 | 270.0 |
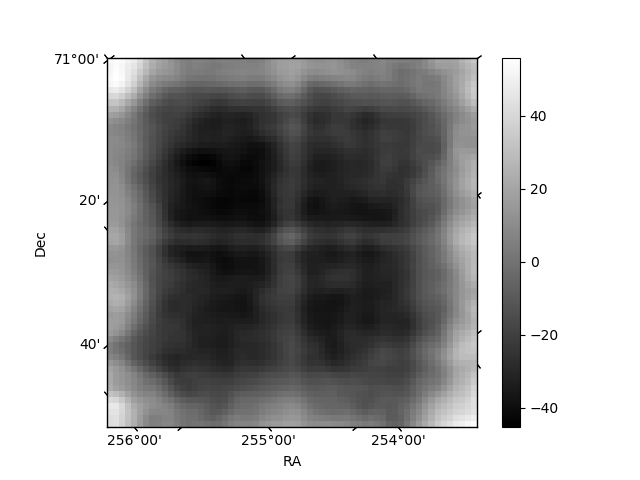
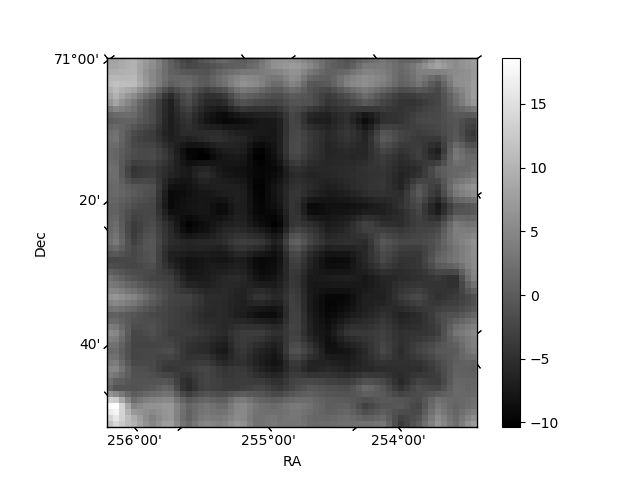
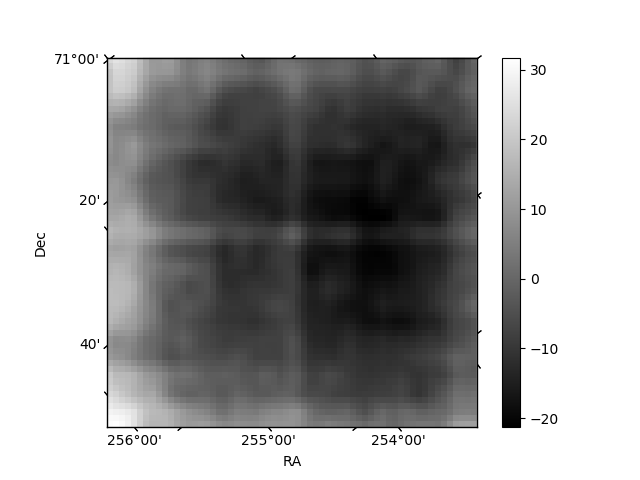
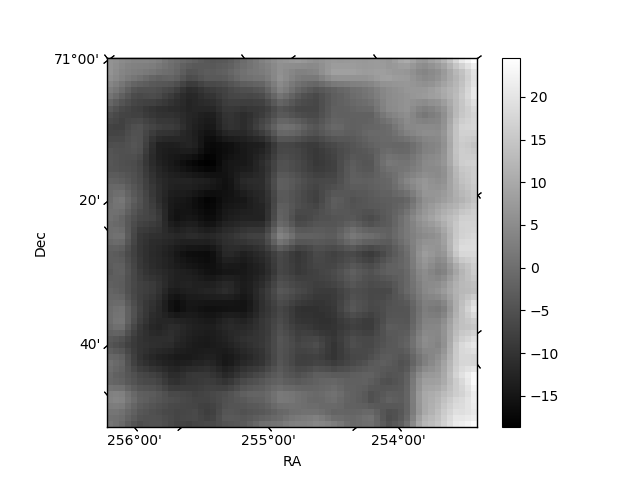
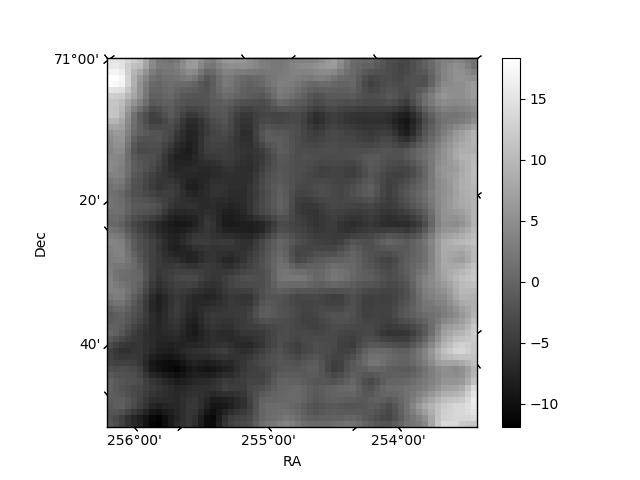
Histogram calculated using DETX and DETY for each event in the final _common_clean file
| Quadrant A | 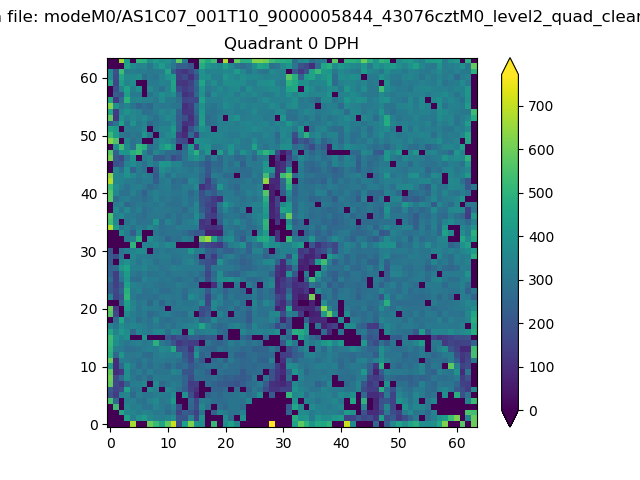 |
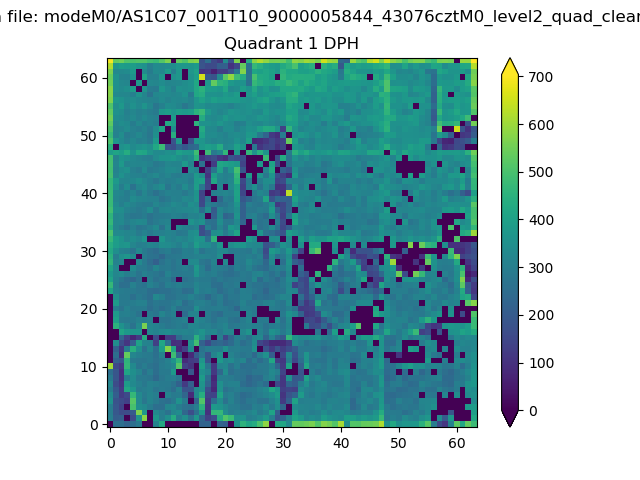 |
Quadrant B |
|---|---|---|---|
| Quadrant D |  |
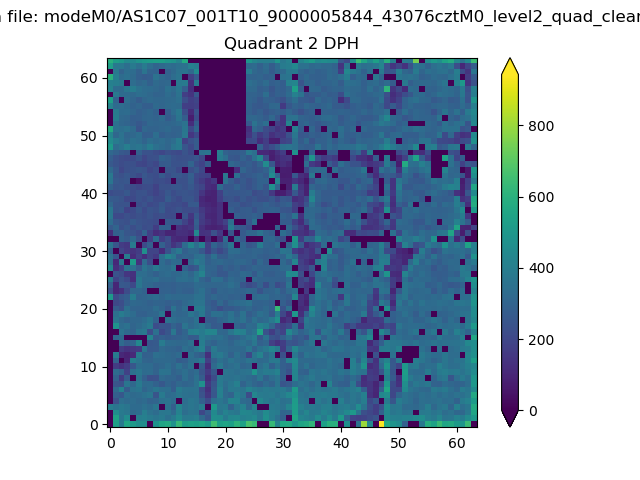 |
Quadrant C |
| Plot type | Count rate plots | Images |
|---|---|---|
| Comparison with Poisson distribution Blue bars denote a histogram of data divided into 1 sec bins. Red curve is a Poisson curve with rate = median count rate of data. |
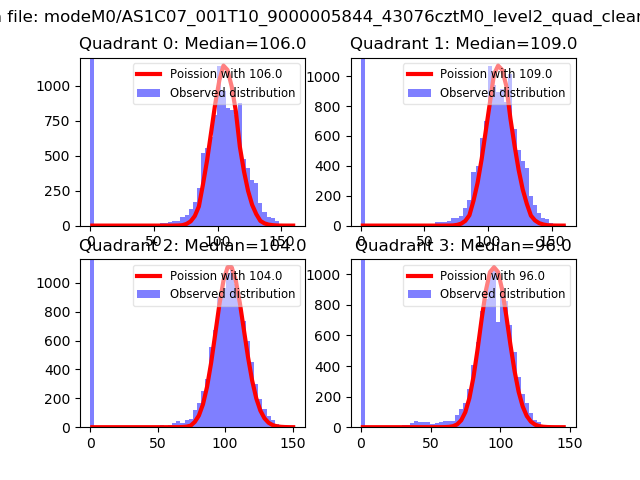 |
 |
| Quadrant-wise count rates Data is divided into 100 sec bins |
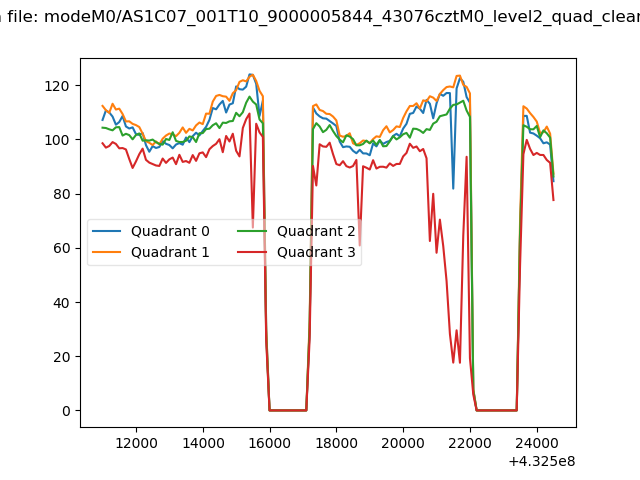 |
|
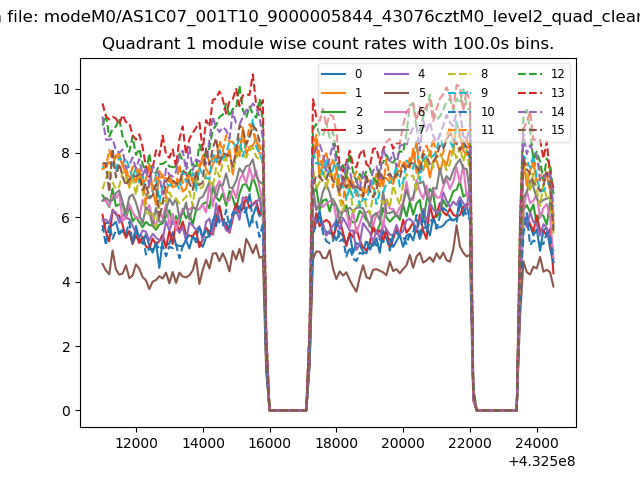
| Module-wise count rates for Quadrant A Data is divided into 100 sec bins |
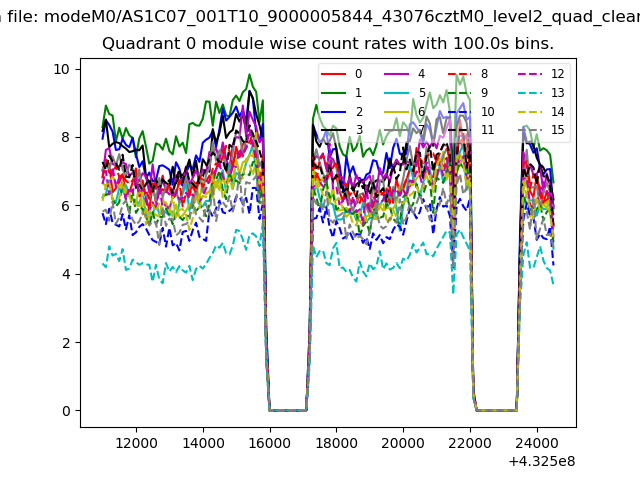 |
 |
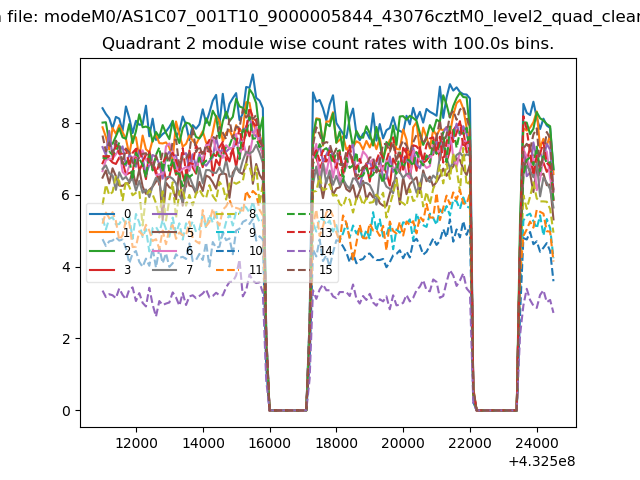
| Module-wise count rates for Quadrant B Data is divided into 100 sec bins |
 |
 |
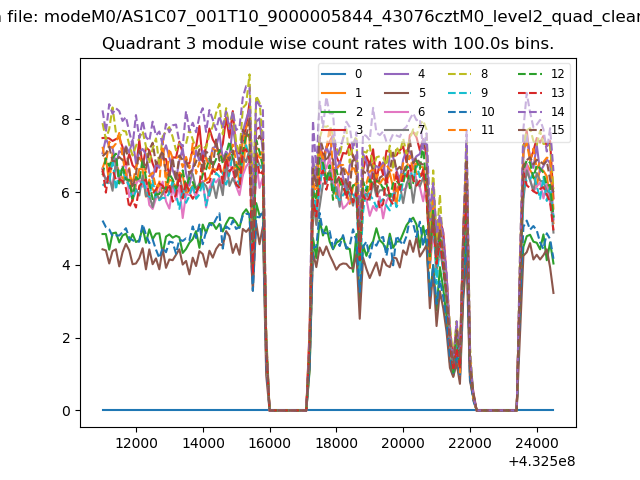
| Module-wise count rates for Quadrant C Data is divided into 100 sec bins |
 |
 |
| Module-wise count rates for Quadrant D Data is divided into 100 sec bins |
 |
 |
| Parameter | Plot |
|---|---|
| CZT HV Monitor | 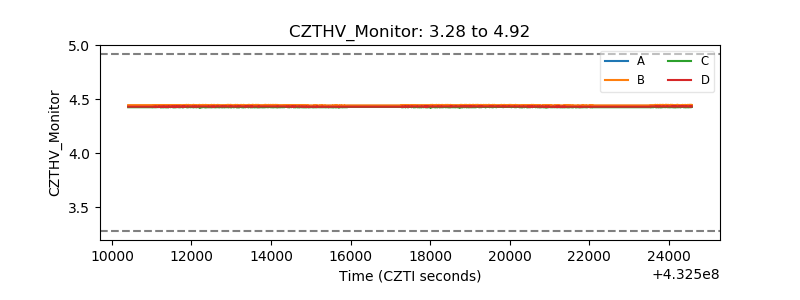 |
| D_VDD | 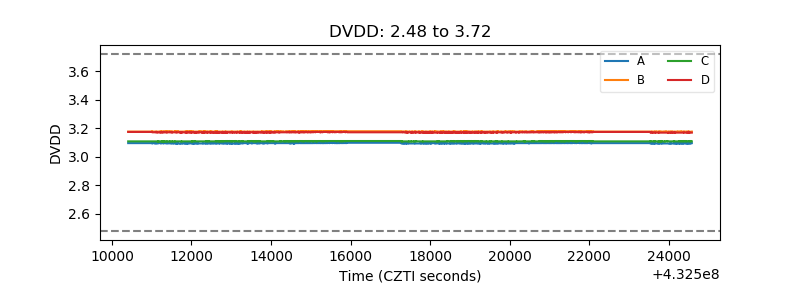 |
| Temperature 1 | 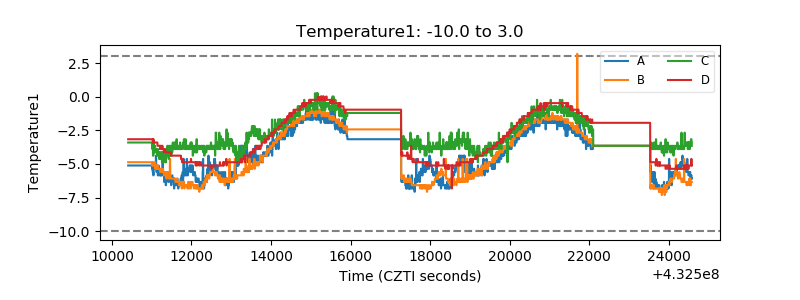 |
| Veto HV Monitor |  |
| Veto LLD | 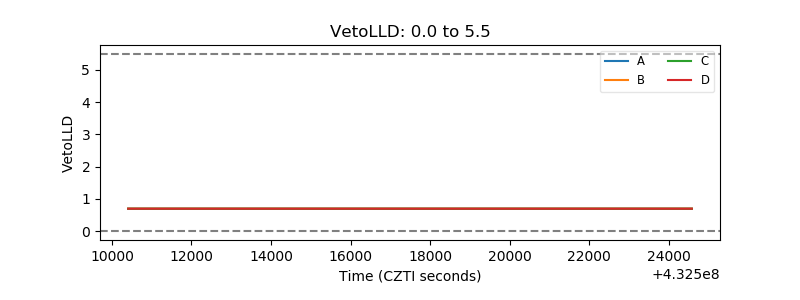 |
| Alpha Counter | 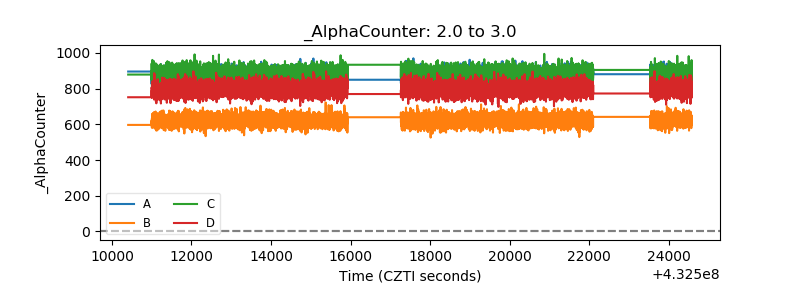 |
| _CPM_Rate | 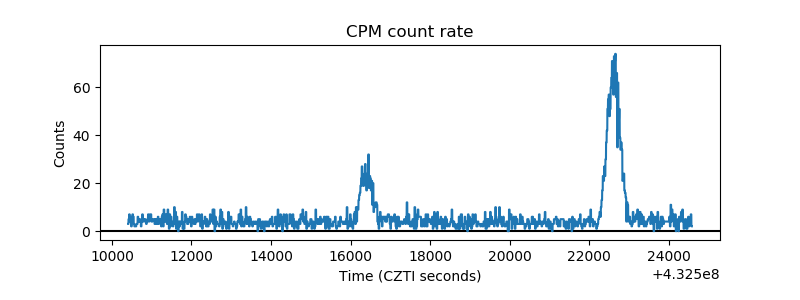 |
| CZT Counter | 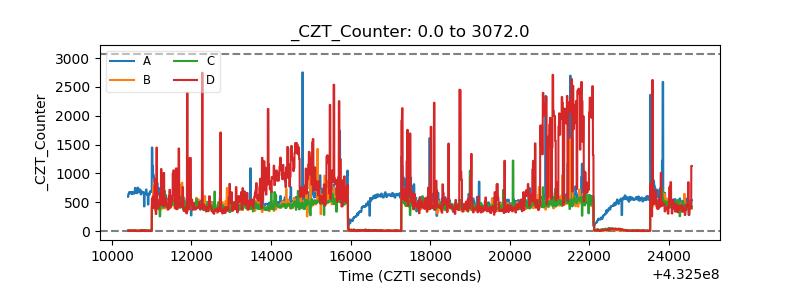 |
| +2.5 Volts monitor | 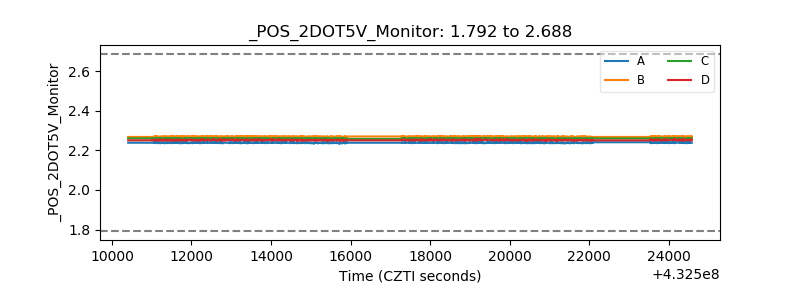 |
| +5 Volts monitor | 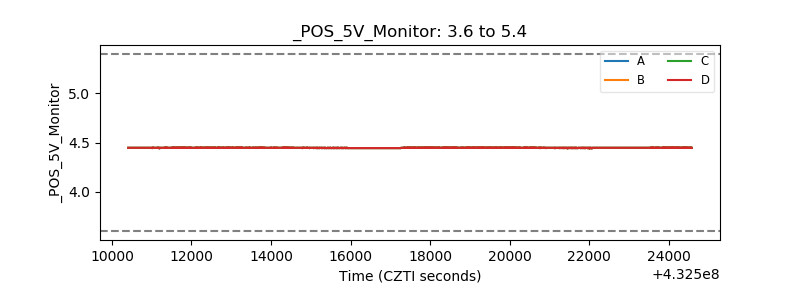 |
| _ROLL_ROT | 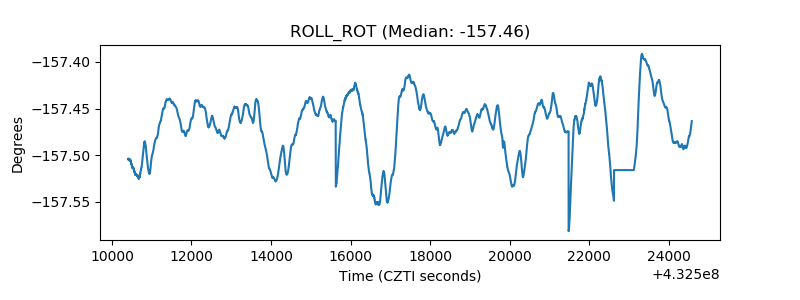 |
| _Roll_DEC | 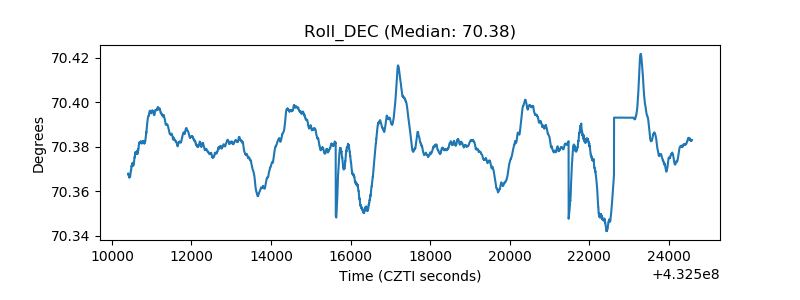 |
| _Roll_RA | 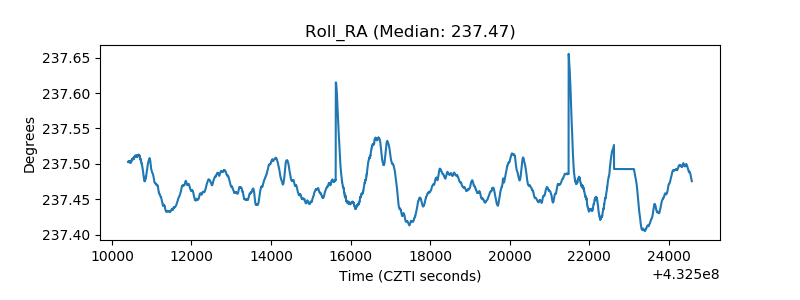 |
| Veto Counter | 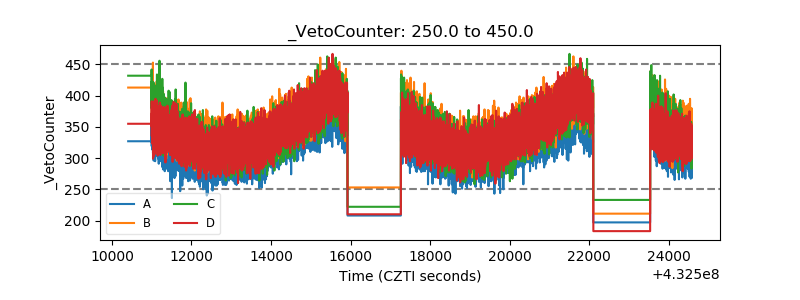 |