| Param | Original file | Final file |
|---|---|---|
| Filename | modeM0/AS1C07_001T10_9000005844_43077cztM0_level2.fits | modeM0/AS1C07_001T10_9000005844_43077cztM0_level2_quad_clean.evt |
| Size (bytes) | 355,950,720 | 88,159,680 |
| Size | 339.5 MB | 84.1 MB |
| Events in quadrant A | 3,222,836 | 590,976 |
| Events in quadrant B | 2,874,680 | 604,825 |
| Events in quadrant C | 2,601,201 | 581,395 |
| Events in quadrant D | 4,043,463 | 502,183 |
| Mode SS | |||
|---|---|---|---|
| Quadrant | BADHDUFLAG | Total packets | Discarded packets |
| A | 0 | 114 | 0 |
| B | 0 | 114 | 0 |
| C | 0 | 114 | 0 |
| D | 0 | 114 | 0 |
| Mode M9 | |||
|---|---|---|---|
| Quadrant | BADHDUFLAG | Total packets | Discarded packets |
| A | 0 | 15 | 0 |
| B | 0 | 15 | 0 |
| C | 0 | 15 | 0 |
| D | 0 | 15 | 0 |
| Mode M0 | |||
|---|---|---|---|
| Quadrant | BADHDUFLAG | Total packets | Discarded packets |
| A | 0 | 13124 | 1 |
| B | 0 | 12450 | 1 |
| C | 0 | 11363 | 1 |
| D | 0 | 16090 | 1 |
| Quadrant | Total seconds | Saturated seconds | Saturation percentage |
|---|---|---|---|
| A | 5569 | 47 | 0.843958% |
| B | 5570 | 67 | 1.202873% |
| C | 5570 | 4 | 0.071813% |
| D | 5570 | 419 | 7.522442% |
Noise dominated data is calculated using 1-second bins in cleaned event files. If a bin has >2000 counts, and if more than 50% of those come from <1% of pixels, then it is considered to be noise-dominated and hence unusable.
| Quadrant | # 1 sec bins | Bins with >0 counts | Bins with >2000 counts | High rate bins dominated by noise | Noise dominated (total time) | Noise dominated (detector-on time) | Marked lightcurve |
|---|---|---|---|---|---|---|---|
| A | 7122 | 5570 | 39 | 39 | 0.55% | 0.70% | 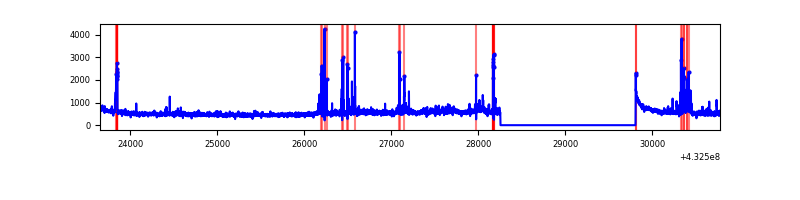 |
| B | 7123 | 5571 | 44 | 44 | 0.62% | 0.79% | 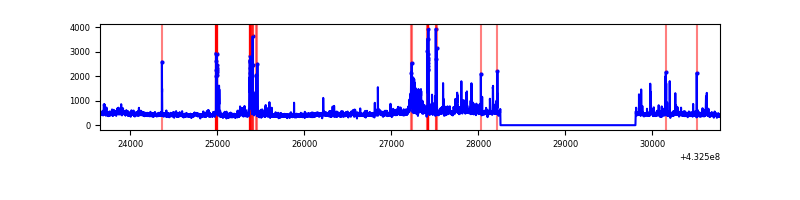 |
| C | 7123 | 5571 | 0 | 0 | 0.00% | 0.00% | 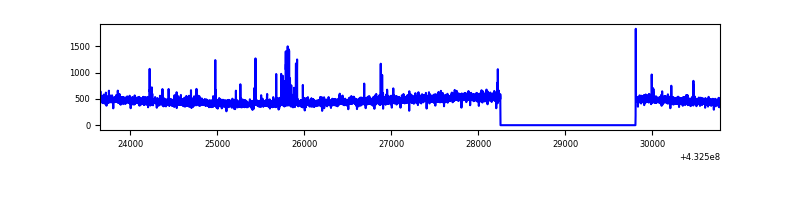 |
| D | 7123 | 5571 | 381 | 381 | 5.35% | 6.84% | 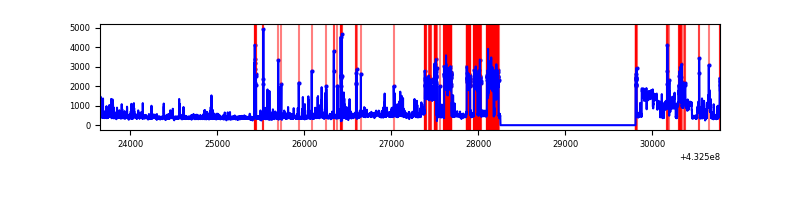 |
Top three noisy pixels from each quadrant. If the there are fewer than three noisy pixels in the level2.evt file, extra rows are filled as -1
| Pixel properties | Quadrant properties | ||||||
|---|---|---|---|---|---|---|---|
| Quadrant | DetID | PixID | Counts | Sigma | Mean | Median | Sigma |
| A | 10 | 83 | 554381 | 4506.81 | 597 | 584 | 122.9 |
| A | 15 | 237 | 155782 | 1263.01 | 597 | 584 | 122.9 |
| A | 13 | 248 | 105312 | 852.28 | 597 | 584 | 122.9 |
| B | 5 | 255 | 319495 | 2756.71 | 595 | 580 | 115.7 |
| B | 0 | 229 | 124924 | 1074.83 | 595 | 580 | 115.7 |
| B | 0 | 189 | 48950 | 418.11 | 595 | 580 | 115.7 |
| C | 15 | 214 | 248120 | 1808.4 | 583 | 584 | 136.9 |
| C | 3 | 233 | 44354 | 319.77 | 583 | 584 | 136.9 |
| C | 12 | 249 | 13947 | 97.62 | 583 | 584 | 136.9 |
| D | 2 | 16 | 1308514 | 9385.17 | 567 | 550 | 139.4 |
| D | 1 | 52 | 230187 | 1647.74 | 567 | 550 | 139.4 |
| D | 13 | 249 | 161416 | 1154.28 | 567 | 550 | 139.4 |
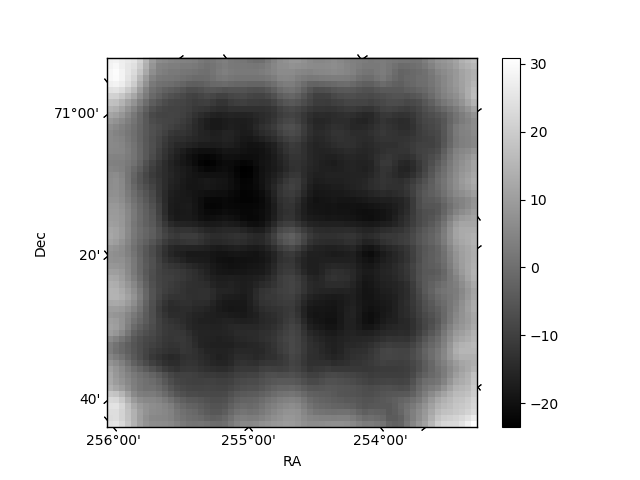
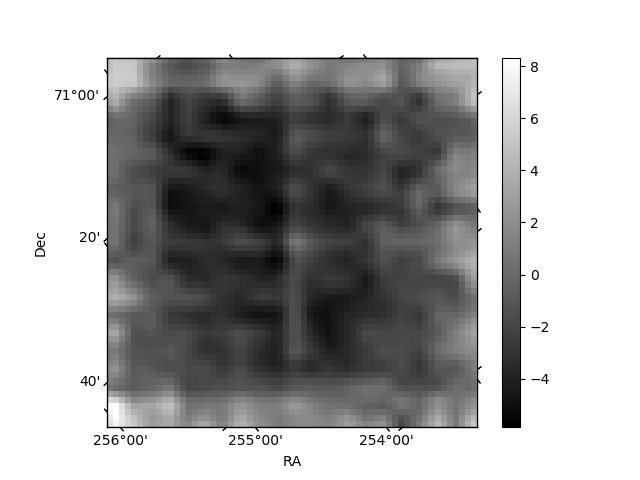
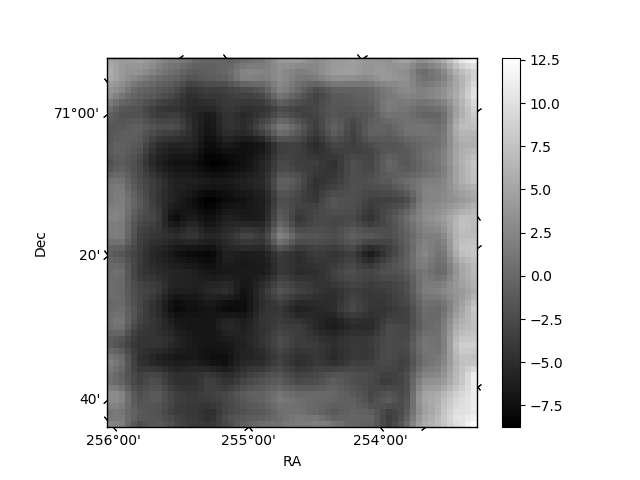
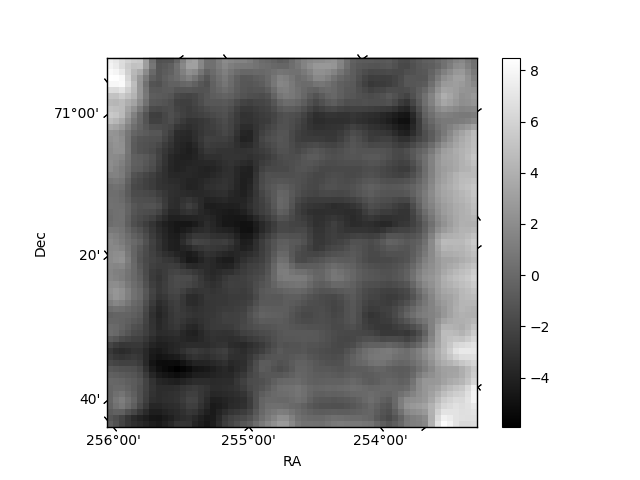
Histogram calculated using DETX and DETY for each event in the final _common_clean file
| Quadrant A | 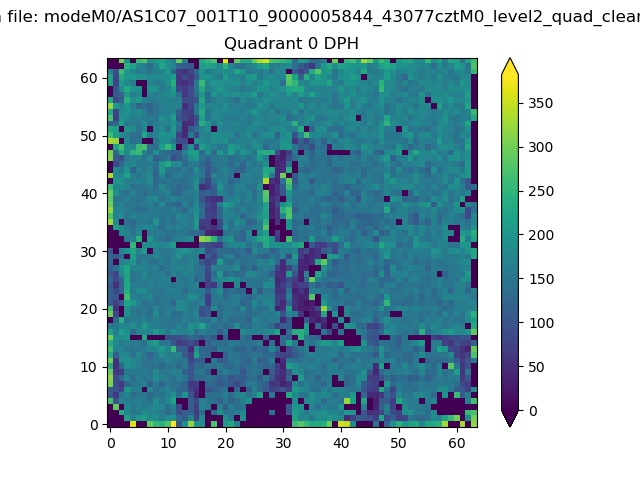 |
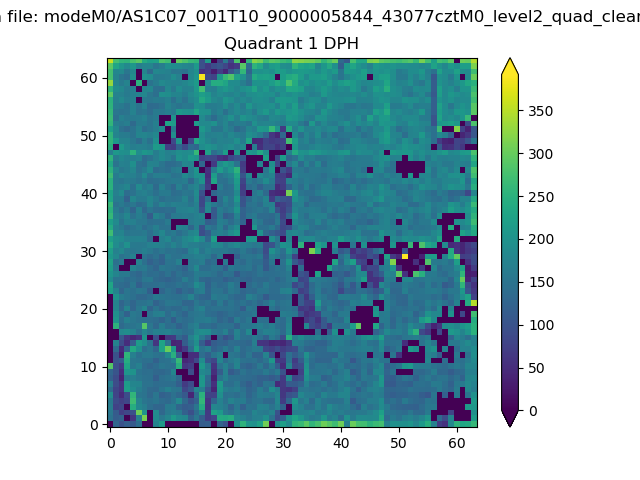 |
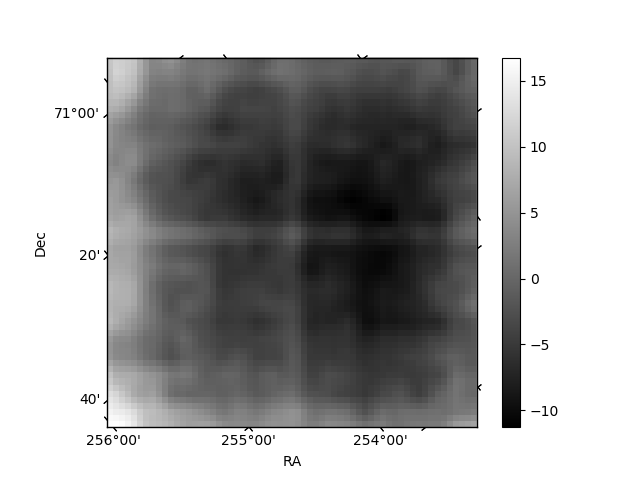
Quadrant B |
|---|---|---|---|
| Quadrant D | 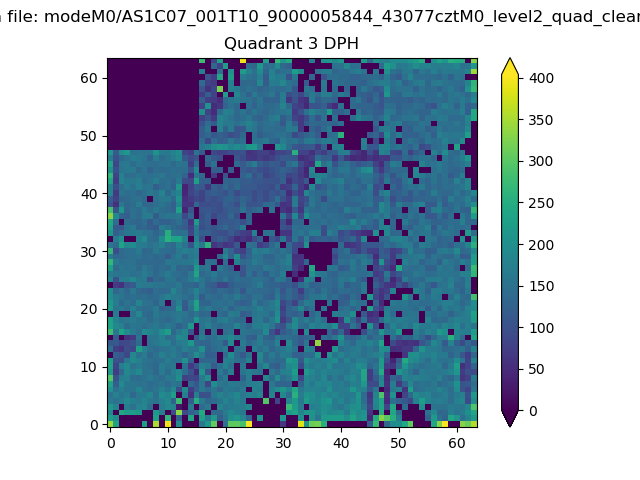 |
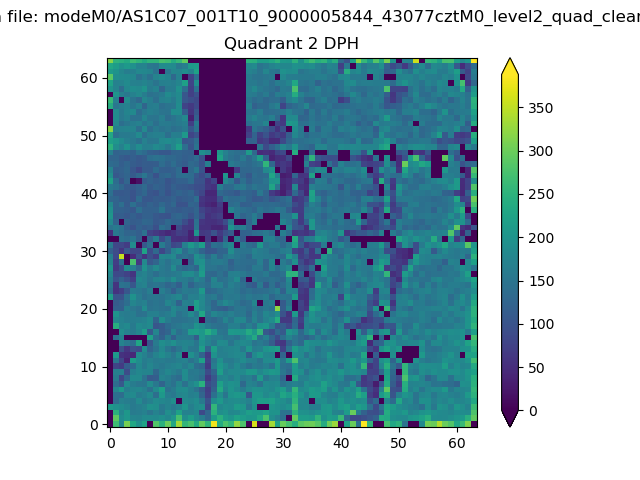 |
Quadrant C |
| Plot type | Count rate plots | Images |
|---|---|---|
| Comparison with Poisson distribution Blue bars denote a histogram of data divided into 1 sec bins. Red curve is a Poisson curve with rate = median count rate of data. |
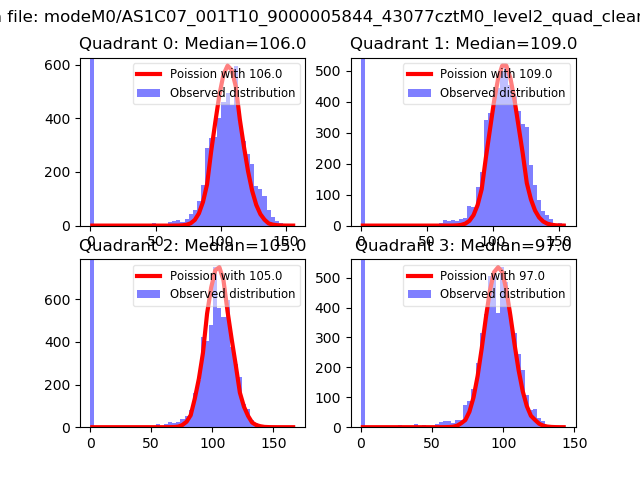 |
 |
| Quadrant-wise count rates Data is divided into 100 sec bins |
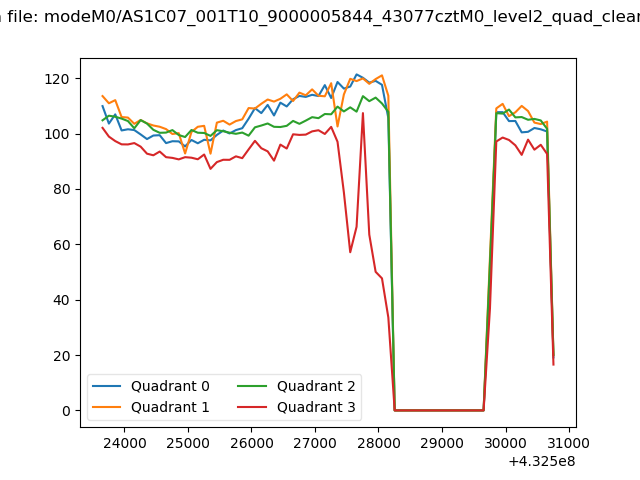 |
|
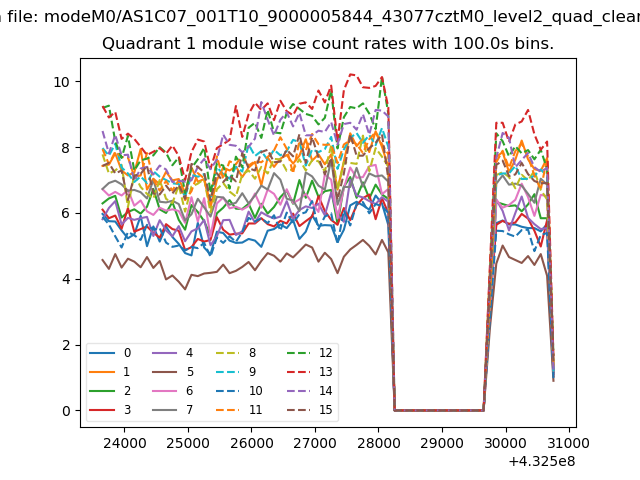
| Module-wise count rates for Quadrant A Data is divided into 100 sec bins |
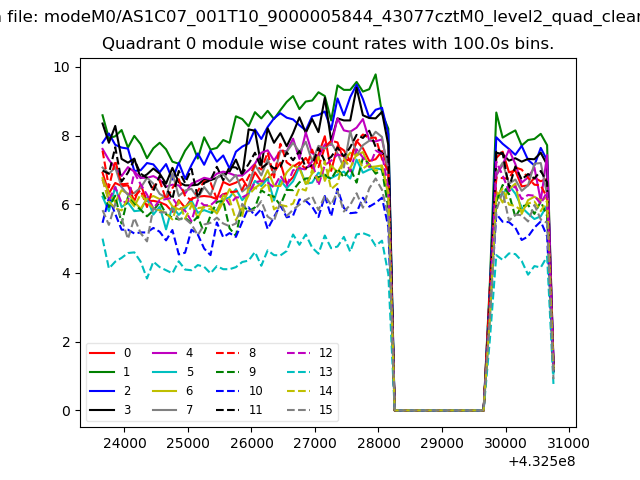 |
 |
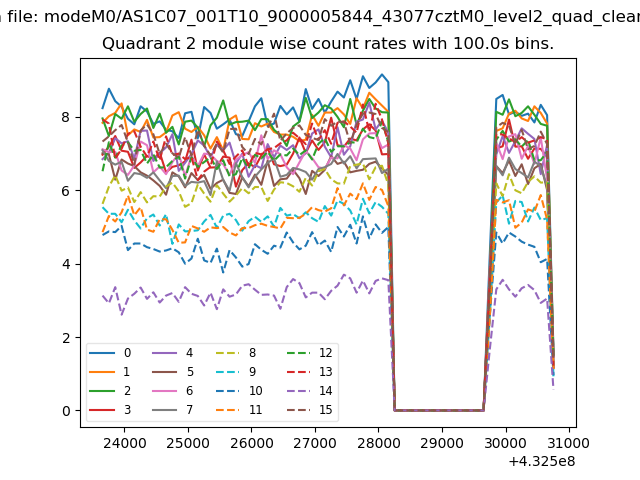
| Module-wise count rates for Quadrant B Data is divided into 100 sec bins |
 |
 |
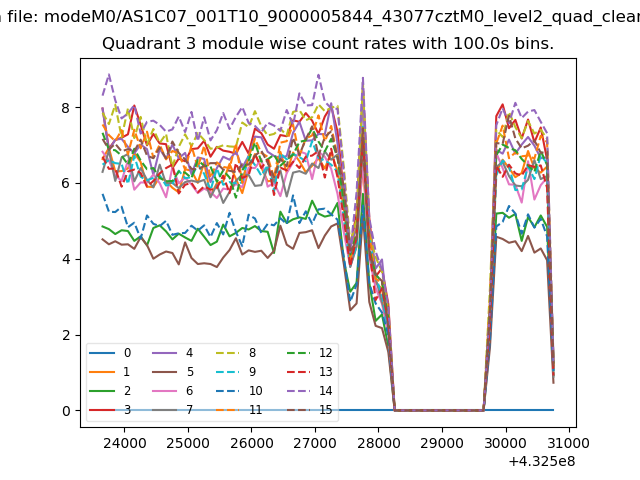
| Module-wise count rates for Quadrant C Data is divided into 100 sec bins |
 |
 |
| Module-wise count rates for Quadrant D Data is divided into 100 sec bins |
 |
 |
| Parameter | Plot |
|---|---|
| CZT HV Monitor | 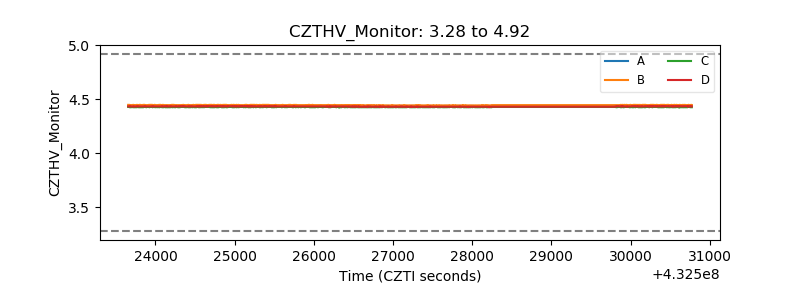 |
| D_VDD | 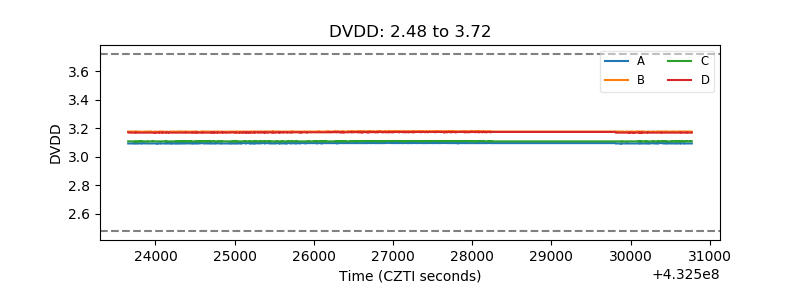 |
| Temperature 1 | 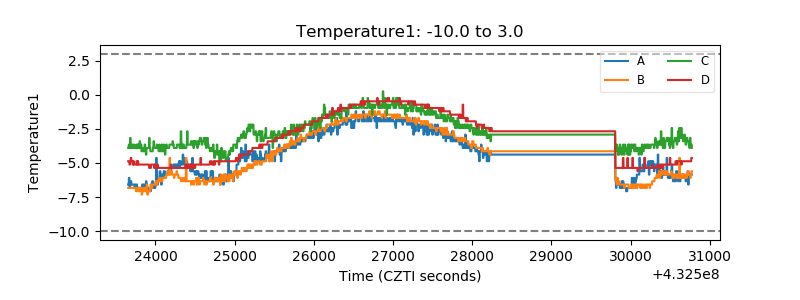 |
| Veto HV Monitor | 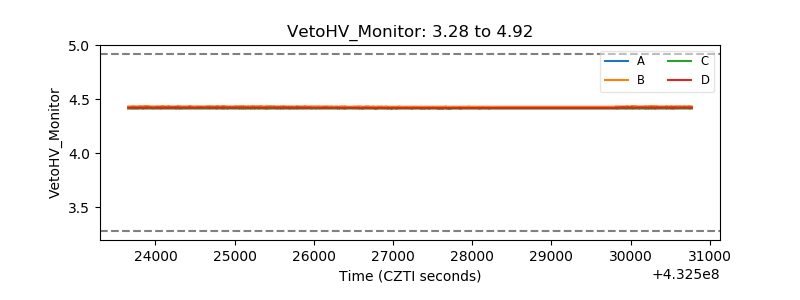 |
| Veto LLD | 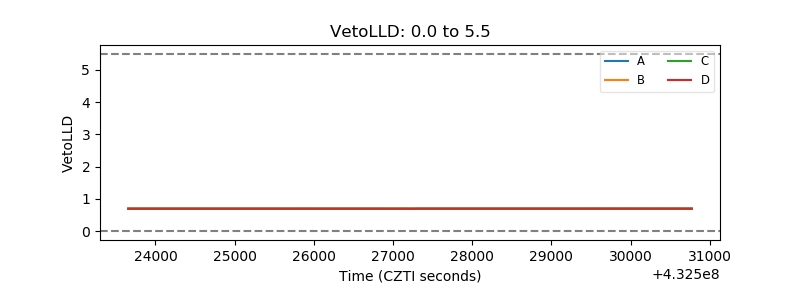 |
| Alpha Counter | 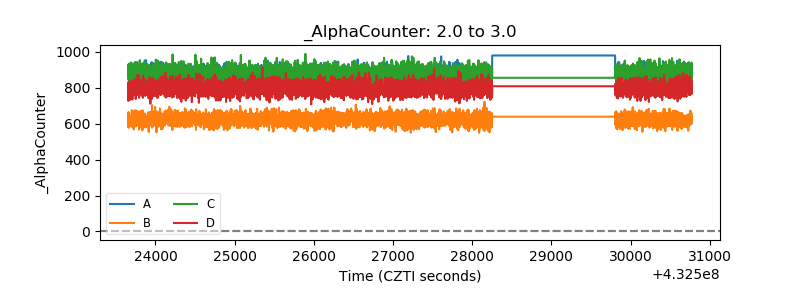 |
| _CPM_Rate | 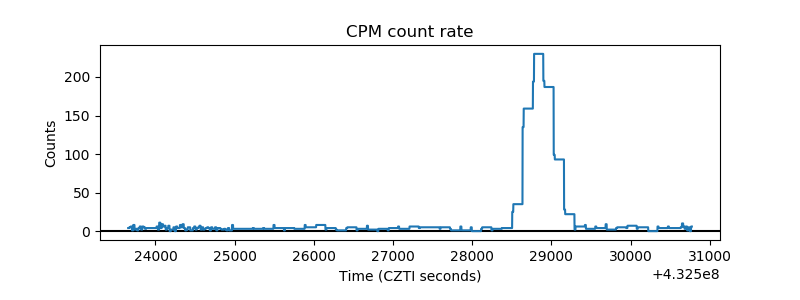 |
| CZT Counter | 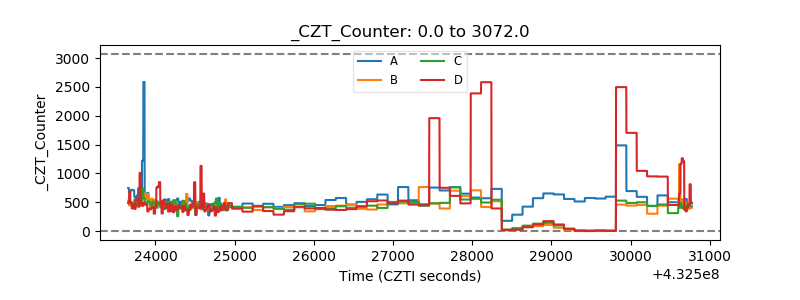 |
| +2.5 Volts monitor | 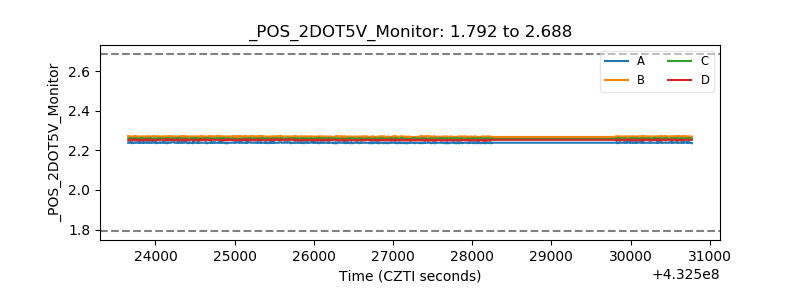 |
| +5 Volts monitor | 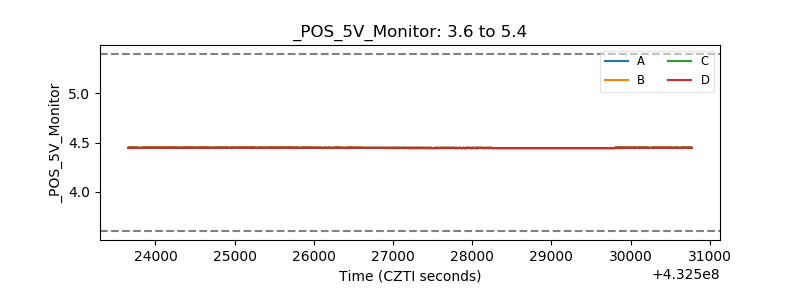 |
| _ROLL_ROT | 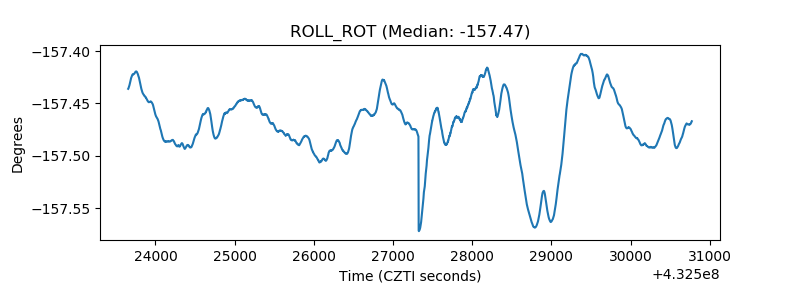 |
| _Roll_DEC | 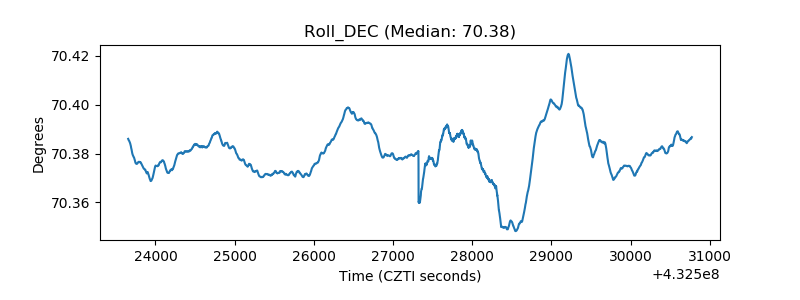 |
| _Roll_RA | 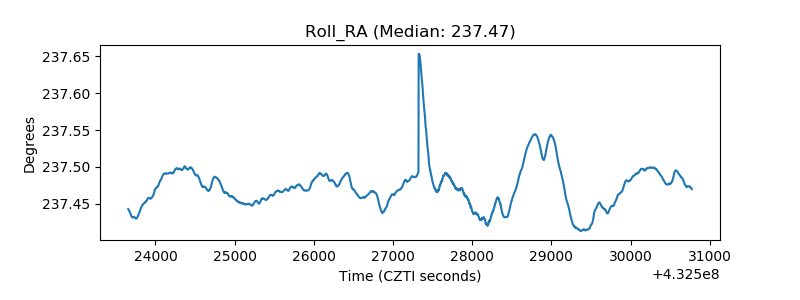 |
| Veto Counter | 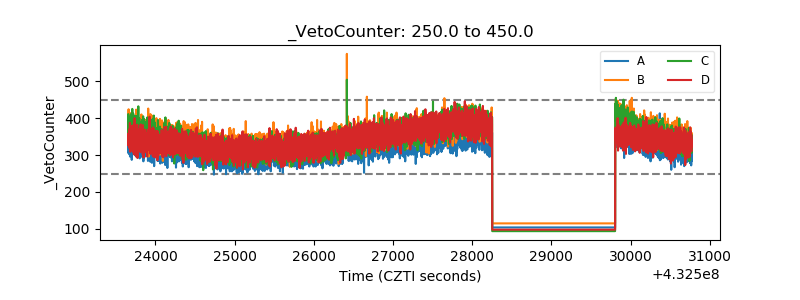 |