| Param | Original file | Final file |
|---|---|---|
| Filename | modeM0/AS1C07_001T10_9000005844_43078cztM0_level2.fits | modeM0/AS1C07_001T10_9000005844_43078cztM0_level2_quad_clean.evt |
| Size (bytes) | 348,171,840 | 89,596,800 |
| Size | 332.0 MB | 85.4 MB |
| Events in quadrant A | 3,361,862 | 592,299 |
| Events in quadrant B | 2,797,957 | 612,143 |
| Events in quadrant C | 2,532,257 | 582,218 |
| Events in quadrant D | 3,765,919 | 539,494 |
| Mode SS | |||
|---|---|---|---|
| Quadrant | BADHDUFLAG | Total packets | Discarded packets |
| A | 0 | 112 | 0 |
| B | 0 | 112 | 0 |
| C | 0 | 112 | 0 |
| D | 0 | 112 | 0 |
| Mode M9 | |||
|---|---|---|---|
| Quadrant | BADHDUFLAG | Total packets | Discarded packets |
| A | 0 | 20 | 0 |
| B | 0 | 21 | 0 |
| C | 0 | 21 | 0 |
| D | 0 | 21 | 0 |
| Mode M0 | |||
|---|---|---|---|
| Quadrant | BADHDUFLAG | Total packets | Discarded packets |
| A | 0 | 13319 | 2 |
| B | 0 | 12089 | 2 |
| C | 0 | 11135 | 2 |
| D | 0 | 15156 | 2 |
| Quadrant | Total seconds | Saturated seconds | Saturation percentage |
|---|---|---|---|
| A | 5529 | 100 | 1.808645% |
| B | 5529 | 39 | 0.705372% |
| C | 5528 | 4 | 0.072359% |
| D | 5528 | 78 | 1.410999% |
Noise dominated data is calculated using 1-second bins in cleaned event files. If a bin has >2000 counts, and if more than 50% of those come from <1% of pixels, then it is considered to be noise-dominated and hence unusable.
| Quadrant | # 1 sec bins | Bins with >0 counts | Bins with >2000 counts | High rate bins dominated by noise | Noise dominated (total time) | Noise dominated (detector-on time) | Marked lightcurve |
|---|---|---|---|---|---|---|---|
| A | 7170 | 5530 | 69 | 69 | 0.96% | 1.25% | 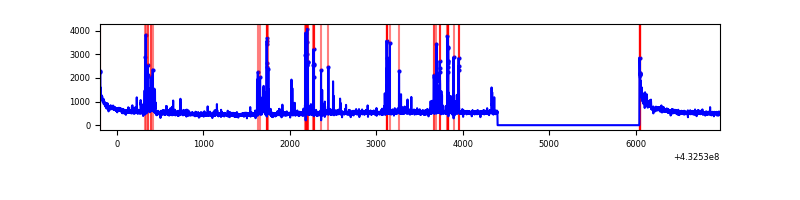 |
| B | 7170 | 5530 | 18 | 18 | 0.25% | 0.33% | 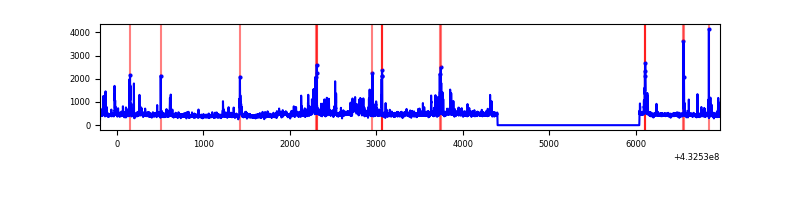 |
| C | 7169 | 5529 | 0 | 0 | 0.00% | 0.00% | 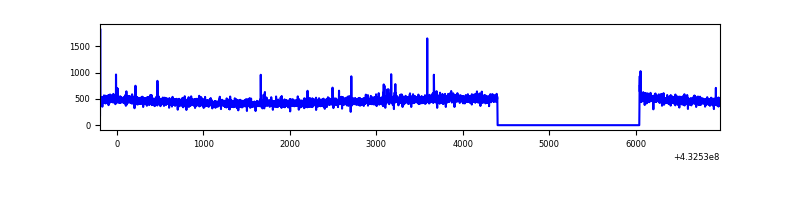 |
| D | 7169 | 5529 | 81 | 81 | 1.13% | 1.47% | 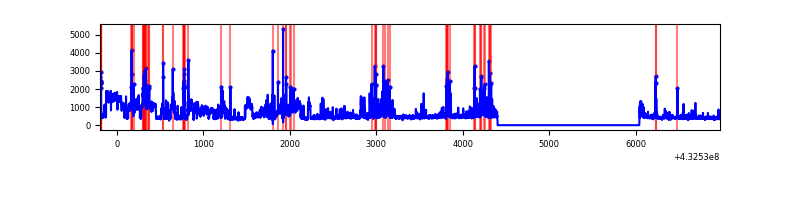 |
Top three noisy pixels from each quadrant. If the there are fewer than three noisy pixels in the level2.evt file, extra rows are filled as -1
| Pixel properties | Quadrant properties | ||||||
|---|---|---|---|---|---|---|---|
| Quadrant | DetID | PixID | Counts | Sigma | Mean | Median | Sigma |
| A | 10 | 83 | 600100 | 4869.01 | 595 | 580 | 123.1 |
| A | 15 | 237 | 313974 | 2545.24 | 595 | 580 | 123.1 |
| A | 13 | 248 | 94956 | 766.48 | 595 | 580 | 123.1 |
| B | 0 | 229 | 186827 | 1622.56 | 592 | 577 | 114.8 |
| B | 5 | 255 | 151309 | 1313.14 | 592 | 577 | 114.8 |
| B | 0 | 186 | 73525 | 635.5 | 592 | 577 | 114.8 |
| C | 15 | 214 | 250086 | 1838.01 | 577 | 580 | 135.7 |
| C | 12 | 2 | 10002 | 69.41 | 577 | 580 | 135.7 |
| C | 12 | 249 | 5520 | 36.39 | 577 | 580 | 135.7 |
| D | 2 | 16 | 916427 | 6482.76 | 578 | 560 | 141.3 |
| D | 1 | 52 | 399286 | 2822.29 | 578 | 560 | 141.3 |
| D | 13 | 249 | 61513 | 431.44 | 578 | 560 | 141.3 |
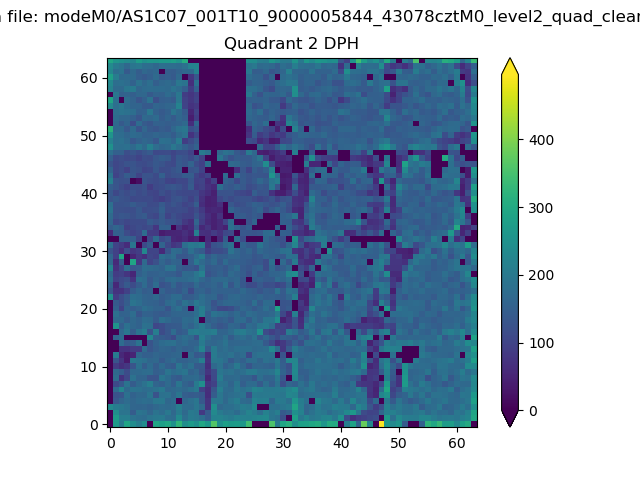
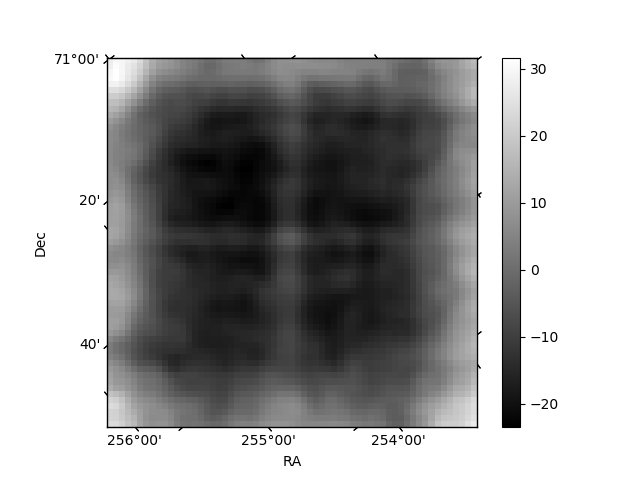
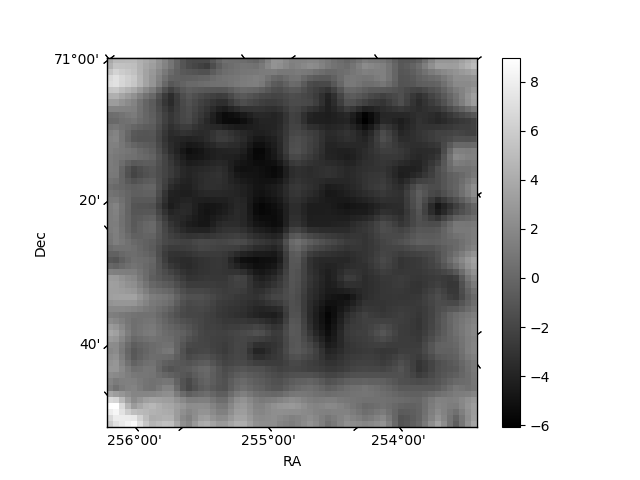
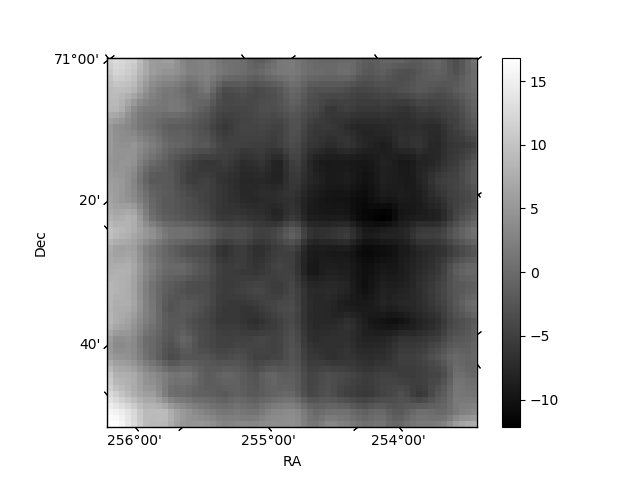
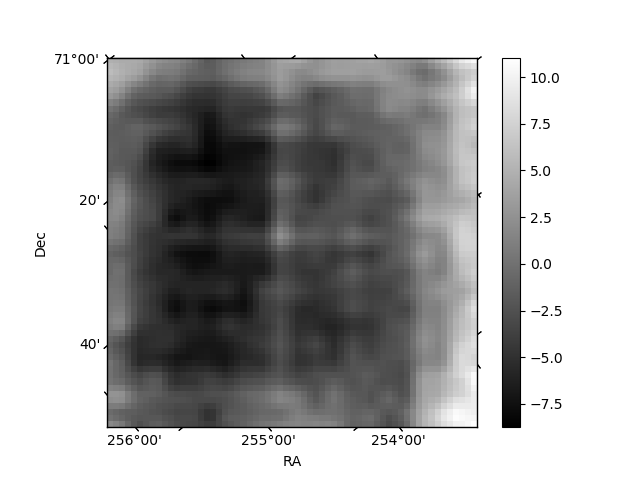
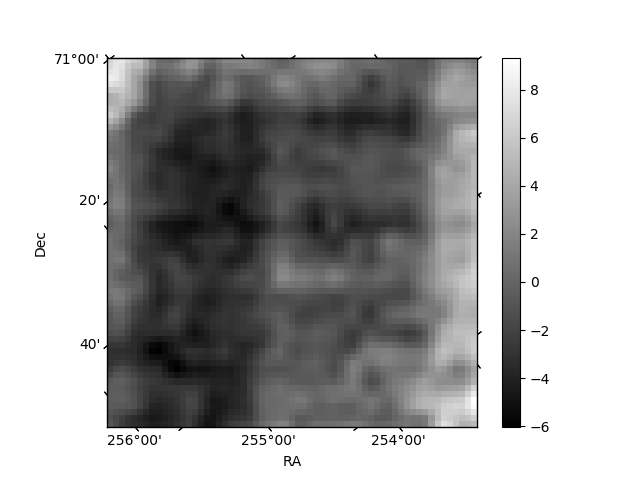
Histogram calculated using DETX and DETY for each event in the final _common_clean file
| Quadrant A | 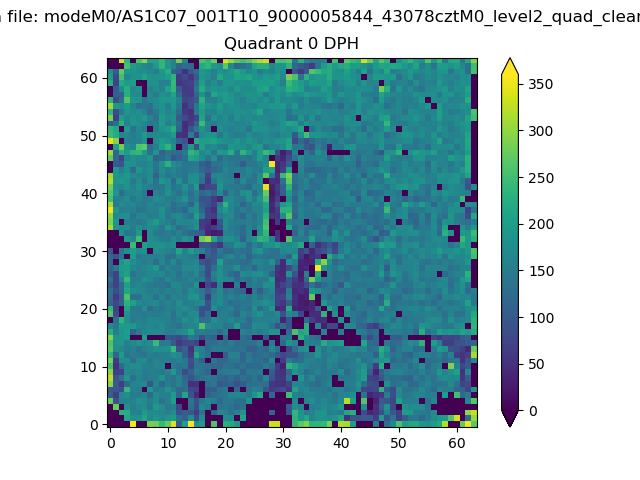 |
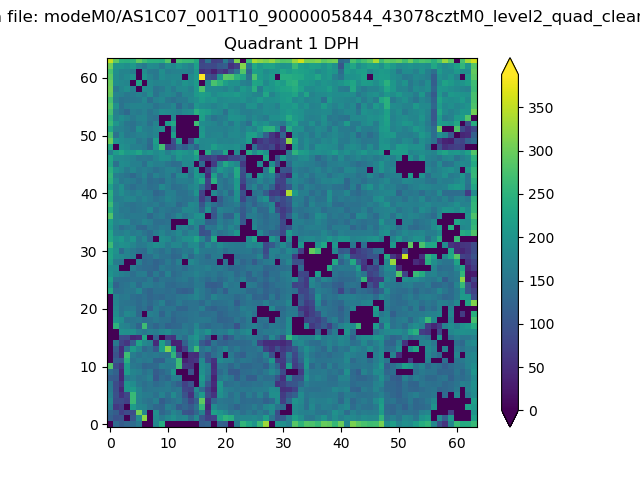 |
Quadrant B |
|---|---|---|---|
| Quadrant D | 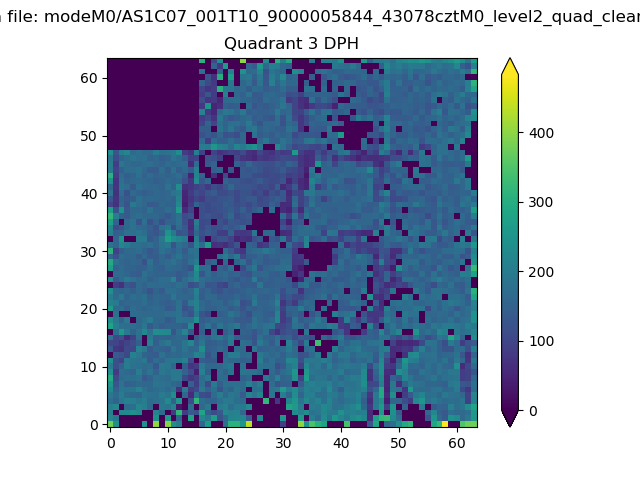 |
 |
Quadrant C |
| Plot type | Count rate plots | Images |
|---|---|---|
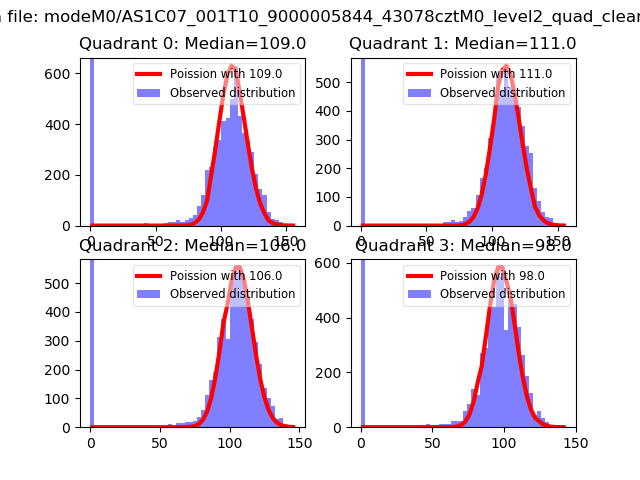
| Comparison with Poisson distribution Blue bars denote a histogram of data divided into 1 sec bins. Red curve is a Poisson curve with rate = median count rate of data. |
 |
 |
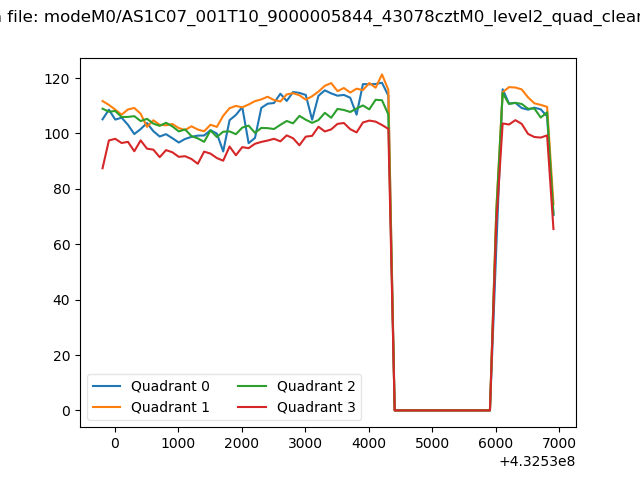
| Quadrant-wise count rates Data is divided into 100 sec bins |
 |
|
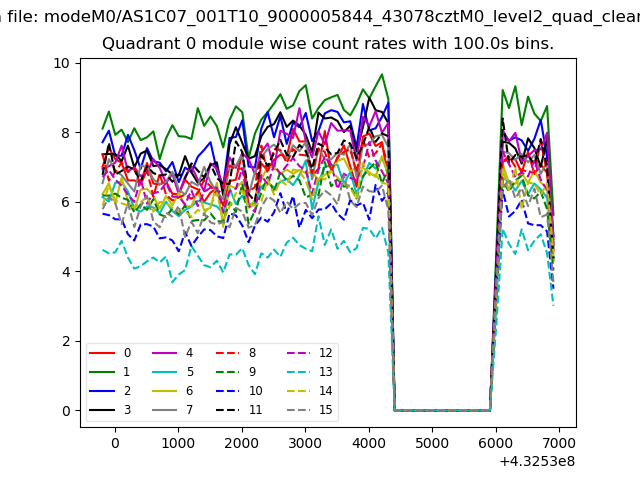
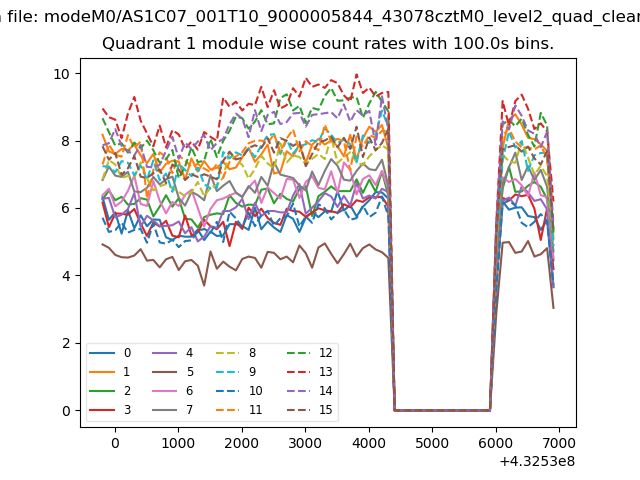
| Module-wise count rates for Quadrant A Data is divided into 100 sec bins |
 |
 |
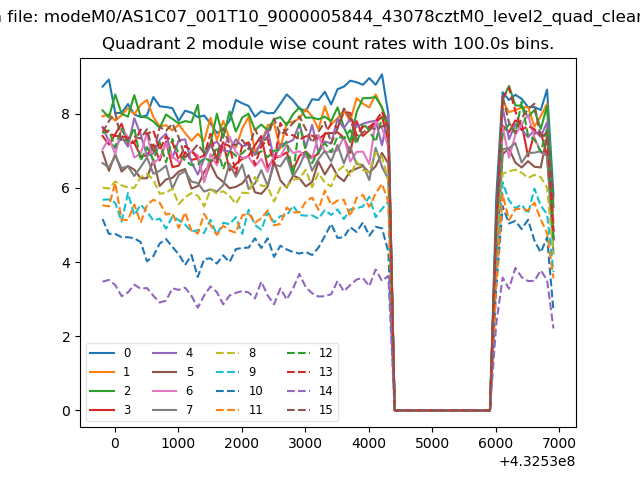
| Module-wise count rates for Quadrant B Data is divided into 100 sec bins |
 |
 |
| Module-wise count rates for Quadrant C Data is divided into 100 sec bins |
 |
 |
| Module-wise count rates for Quadrant D Data is divided into 100 sec bins |
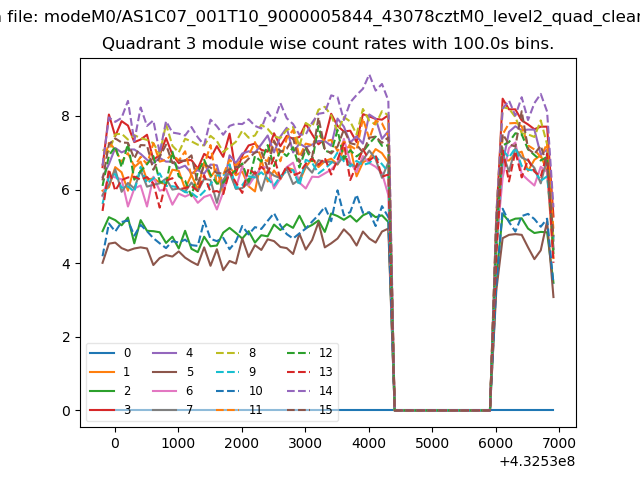 |
 |
| Parameter | Plot |
|---|---|
| CZT HV Monitor | 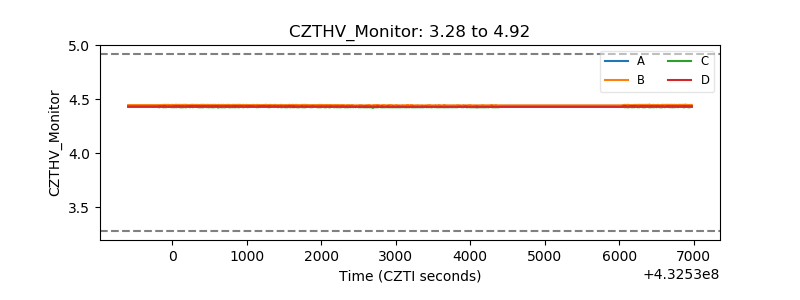 |
| D_VDD | 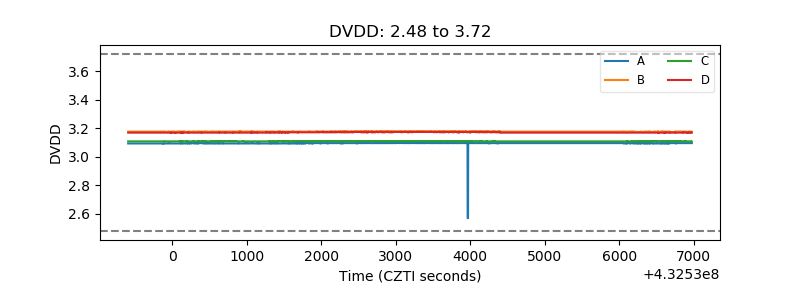 |
| Temperature 1 | 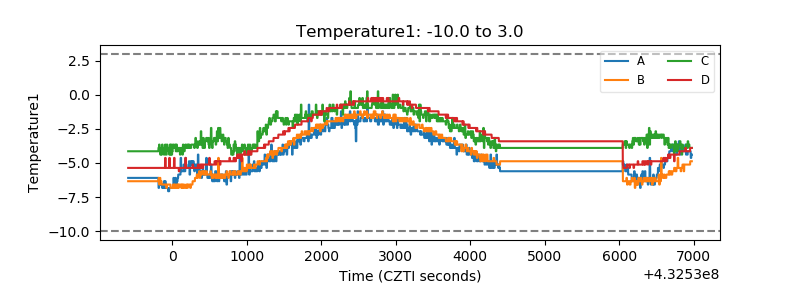 |
| Veto HV Monitor | 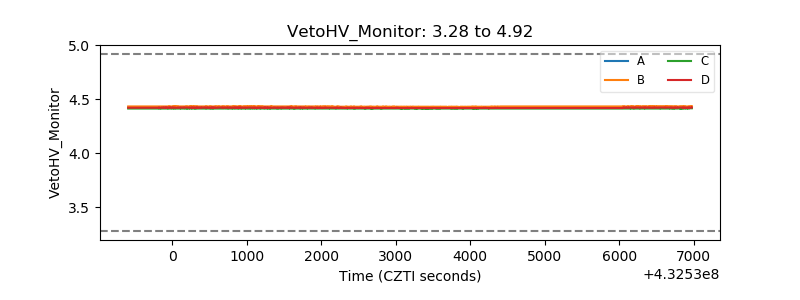 |
| Veto LLD | 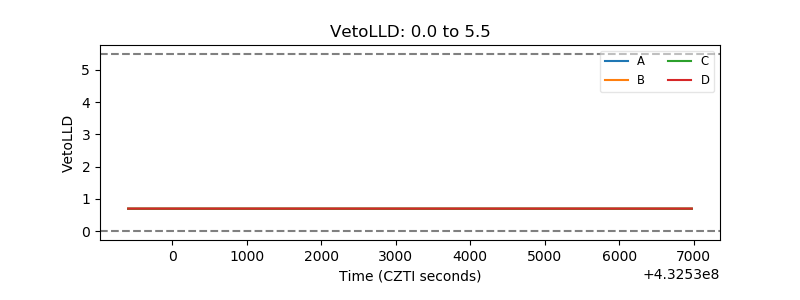 |
| Alpha Counter | 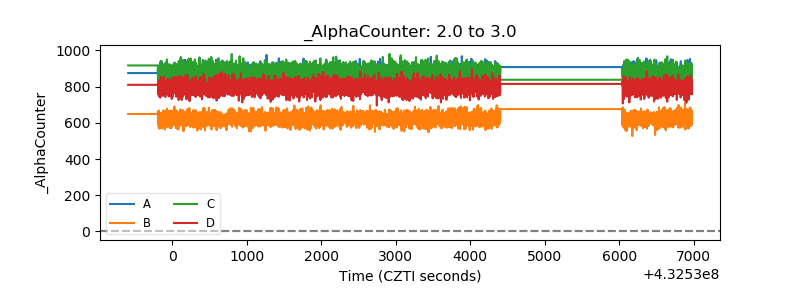 |
| _CPM_Rate | 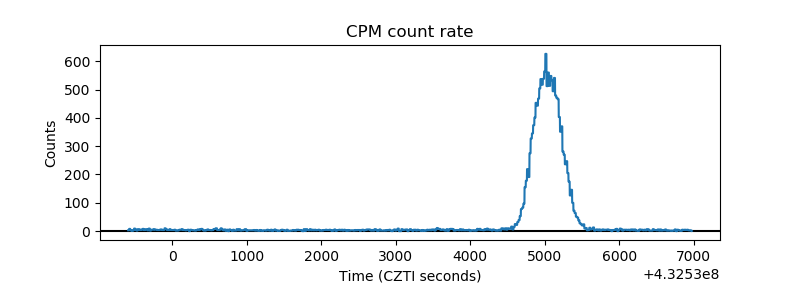 |
| CZT Counter | 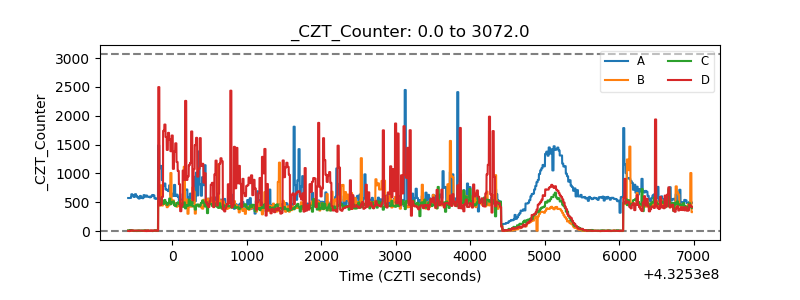 |
| +2.5 Volts monitor | 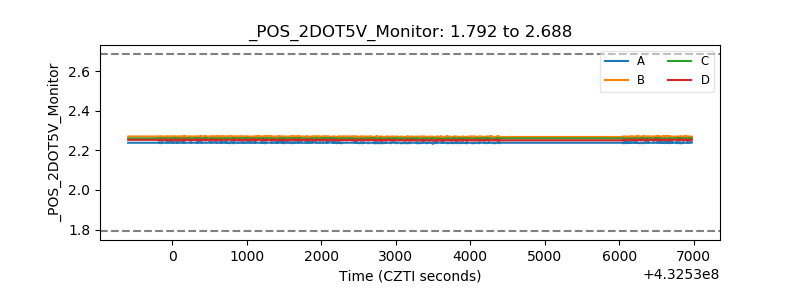 |
| +5 Volts monitor | 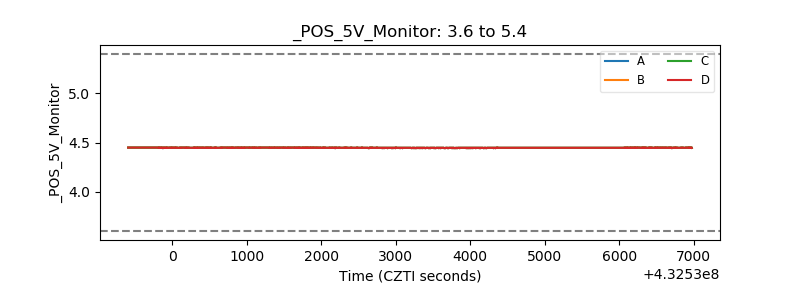 |
| _ROLL_ROT | 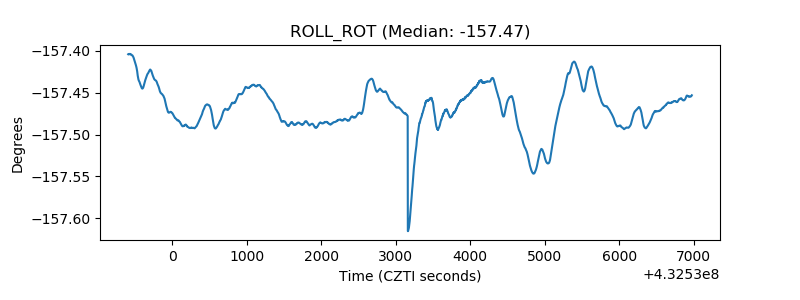 |
| _Roll_DEC | 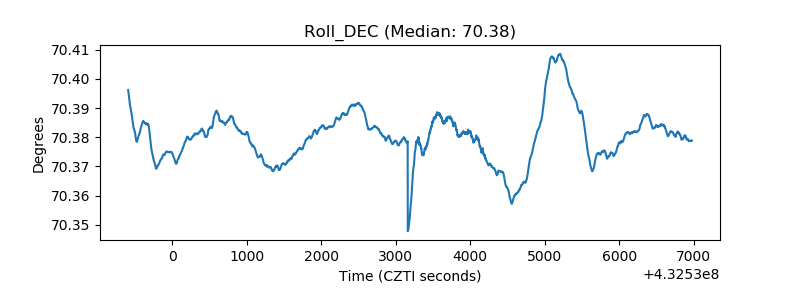 |
| _Roll_RA | 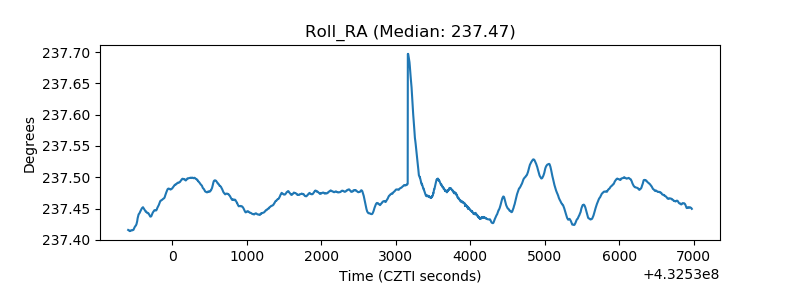 |
| Veto Counter | 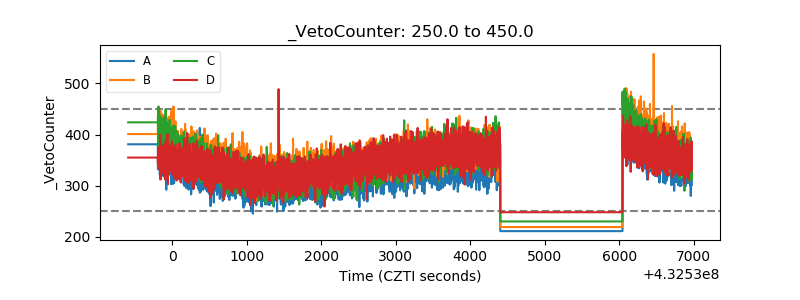 |