| Param | Original file | Final file |
|---|---|---|
| Filename | modeM0/AS1C07_001T10_9000005844_43080cztM0_level2.fits | modeM0/AS1C07_001T10_9000005844_43080cztM0_level2_quad_clean.evt |
| Size (bytes) | 324,504,000 | 87,030,720 |
| Size | 309.5 MB | 83.0 MB |
| Events in quadrant A | 3,999,119 | 566,667 |
| Events in quadrant B | 2,643,525 | 601,975 |
| Events in quadrant C | 2,450,919 | 566,918 |
| Events in quadrant D | 2,509,173 | 531,742 |
| Mode SS | |||
|---|---|---|---|
| Quadrant | BADHDUFLAG | Total packets | Discarded packets |
| A | 0 | 108 | 0 |
| B | 0 | 108 | 0 |
| C | 0 | 108 | 0 |
| D | 0 | 108 | 0 |
| Mode M9 | |||
|---|---|---|---|
| Quadrant | BADHDUFLAG | Total packets | Discarded packets |
| A | 0 | 18 | 0 |
| B | 0 | 18 | 0 |
| C | 0 | 18 | 0 |
| D | 0 | 18 | 0 |
| Mode M0 | |||
|---|---|---|---|
| Quadrant | BADHDUFLAG | Total packets | Discarded packets |
| A | 0 | 15077 | 2 |
| B | 0 | 11394 | 2 |
| C | 0 | 10692 | 2 |
| D | 0 | 11241 | 2 |
| Quadrant | Total seconds | Saturated seconds | Saturation percentage |
|---|---|---|---|
| A | 5249 | 321 | 6.115451% |
| B | 5250 | 56 | 1.066667% |
| C | 5250 | 8 | 0.152381% |
| D | 5250 | 20 | 0.380952% |
Noise dominated data is calculated using 1-second bins in cleaned event files. If a bin has >2000 counts, and if more than 50% of those come from <1% of pixels, then it is considered to be noise-dominated and hence unusable.
| Quadrant | # 1 sec bins | Bins with >0 counts | Bins with >2000 counts | High rate bins dominated by noise | Noise dominated (total time) | Noise dominated (detector-on time) | Marked lightcurve |
|---|---|---|---|---|---|---|---|
| A | 7042 | 5250 | 242 | 242 | 3.44% | 4.61% | 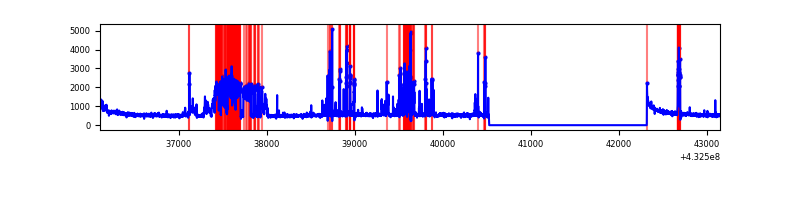 |
| B | 7043 | 5251 | 34 | 34 | 0.48% | 0.65% | 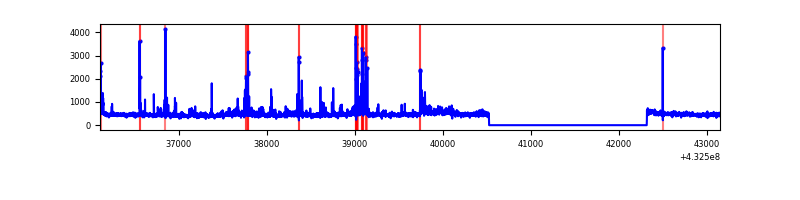 |
| C | 7043 | 5251 | 6 | 6 | 0.09% | 0.11% | 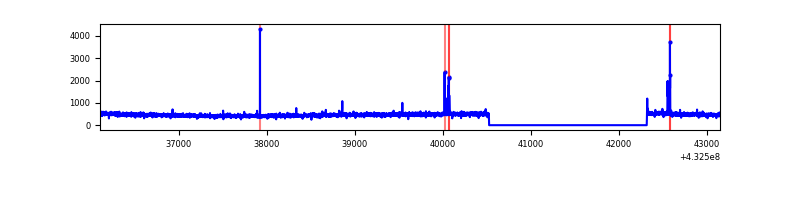 |
| D | 7043 | 5251 | 18 | 18 | 0.26% | 0.34% | 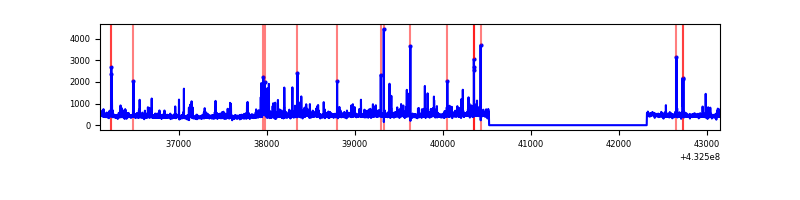 |
Top three noisy pixels from each quadrant. If the there are fewer than three noisy pixels in the level2.evt file, extra rows are filled as -1
| Pixel properties | Quadrant properties | ||||||
|---|---|---|---|---|---|---|---|
| Quadrant | DetID | PixID | Counts | Sigma | Mean | Median | Sigma |
| A | 15 | 237 | 1206385 | 10277.73 | 566 | 553 | 117.3 |
| A | 10 | 83 | 561261 | 4779.11 | 566 | 553 | 117.3 |
| A | 12 | 189 | 28296 | 236.46 | 566 | 553 | 117.3 |
| B | 5 | 255 | 216878 | 1966.76 | 570 | 555 | 110.0 |
| B | 0 | 229 | 147306 | 1334.23 | 570 | 555 | 110.0 |
| B | 0 | 189 | 15481 | 135.7 | 570 | 555 | 110.0 |
| C | 15 | 214 | 238064 | 1836.1 | 553 | 556 | 129.4 |
| C | 14 | 254 | 43138 | 329.19 | 553 | 556 | 129.4 |
| C | 1 | 241 | 5312 | 36.77 | 553 | 556 | 129.4 |
| D | 1 | 52 | 187742 | 1372.72 | 559 | 543 | 136.4 |
| D | 13 | 249 | 53043 | 384.98 | 559 | 543 | 136.4 |
| D | 12 | 233 | 52371 | 380.05 | 559 | 543 | 136.4 |
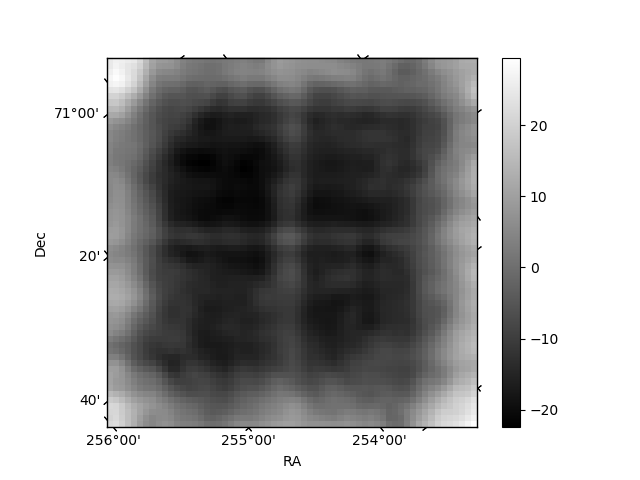
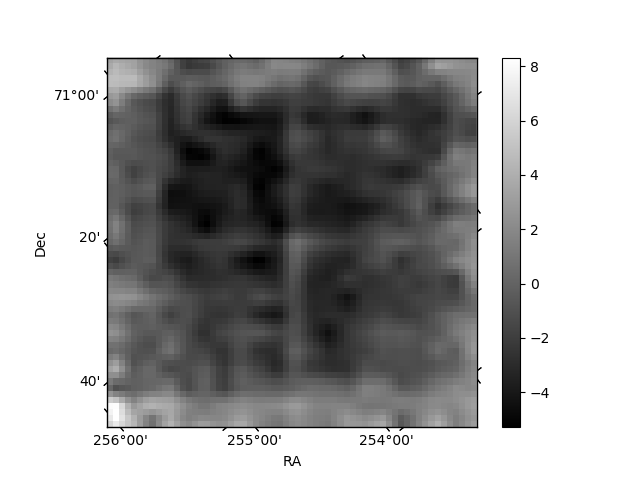
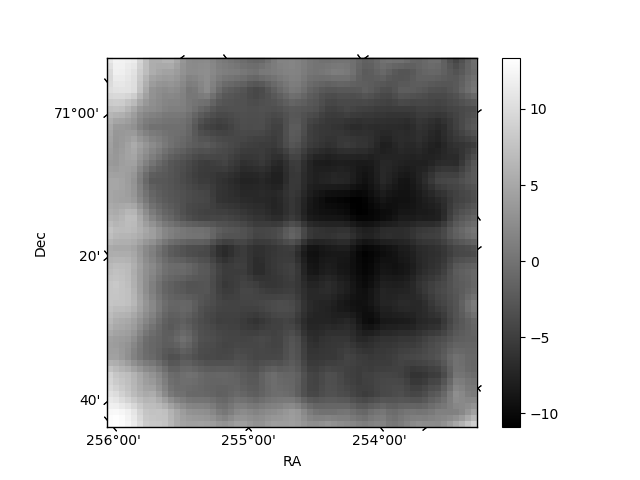
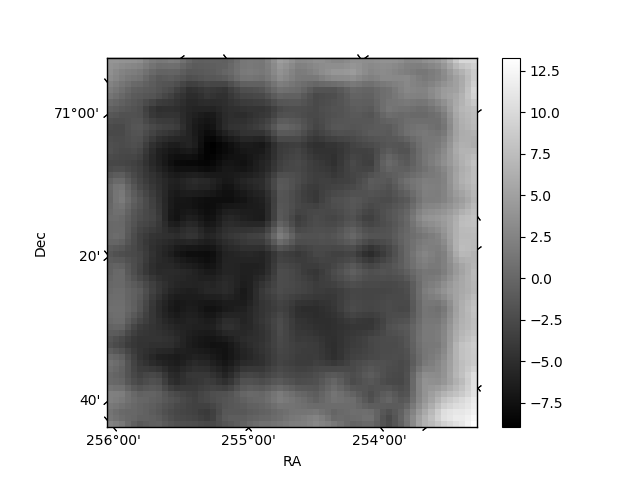
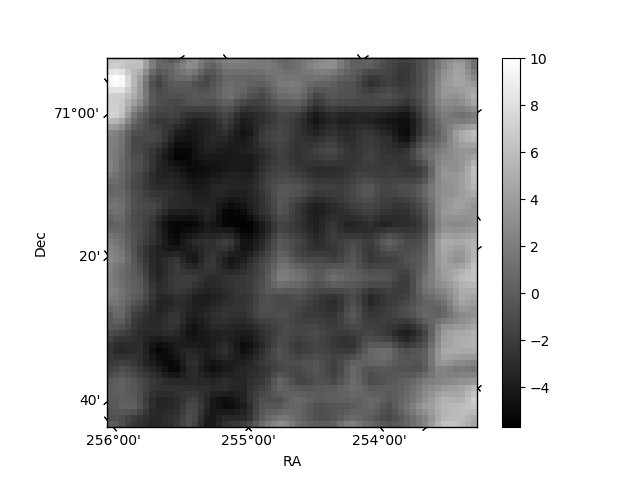
Histogram calculated using DETX and DETY for each event in the final _common_clean file
| Quadrant A | 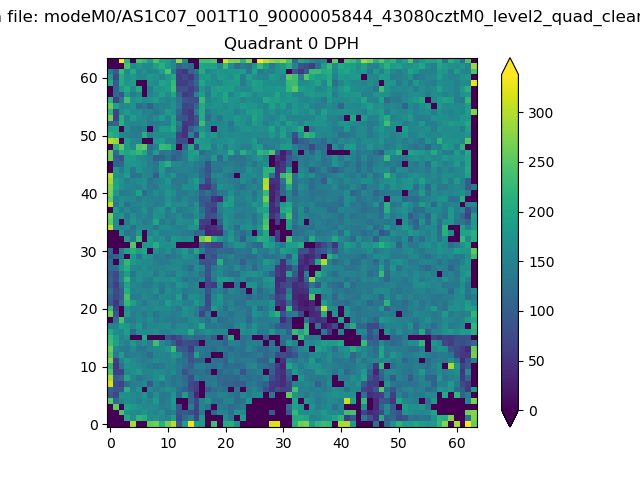 |
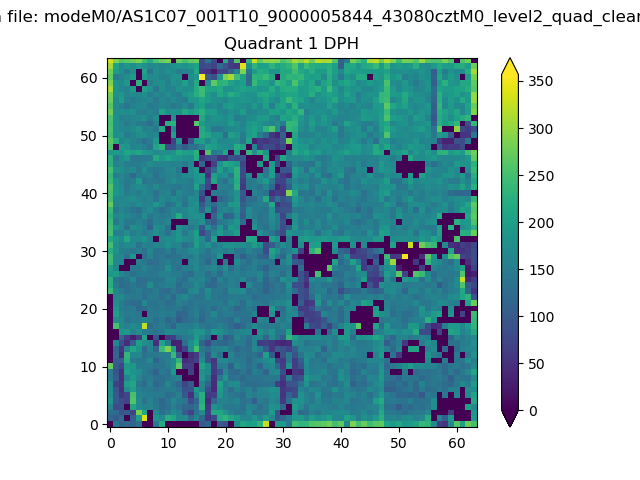 |
Quadrant B |
|---|---|---|---|
| Quadrant D | 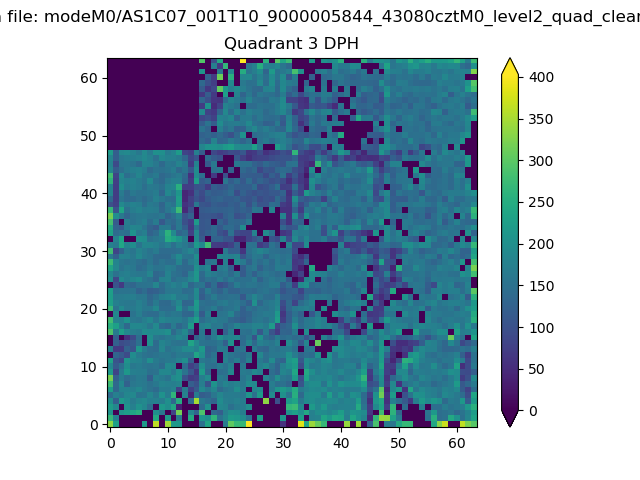 |
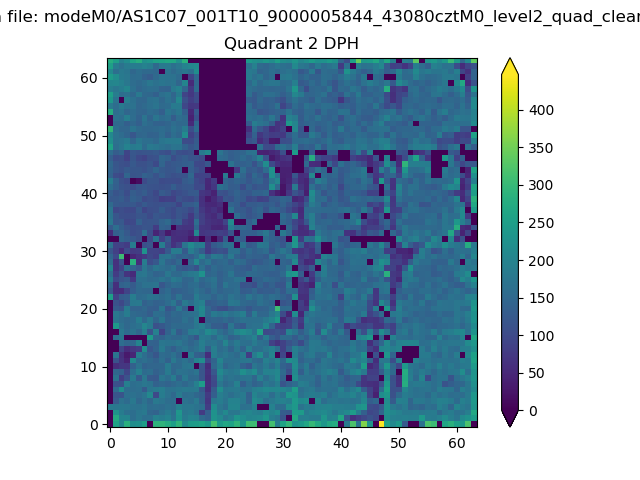 |
Quadrant C |
| Plot type | Count rate plots | Images |
|---|---|---|
| Comparison with Poisson distribution Blue bars denote a histogram of data divided into 1 sec bins. Red curve is a Poisson curve with rate = median count rate of data. |
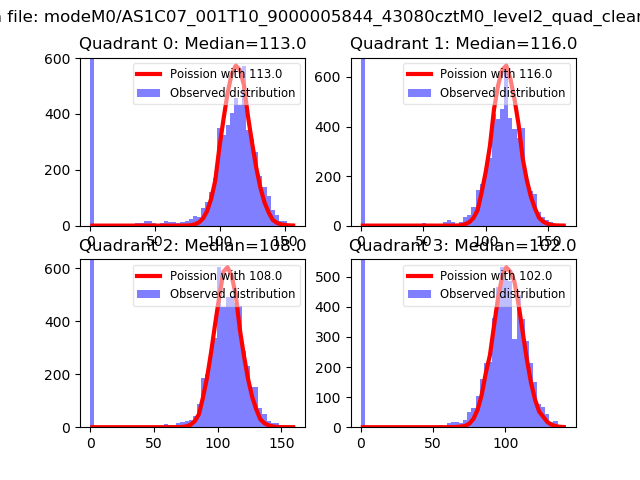 |
 |
| Quadrant-wise count rates Data is divided into 100 sec bins |
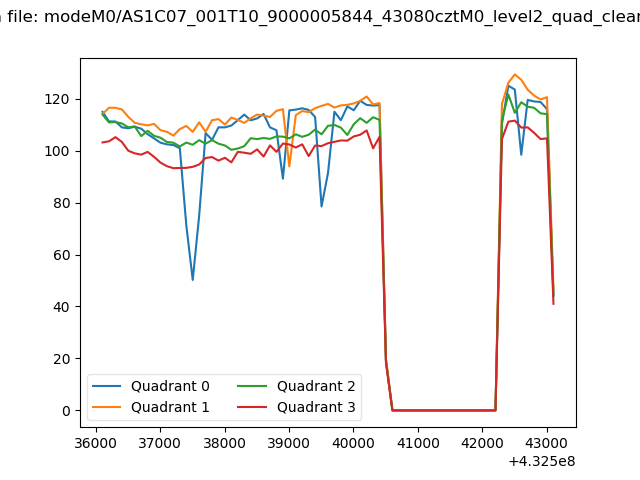 |
|
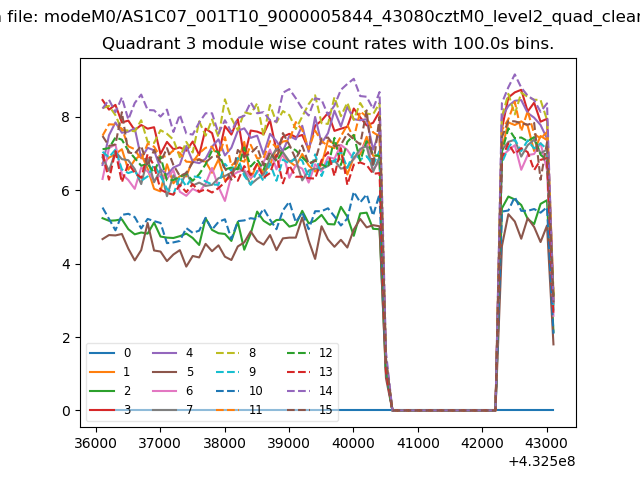
| Module-wise count rates for Quadrant A Data is divided into 100 sec bins |
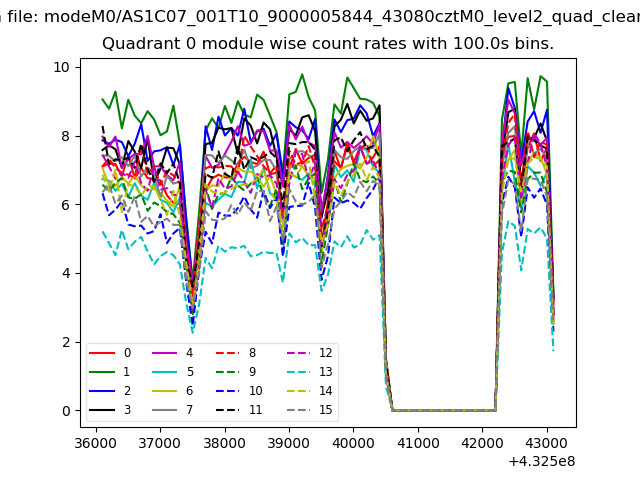 |
 |
| Module-wise count rates for Quadrant B Data is divided into 100 sec bins |
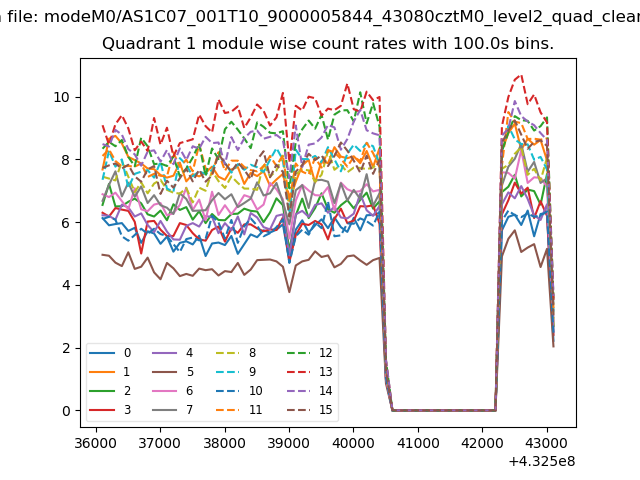 |
 |
| Module-wise count rates for Quadrant C Data is divided into 100 sec bins |
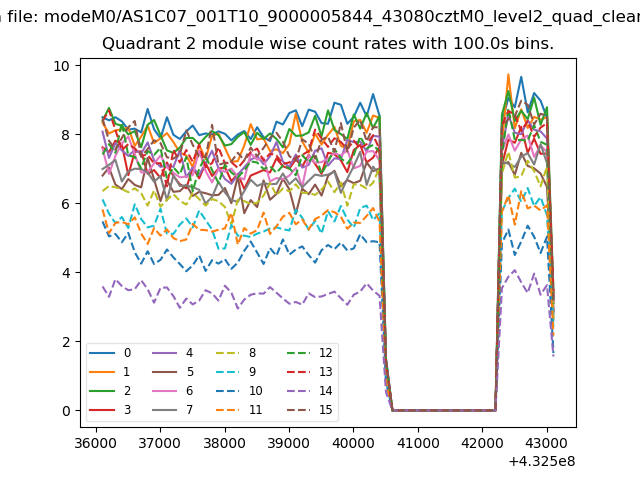 |
 |
| Module-wise count rates for Quadrant D Data is divided into 100 sec bins |
 |
 |
| Parameter | Plot |
|---|---|
| CZT HV Monitor | 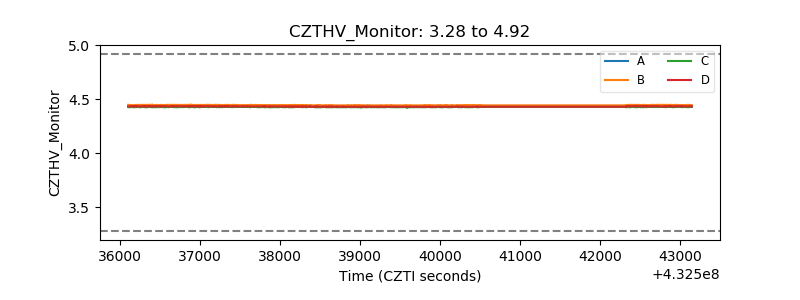 |
| D_VDD | 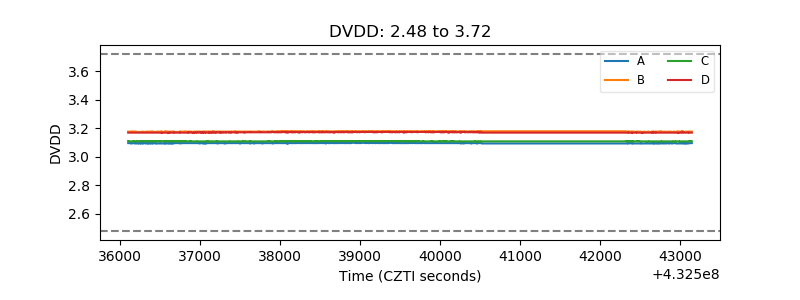 |
| Temperature 1 | 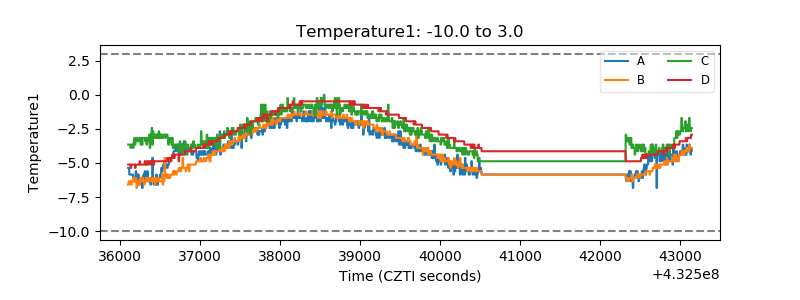 |
| Veto HV Monitor | 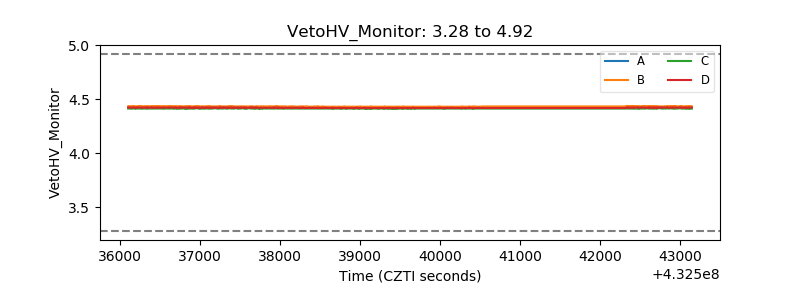 |
| Veto LLD | 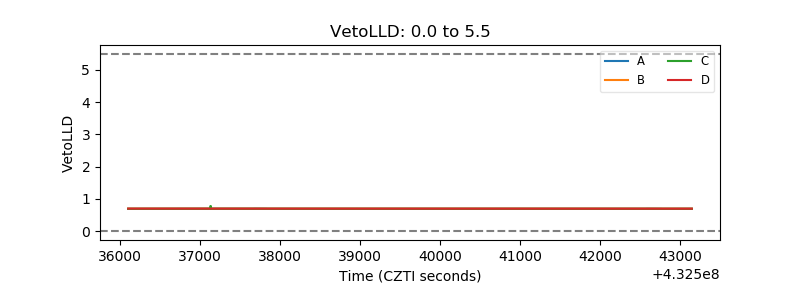 |
| Alpha Counter | 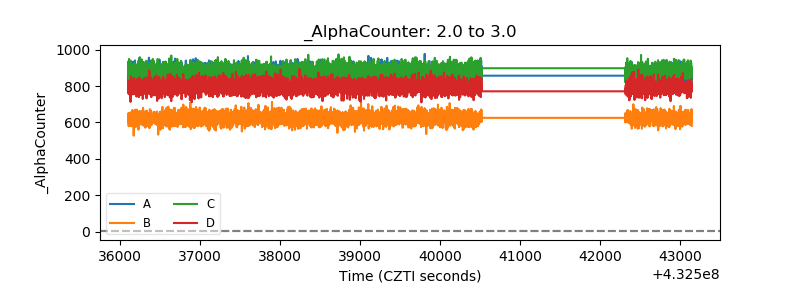 |
| _CPM_Rate | 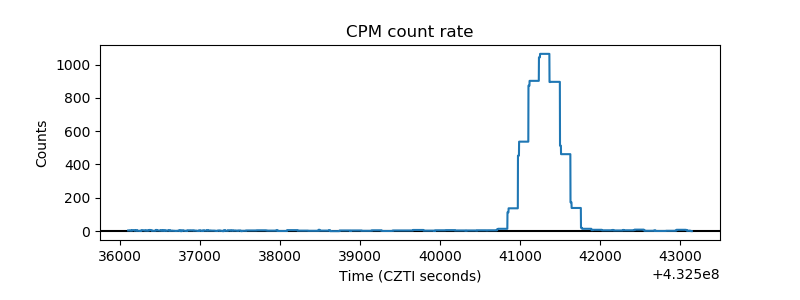 |
| CZT Counter | 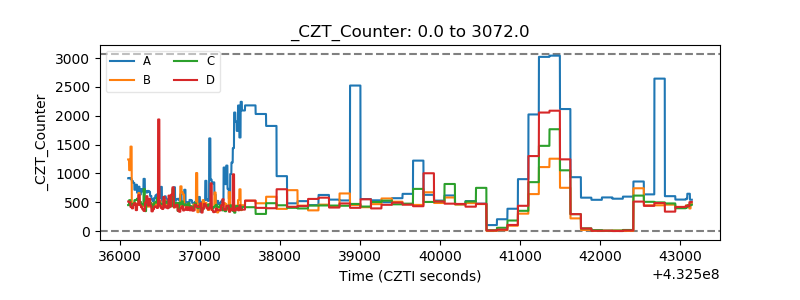 |
| +2.5 Volts monitor | 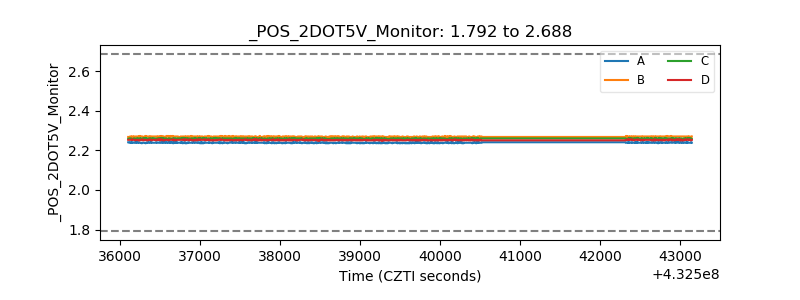 |
| +5 Volts monitor | 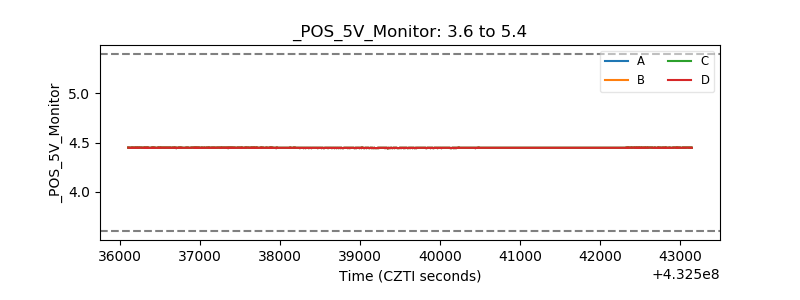 |
| _ROLL_ROT | 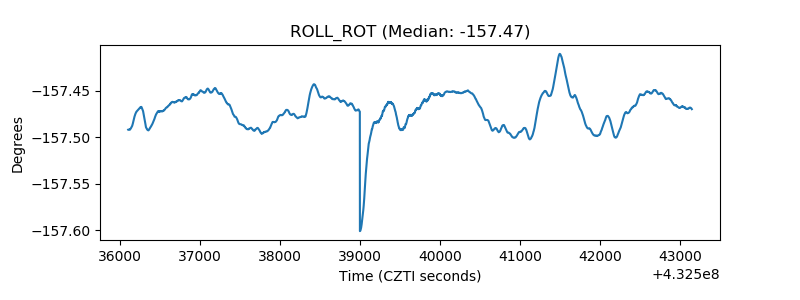 |
| _Roll_DEC | 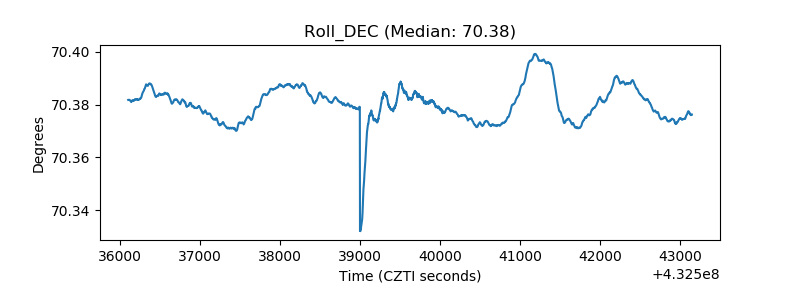 |
| _Roll_RA | 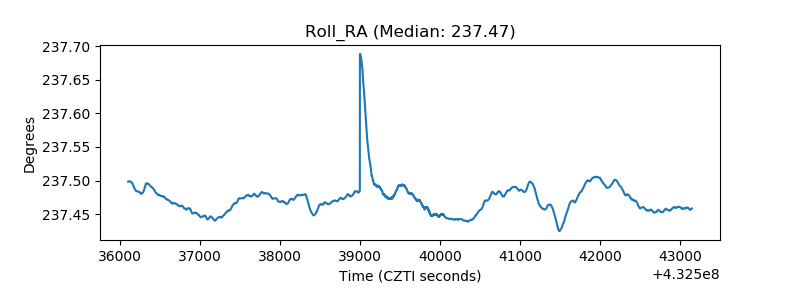 |
| Veto Counter | 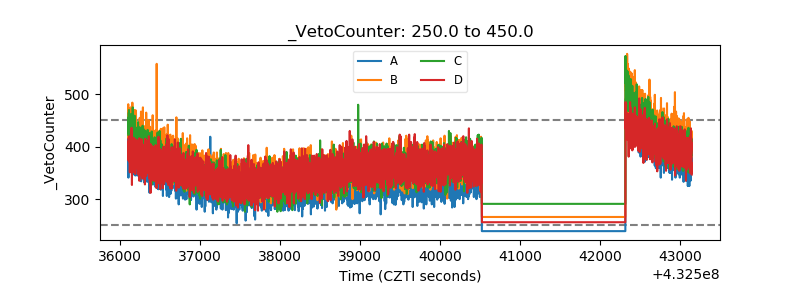 |