| Param | Original file | Final file |
|---|---|---|
| Filename | modeM0/AS1C07_001T10_9000005844_43081cztM0_level2.fits | modeM0/AS1C07_001T10_9000005844_43081cztM0_level2_quad_clean.evt |
| Size (bytes) | 315,748,800 | 90,368,640 |
| Size | 301.1 MB | 86.2 MB |
| Events in quadrant A | 3,298,189 | 612,344 |
| Events in quadrant B | 2,695,312 | 633,658 |
| Events in quadrant C | 2,508,814 | 581,479 |
| Events in quadrant D | 2,782,386 | 546,748 |
| Mode SS | |||
|---|---|---|---|
| Quadrant | BADHDUFLAG | Total packets | Discarded packets |
| A | 0 | 104 | 0 |
| B | 0 | 104 | 0 |
| C | 0 | 104 | 0 |
| D | 0 | 104 | 0 |
| Mode M9 | |||
|---|---|---|---|
| Quadrant | BADHDUFLAG | Total packets | Discarded packets |
| A | 0 | 24 | 0 |
| B | 0 | 25 | 0 |
| C | 0 | 25 | 0 |
| D | 0 | 25 | 0 |
| Mode M0 | |||
|---|---|---|---|
| Quadrant | BADHDUFLAG | Total packets | Discarded packets |
| A | 0 | 12904 | 2 |
| B | 0 | 11414 | 2 |
| C | 0 | 10672 | 3 |
| D | 0 | 11813 | 2 |
| Quadrant | Total seconds | Saturated seconds | Saturation percentage |
|---|---|---|---|
| A | 5176 | 118 | 2.279753% |
| B | 5176 | 12 | 0.231839% |
| C | 5175 | 18 | 0.347826% |
| D | 5175 | 73 | 1.410628% |
Noise dominated data is calculated using 1-second bins in cleaned event files. If a bin has >2000 counts, and if more than 50% of those come from <1% of pixels, then it is considered to be noise-dominated and hence unusable.
| Quadrant | # 1 sec bins | Bins with >0 counts | Bins with >2000 counts | High rate bins dominated by noise | Noise dominated (total time) | Noise dominated (detector-on time) | Marked lightcurve |
|---|---|---|---|---|---|---|---|
| A | 7089 | 5177 | 70 | 70 | 0.99% | 1.35% | 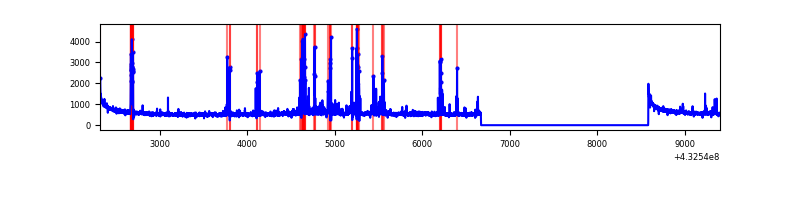 |
| B | 7089 | 5177 | 7 | 7 | 0.10% | 0.14% | 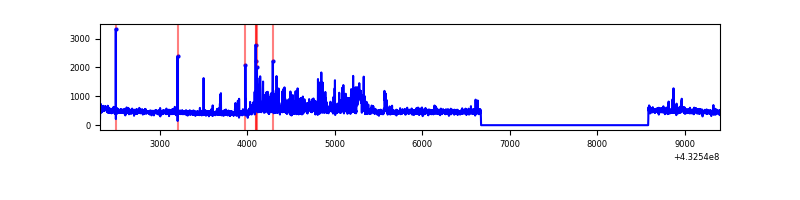 |
| C | 7088 | 5176 | 13 | 13 | 0.18% | 0.25% | 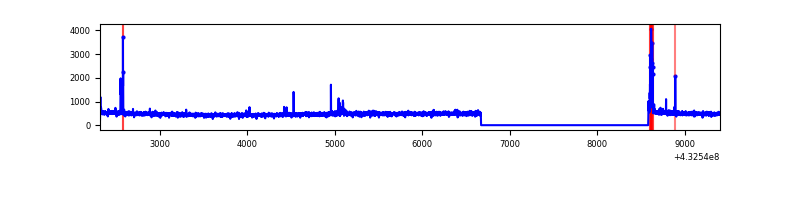 |
| D | 7088 | 5176 | 51 | 51 | 0.72% | 0.99% | 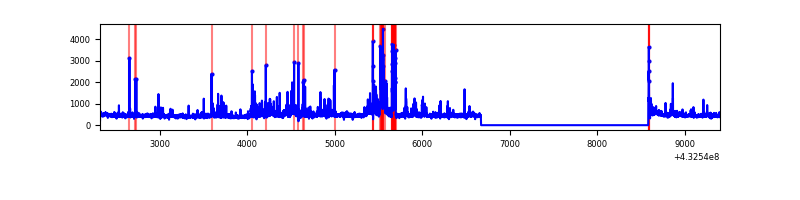 |
Top three noisy pixels from each quadrant. If the there are fewer than three noisy pixels in the level2.evt file, extra rows are filled as -1
| Pixel properties | Quadrant properties | ||||||
|---|---|---|---|---|---|---|---|
| Quadrant | DetID | PixID | Counts | Sigma | Mean | Median | Sigma |
| A | 10 | 83 | 584213 | 4875.08 | 582 | 571 | 119.7 |
| A | 15 | 237 | 333119 | 2777.73 | 582 | 571 | 119.7 |
| A | 12 | 189 | 82370 | 683.26 | 582 | 571 | 119.7 |
| B | 0 | 186 | 283162 | 2568.21 | 579 | 564 | 110.0 |
| B | 0 | 229 | 87219 | 787.51 | 579 | 564 | 110.0 |
| B | 5 | 255 | 21658 | 191.7 | 579 | 564 | 110.0 |
| C | 15 | 214 | 236300 | 1827.82 | 558 | 562 | 129.0 |
| C | 12 | 2 | 53203 | 408.16 | 558 | 562 | 129.0 |
| C | 14 | 254 | 33314 | 253.95 | 558 | 562 | 129.0 |
| D | 12 | 233 | 210545 | 1541.22 | 566 | 550 | 136.3 |
| D | 12 | 16 | 145726 | 1065.49 | 566 | 550 | 136.3 |
| D | 1 | 52 | 85048 | 620.16 | 566 | 550 | 136.3 |
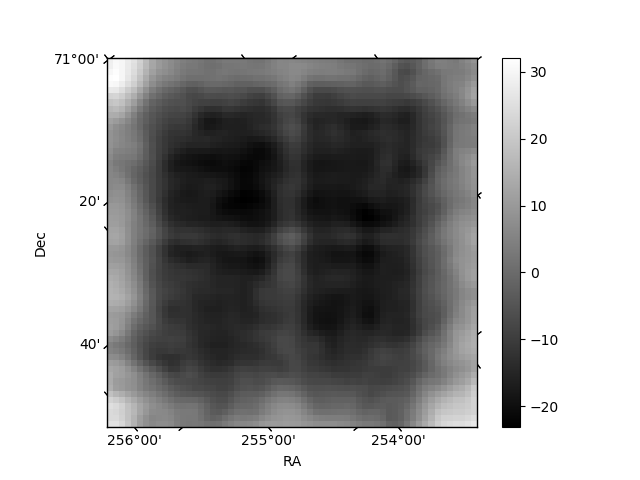
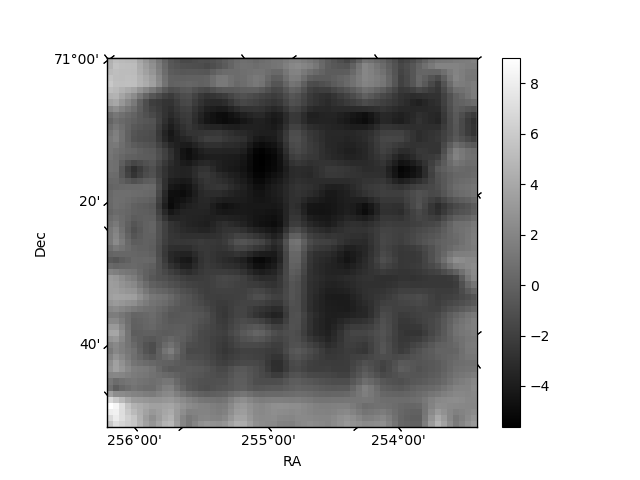
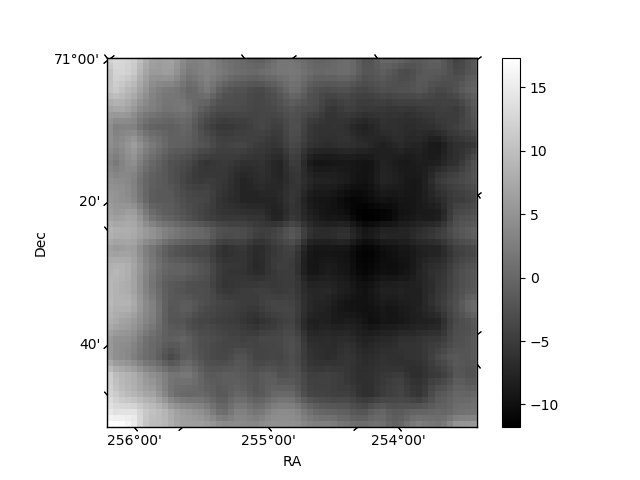
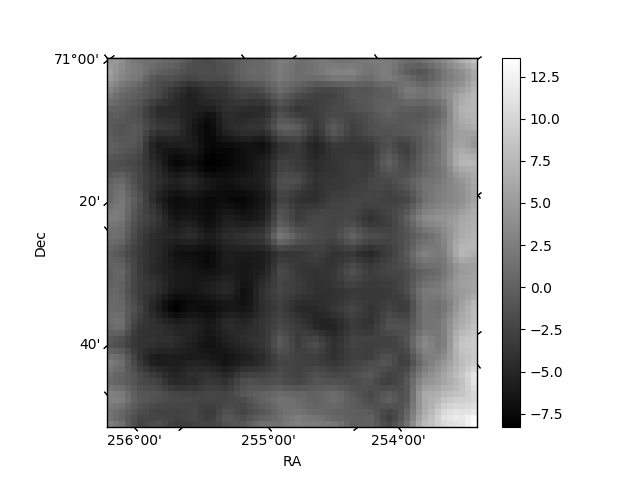
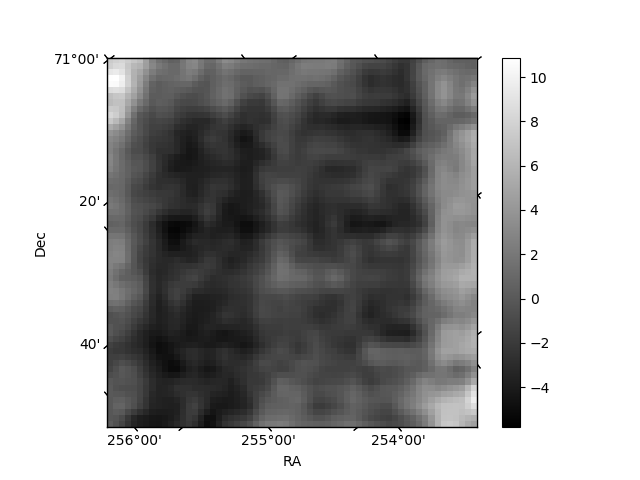
Histogram calculated using DETX and DETY for each event in the final _common_clean file
| Quadrant A | 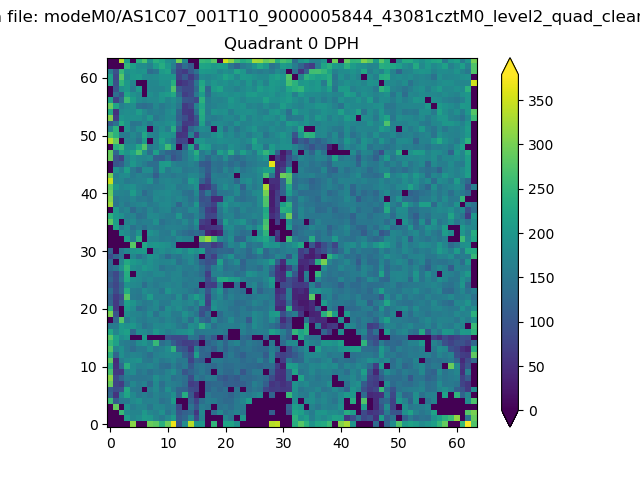 |
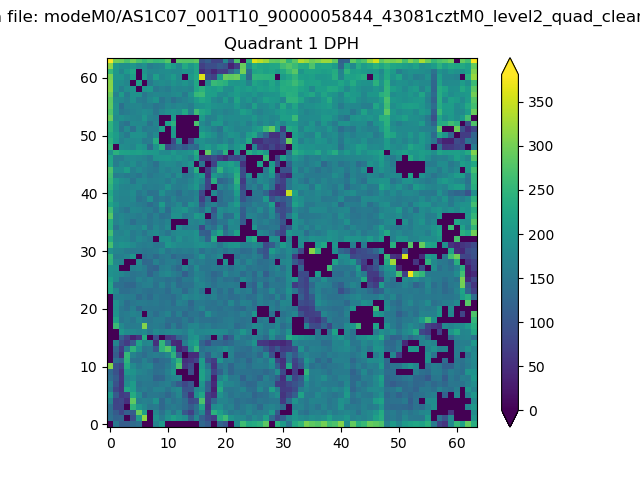 |
Quadrant B |
|---|---|---|---|
| Quadrant D | 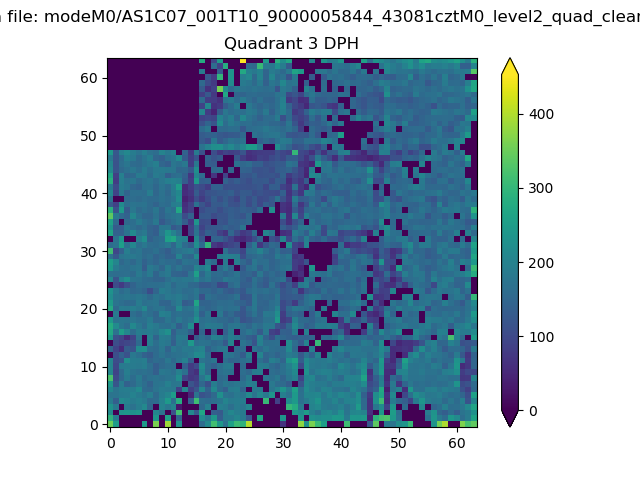 |
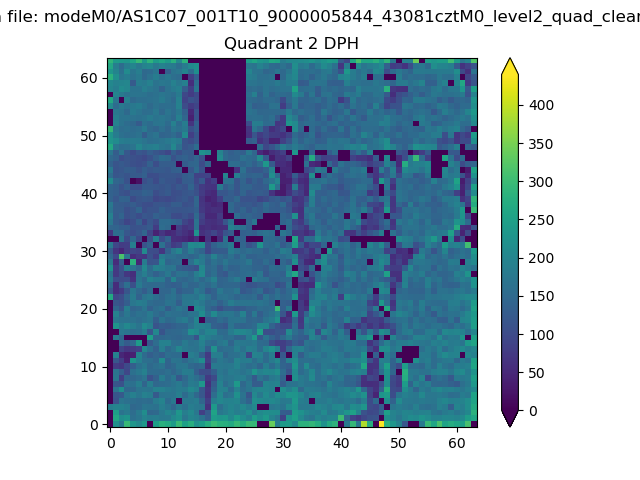 |
Quadrant C |
| Plot type | Count rate plots | Images |
|---|---|---|
| Comparison with Poisson distribution Blue bars denote a histogram of data divided into 1 sec bins. Red curve is a Poisson curve with rate = median count rate of data. |
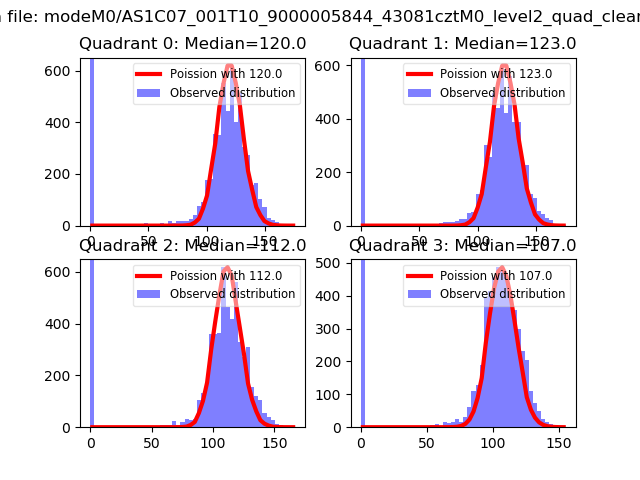 |
 |
| Quadrant-wise count rates Data is divided into 100 sec bins |
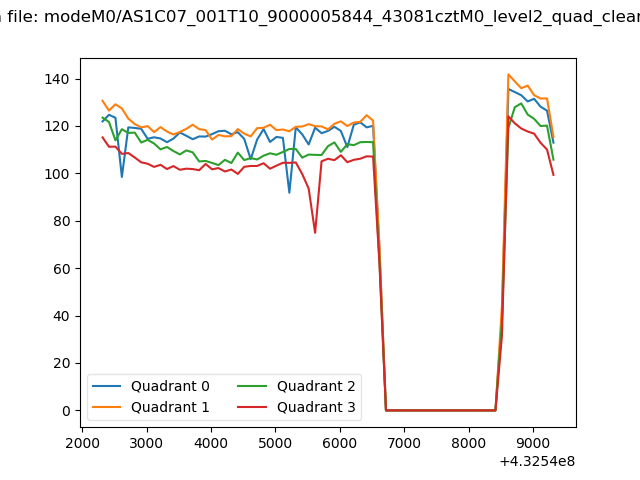 |
|
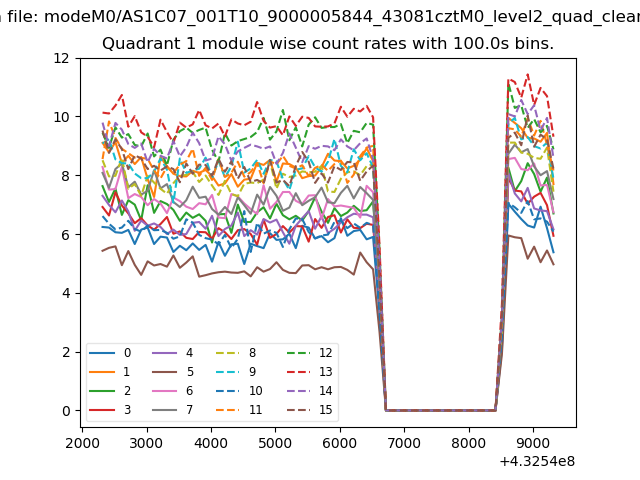
| Module-wise count rates for Quadrant A Data is divided into 100 sec bins |
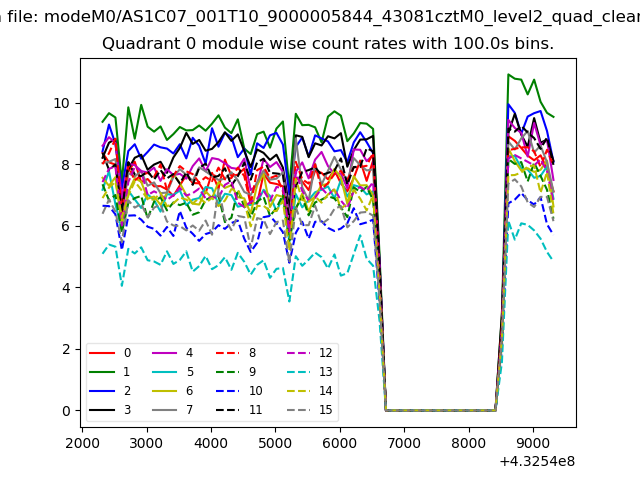 |
 |
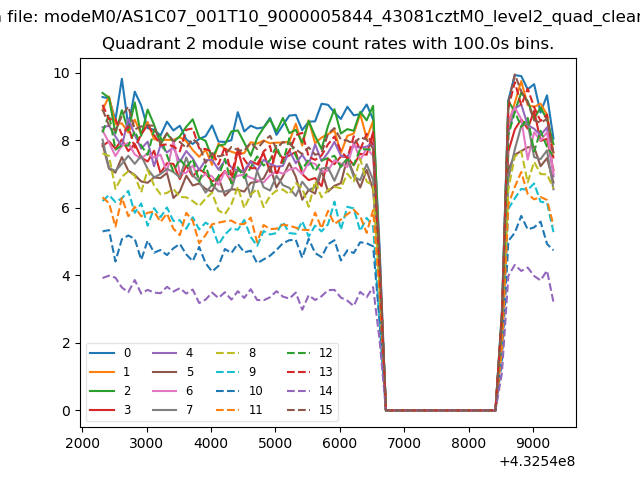
| Module-wise count rates for Quadrant B Data is divided into 100 sec bins |
 |
 |
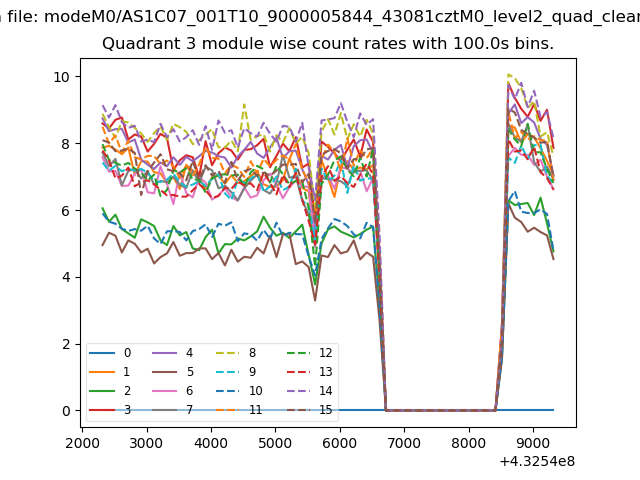
| Module-wise count rates for Quadrant C Data is divided into 100 sec bins |
 |
 |
| Module-wise count rates for Quadrant D Data is divided into 100 sec bins |
 |
 |
| Parameter | Plot |
|---|---|
| CZT HV Monitor | 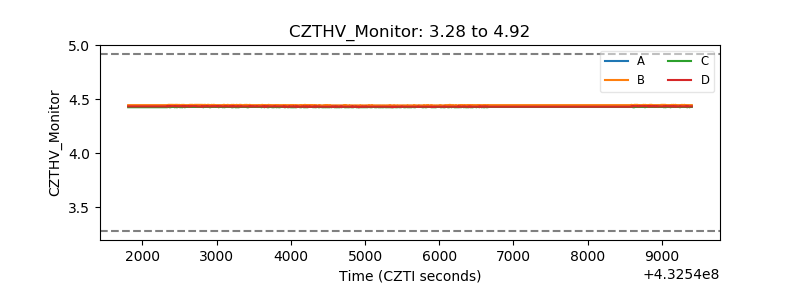 |
| D_VDD | 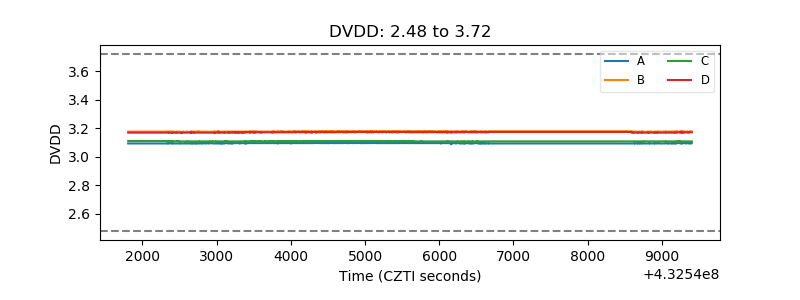 |
| Temperature 1 | 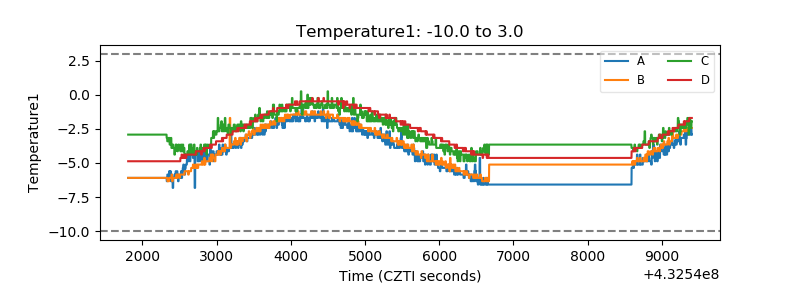 |
| Veto HV Monitor | 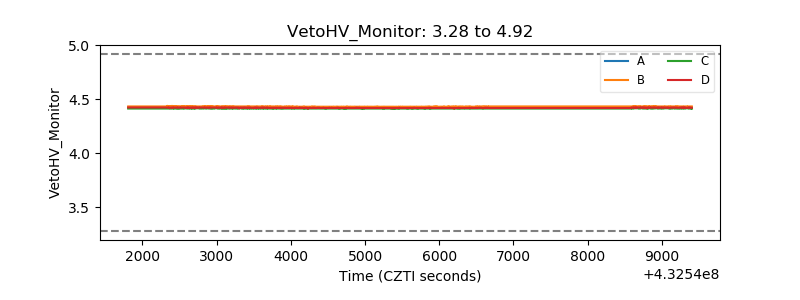 |
| Veto LLD | 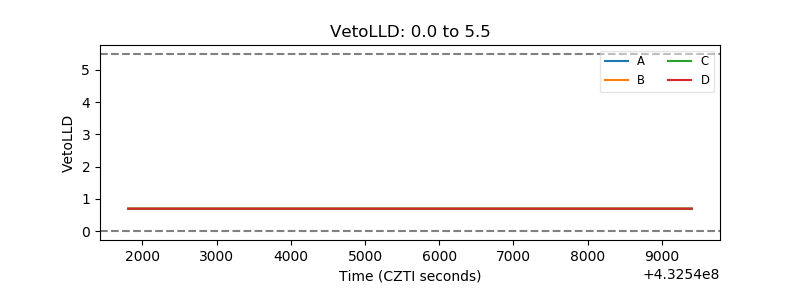 |
| Alpha Counter | 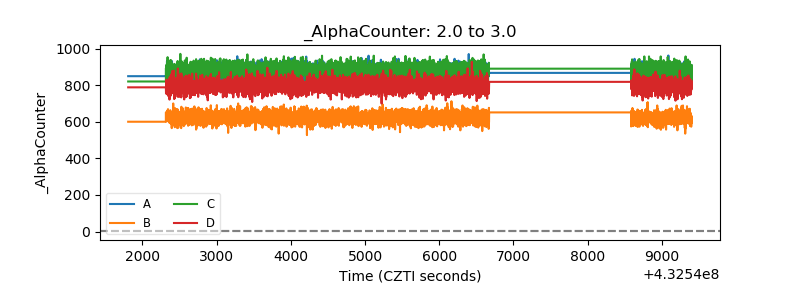 |
| _CPM_Rate | 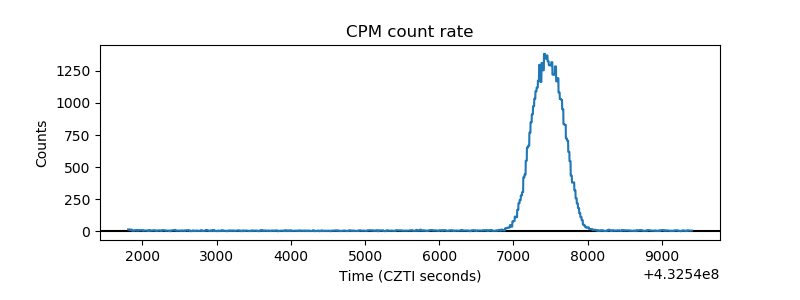 |
| CZT Counter | 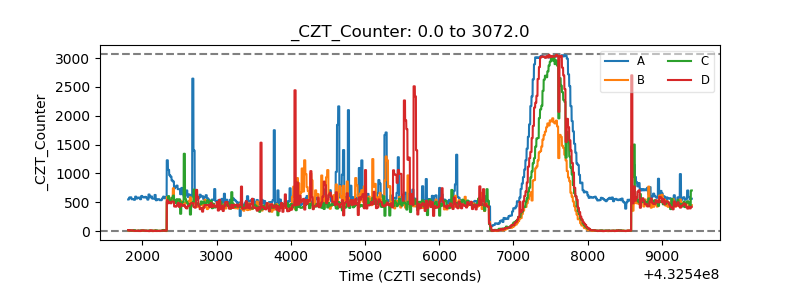 |
| +2.5 Volts monitor | 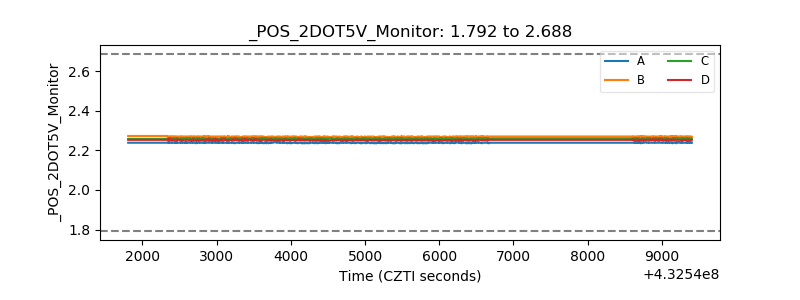 |
| +5 Volts monitor | 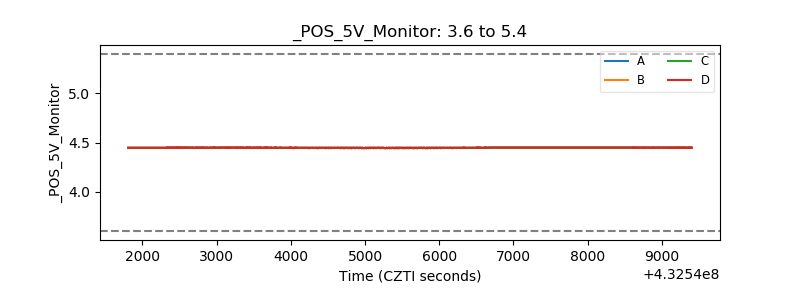 |
| _ROLL_ROT | 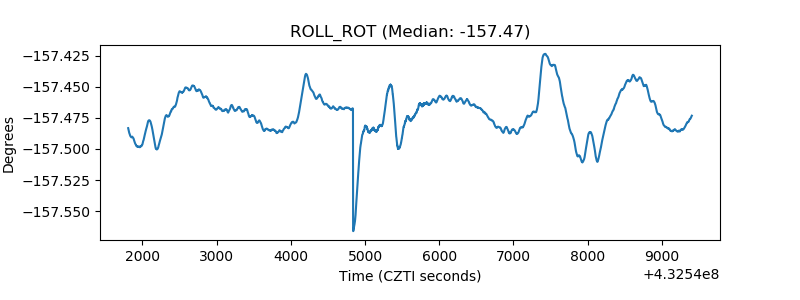 |
| _Roll_DEC | 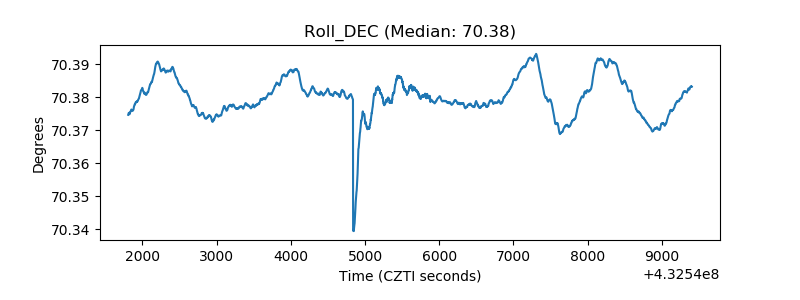 |
| _Roll_RA | 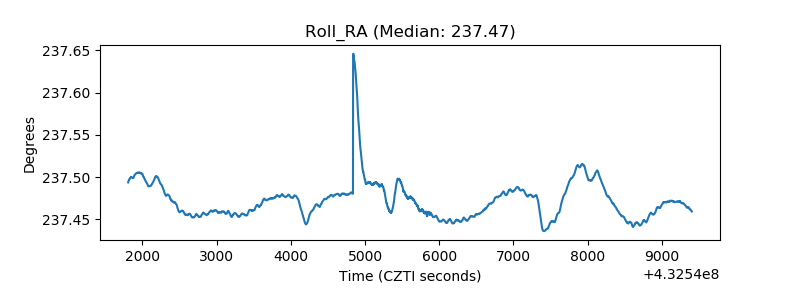 |
| Veto Counter | 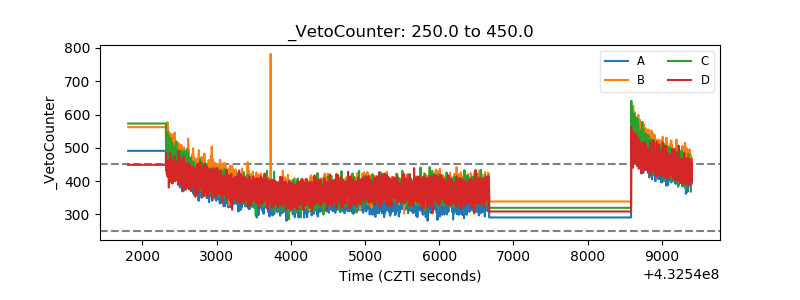 |